UnitedHealth beats estimates and raises outlook

United Healthcare [$UNH] issued a press release on its quarterly results before the market opened with the following headlines:
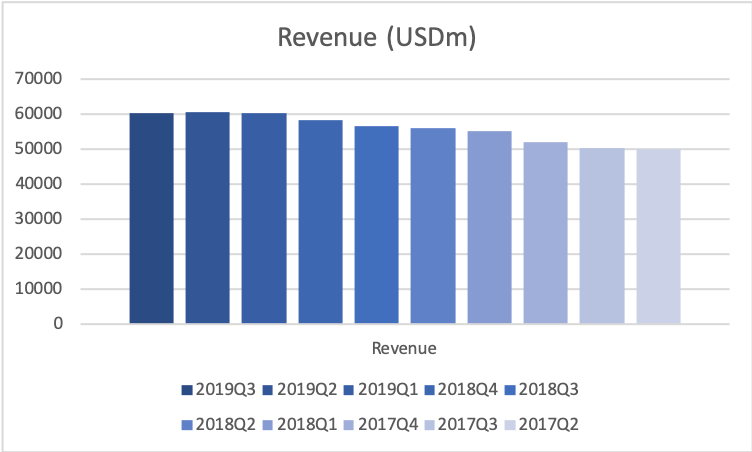
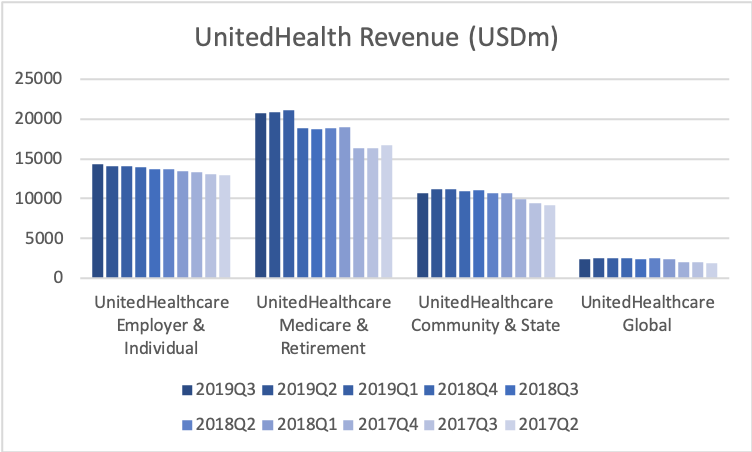
  • Total Revenues of $60.4 Billion Grew by 7% or $3.8 Billion Year-over-Year
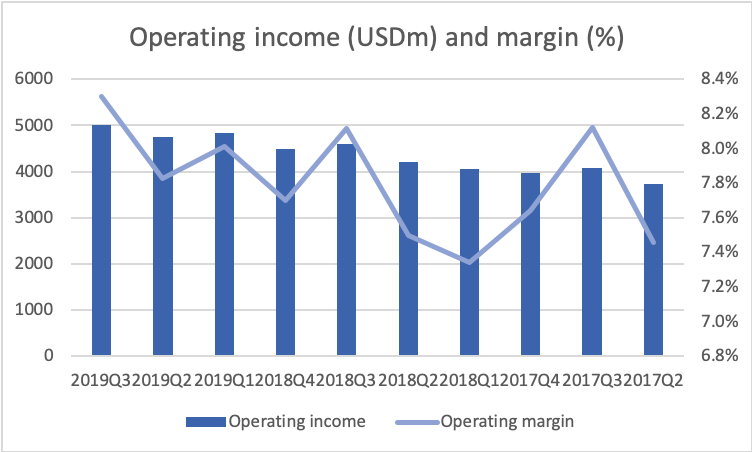
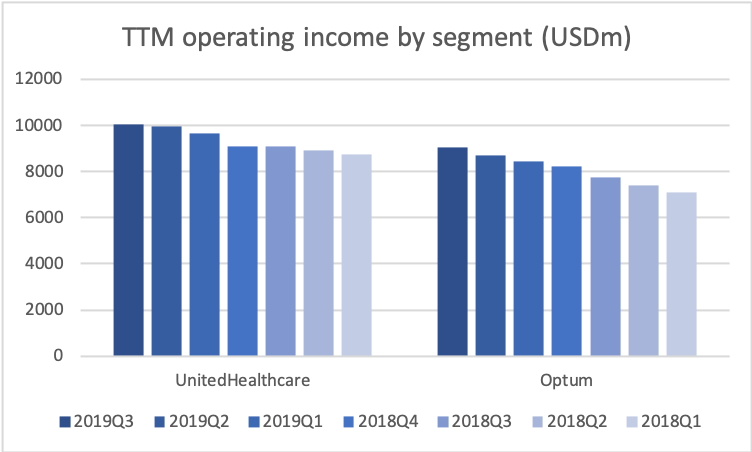
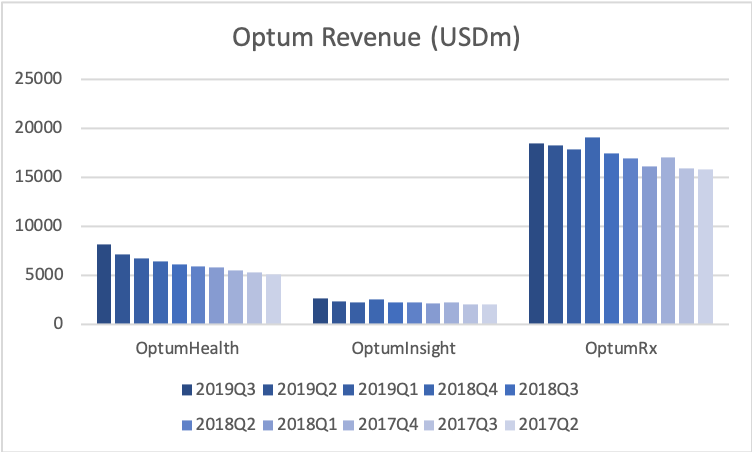
  • Operating Earnings Grew 9% to $5.0 Billion, Including Double-Digit Growth Rates in Each Optum Business
  • Net Earnings Per Share were $3.67, Adjusted Net Earnings Per Share were $3.88, Bringing Year-To-Date Growth to 17%
  • Cash Flows from Operations were $3.2 Billion in the Quarter, Bringing Year-To-Date Cash Flows from Operations to $12.3 Billion or 1.2x Net Income

The share price went from $220.59 to a closing price of $238.59 (+8.2%) following the earnings release and comments by the CEO David Wichmann and the CFO John Rex during the earnings call.
“Based on this year’s year-to-date performance, we have increased our outlook for full year 2019 adjusted earnings to a range of $14.90 to $15.00 per share.”

“Our strong year-to-date results lead us to raise our full year 2019 outlook for adjusted earnings to a range of $14.90 to $15.00 per share, at the mid-point an increase of $0.40 per share from the initial outlook we provided late last year.”

Financials

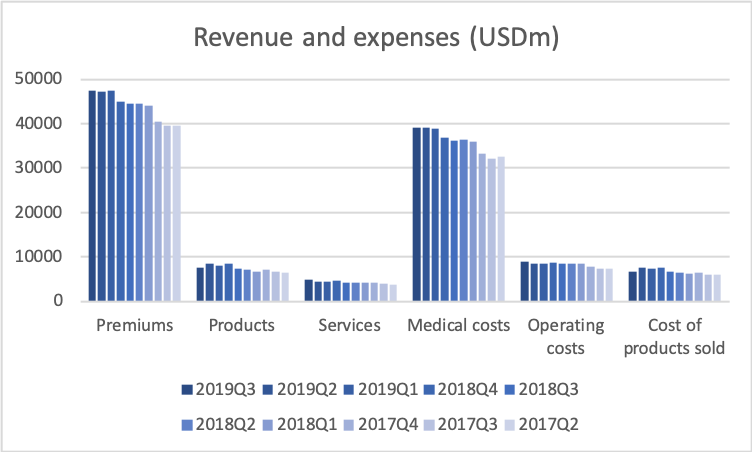
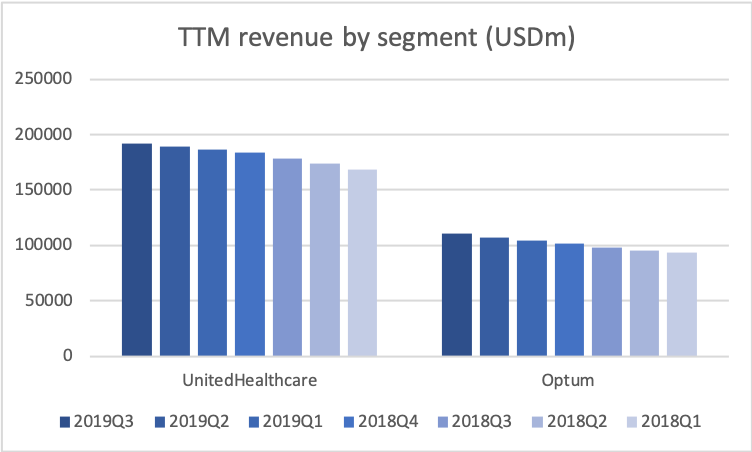
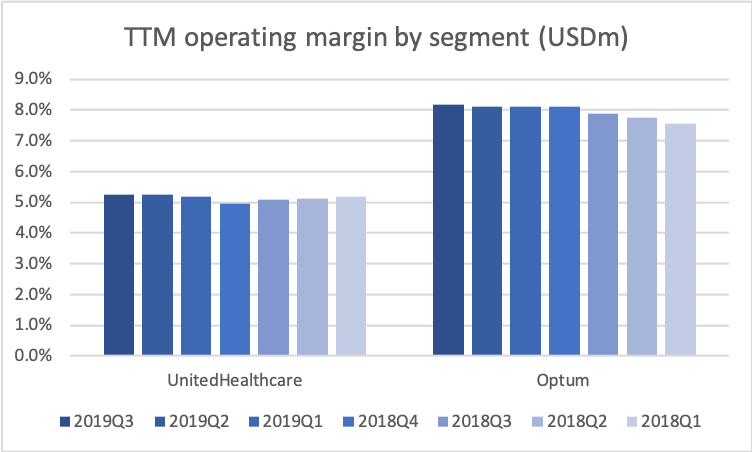
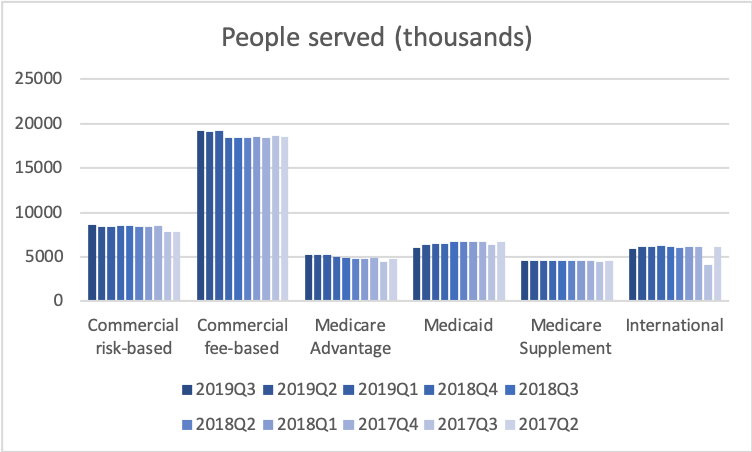
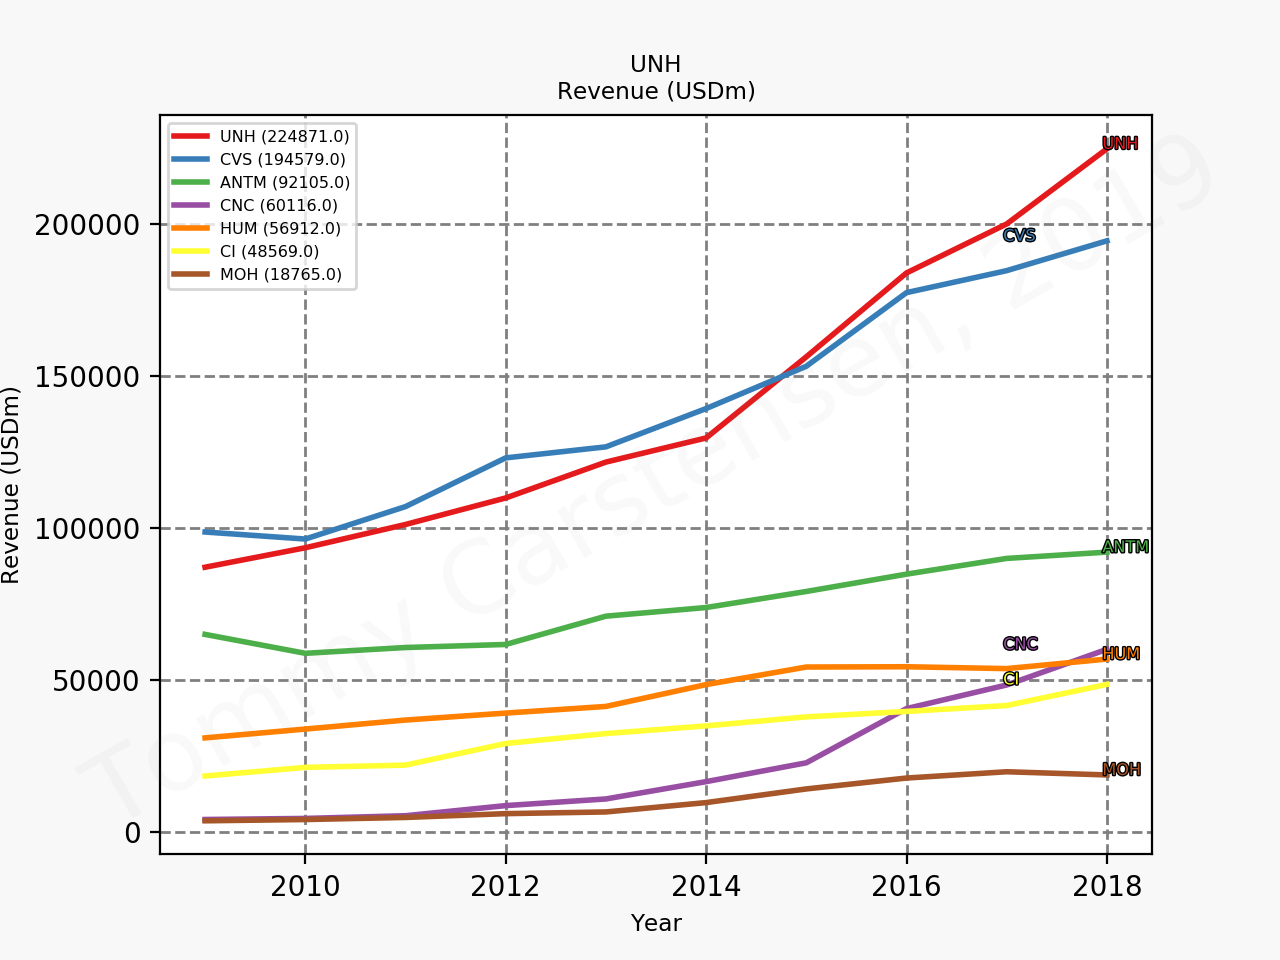
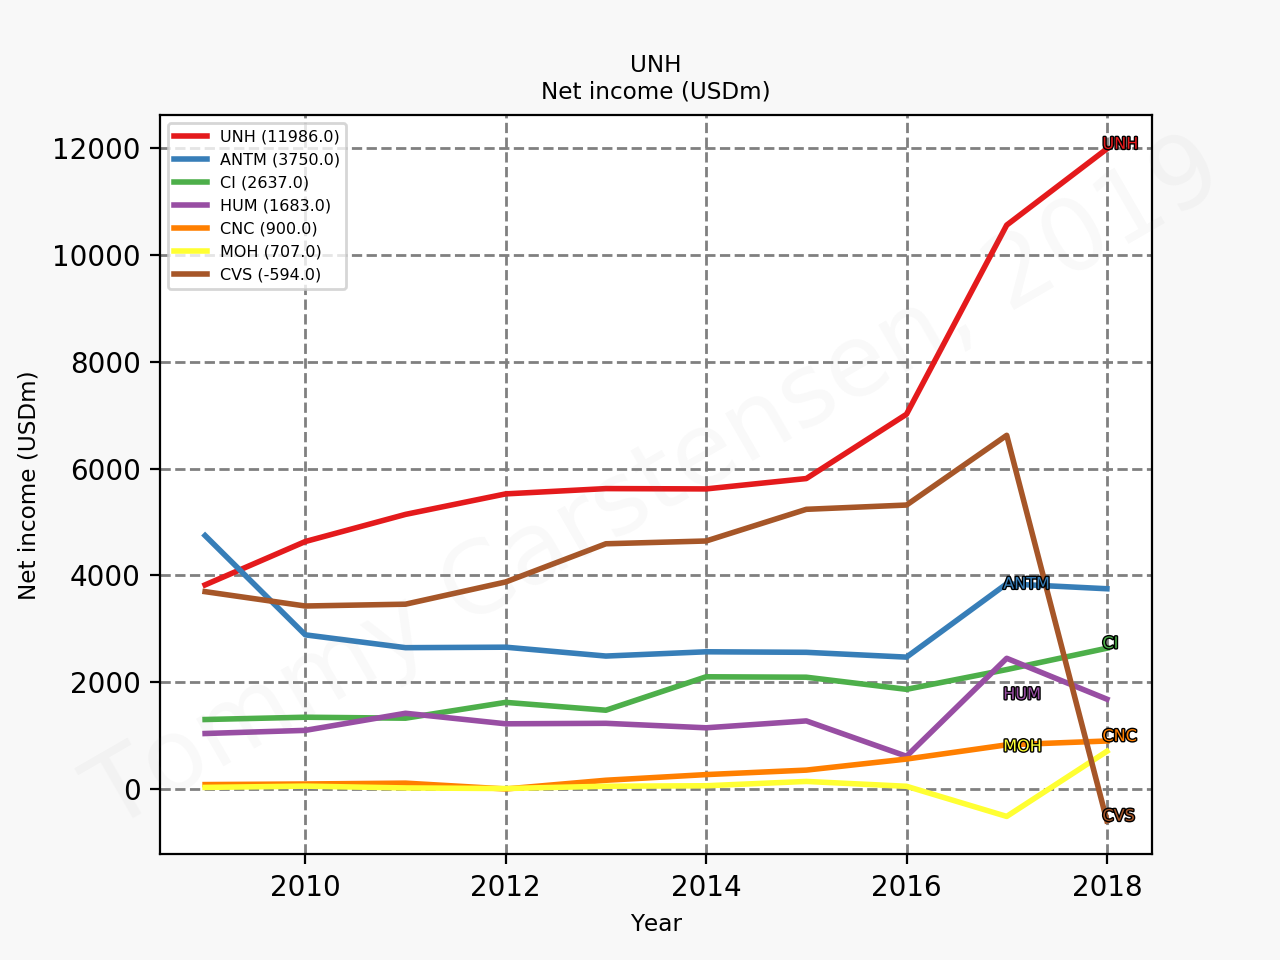
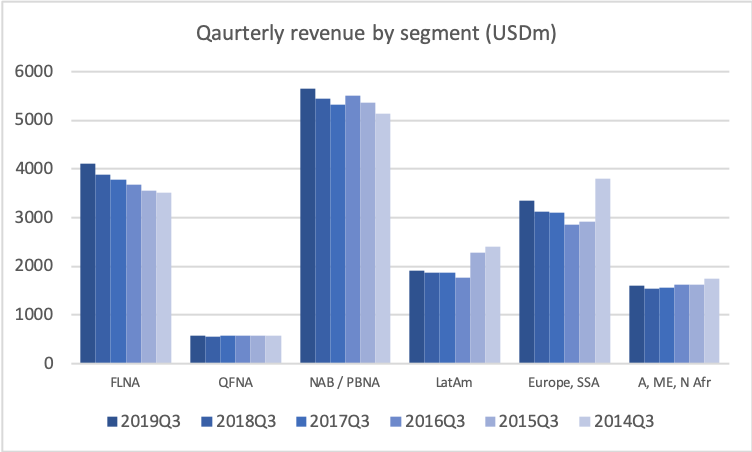
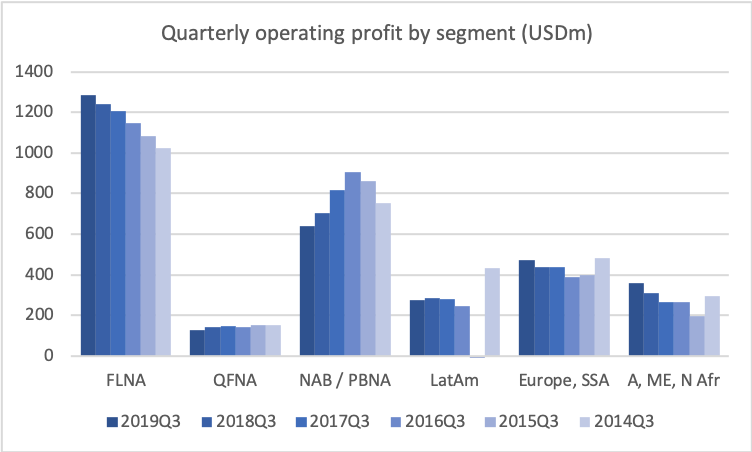
The figures below summarise the increasing revenue and operating income in each of the operating segments.

Sector comparison

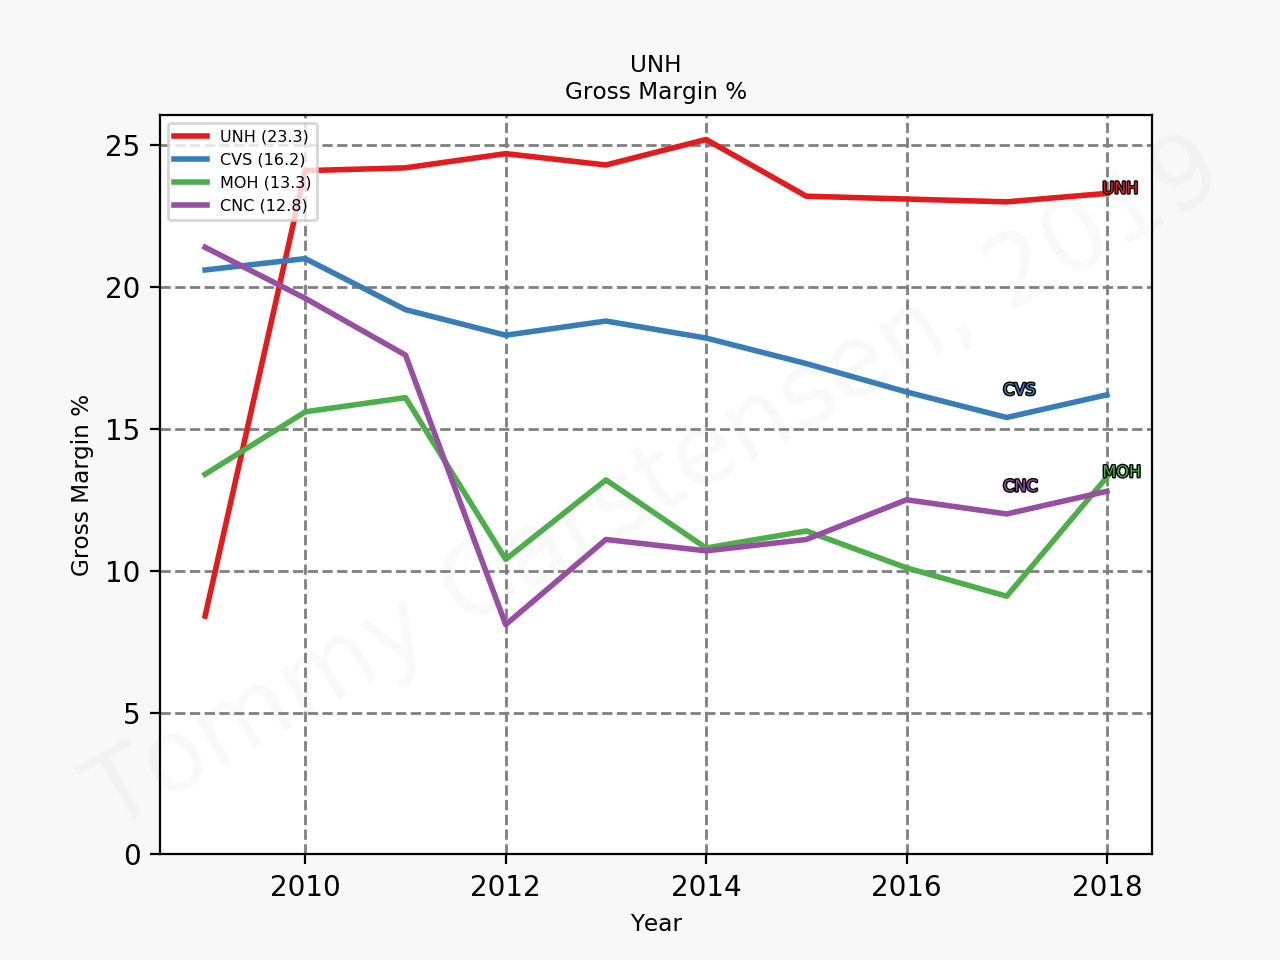
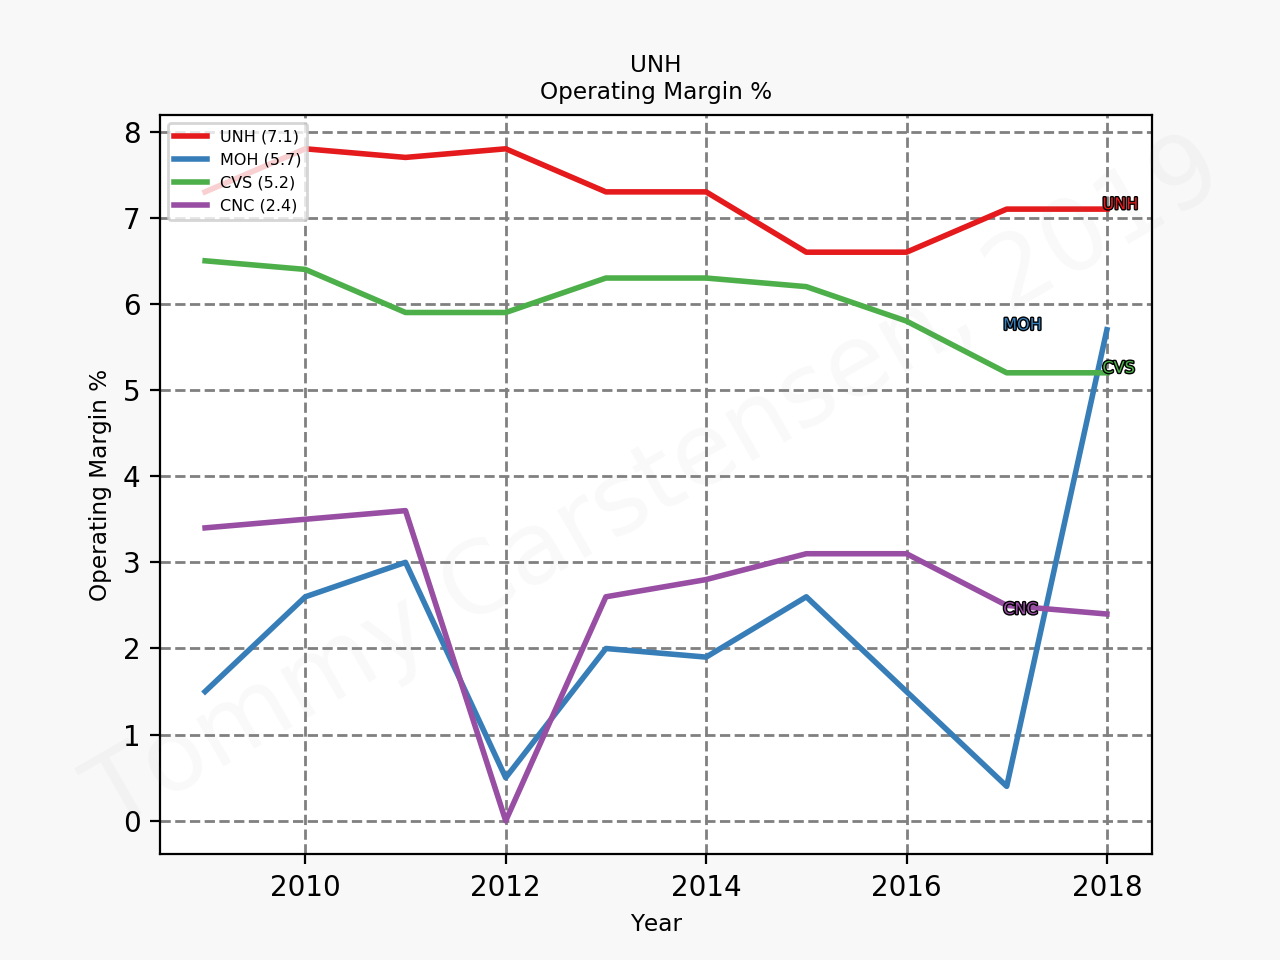
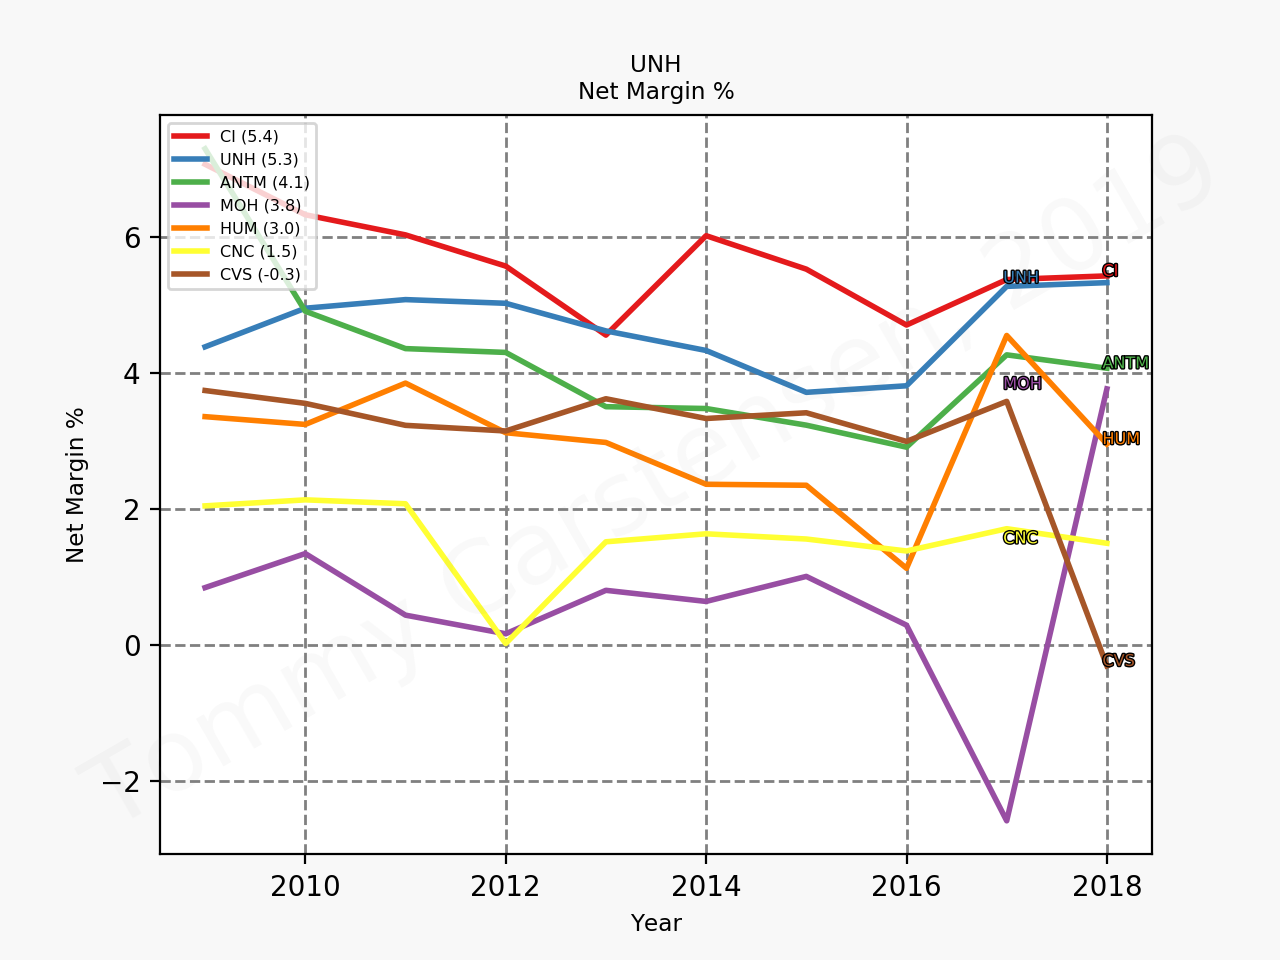
UnitedHealth has the best margins in the industry, but the multiples are also higher as a consequence. The recent pullback provided an entry option at somewhat lower multiples, but the share price growth has mostly been fuelled by expansion of multiples in recent years.

Media coverage

Reuters – UnitedHealth sees 2020 profit above Street target; shares climb 8%

Bloomberg – Health Insurers Gain Most Since 2013 as Medical Cost Fears Ease

European earnings calendar

Three important indexes in Europe are the STOXX Europe 50 for Europe and the EURO STOXX 50 for the Eurozone and the S&P 350 Europe.

The EURO STOXX 50 Index, Europe’s leading blue-chip index for the Eurozone, provides a blue-chip representation of supersector leaders in the region.

The STOXX Europe 50 Index, Europe’s leading Blue-chip index, provides a representation of supersector leaders in Europe.

Below are the earnings dates for the components of the STOXX indices in a sortable table.

NameTickerEarningsIndustryCityEmployees
ASML Holding N.V.ASML.AS2019-10-16SemiconductorVeldhoven22125
Nestle S.A.NESN.SW2019-10-17Packaged FoodsVevey308000
SAP SESAP.DE2019-10-21SoftwareWalldorf98332
UBS Group AGUBSG.SW2019-10-22BanksZurich66922
Novartis AGNOVN.SW2019-10-22Drug ManufacturersBasel108000
ABB LtdABBN.SW2019-10-23Diversified IndustrialsZurich147000
Iberdrola, S.A.IBE.MC2019-10-23UtilitiesBilbao34210
BASF SEBAS.DE2019-10-24ChemicalsLudwigshafen118705
Daimler AGDAI.DE2019-10-24Auto ManufacturersStuttgart304065
Eni S.p.A.ENI.MI2019-10-24Oil & Gas IntegratedRome32011
AstraZeneca PLCAZN.L2019-10-24Drug ManufacturersCambridge64400
Nokia CorporationNOKIA.HE2019-10-24Communication EquipmentEspoo103083
AB InBev SA/NVABI.BR2019-10-25BeveragesLeuven175000
Philips N.V.PHIA.AS2019-10-28Diagnostics & ResearchAmsterdam77748
Orange S.A.ORA.PA2019-10-29TelecomParis135943
BP p.l.c.BP.L2019-10-29Oil & Gas IntegratedLondon69600
Fresenius SE & Co. KGaAFRE.DE2019-10-29Medical CareBad Homburg288459
TOTAL S.A.FP.PA2019-10-30Oil & Gas IntegratedParis104460
Banco Santander, S.A.SAN.MC2019-10-30BanksMadrid201804
Bayer AktiengesellschaftBAYN.DE2019-10-30Drug ManufacturersLeverkusen115498
GlaxoSmithKline plcGSK.L2019-10-30Drug ManufacturersBrentford95490
Airbus SEAIR.PA2019-10-30Aerospace & DefenseLeiden136343
Telefonica, S.A.TEF.MC2019-10-31TelecomMadrid118384
BBVA, S.A.BBVA.MC2019-10-31BanksBilbao126017
ING Groep N.V.INGA.AS2019-10-31BanksAmsterdam53000
BNP Paribas SABNP.PA2019-10-31BanksParis202000
SanofiSAN.PA2019-10-31Drug ManufacturersParis104226
Intesa Sanpaolo S.p.A.ISP.MI2019-11-05BanksTurin90888
adidas AGADS.DE2019-11-06Footwear & AccessoriesHerzogenaurach56753
Ahold Delhaize N.V.AD.AS2019-11-06Grocery StoresZaandam372000
Societe Generale SAGLE.PA2019-11-06BanksParis149000
Deutsche Telekom AGDTE.DE2019-11-07TelecomBonn212762
Zurich Insurance Group AGZURN.SW2019-11-07InsuranceZurich54000
Munich ReMUV2.DE2019-11-07InsuranceMunich39869
Siemens AktiengesellschaftSIE.DE2019-11-07Diversified IndustrialsMunich384000
Amadeus IT Group, S.A.AMS.MC2019-11-07Information TechnologyMadrid17109
Enel SpAENEL.MI2019-11-07UtilitiesRome68842
Allianz SEALV.DE2019-11-08InsuranceMunich142460
Vodafone Group PlcVOD.L2019-11-12TelecomNewbury94442
Deutsche Post AGDPW.DE2019-11-12Shipping & LogisticsBonn540779
E.ON SEEOAN.DE2019-11-13UtilitiesEssen44152
National Grid plcNG.L2019-11-14UtilitiesLondon22576
Industria de Diseno Textil, S.A.ITX.MC2019-12-11Apparel StoresA Coruna167897

Reuters – More pain for Europe Inc as earnings drought seen spilling over into 2020

Reuters – Europe third-quarter earnings outlook deteriorates as trade war, Brexit bite

Costco comparable store sales miss estimates

Costco [COST] issued a press release on their quarterly results after markets closed.

Quarterly results

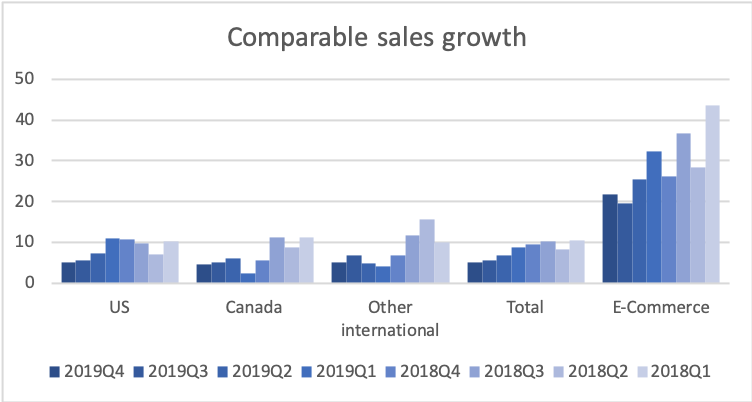
Comparable store sales missed estimates and the growth is slowing down in all segments. The US segment represents three quarters of the overall revenue.

Comparison with peers

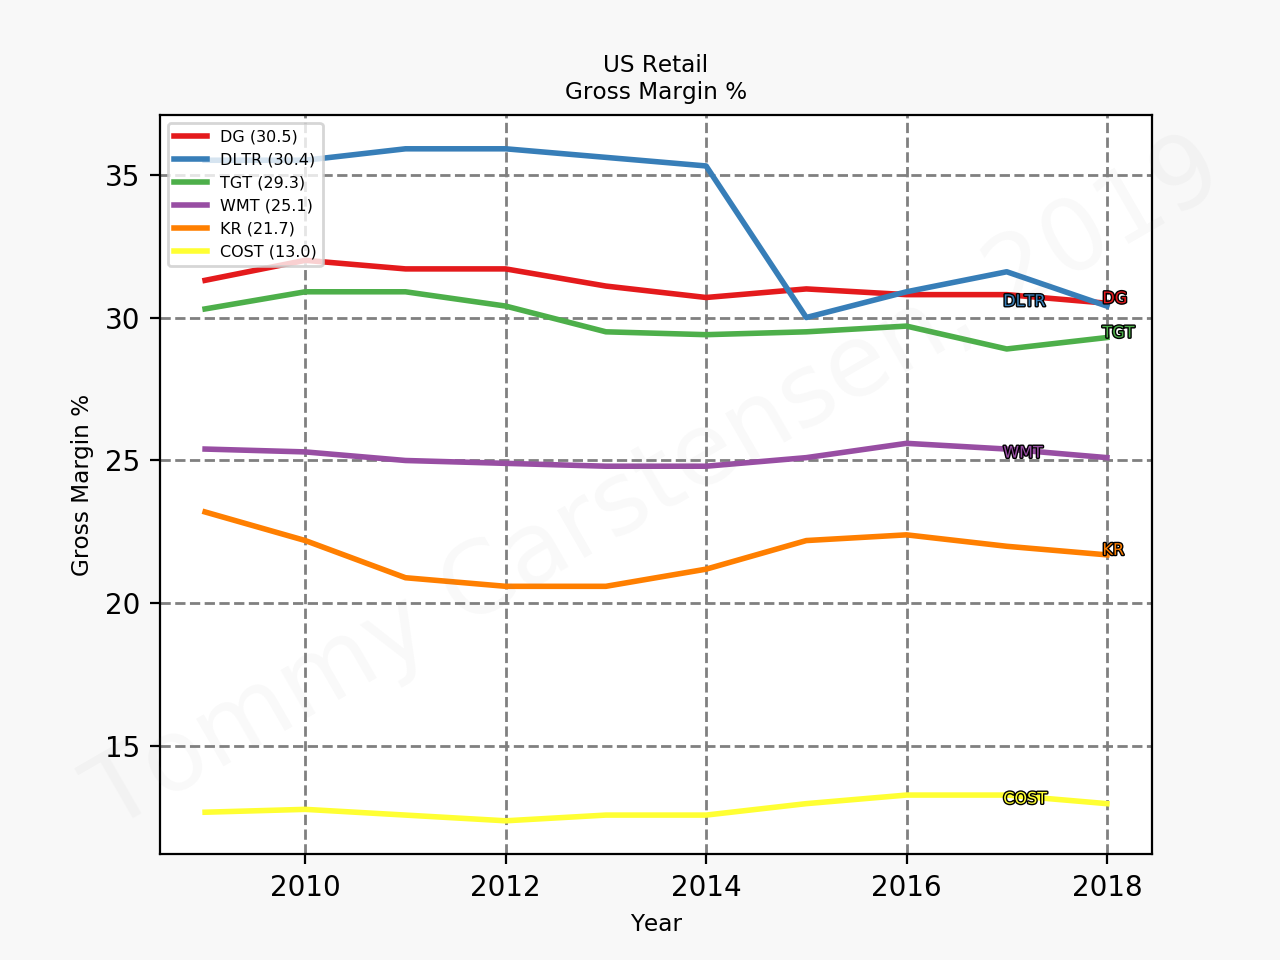
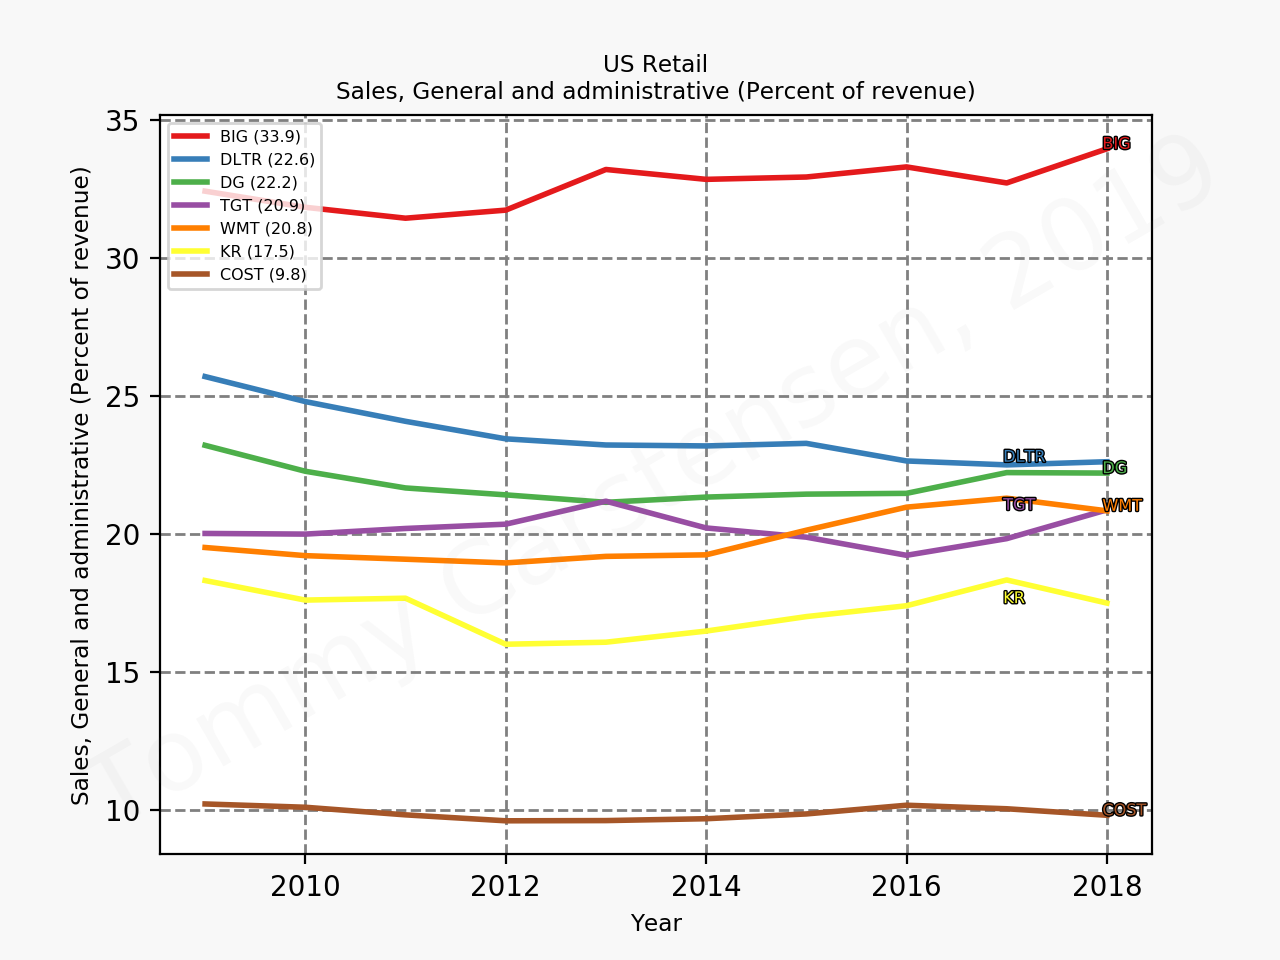
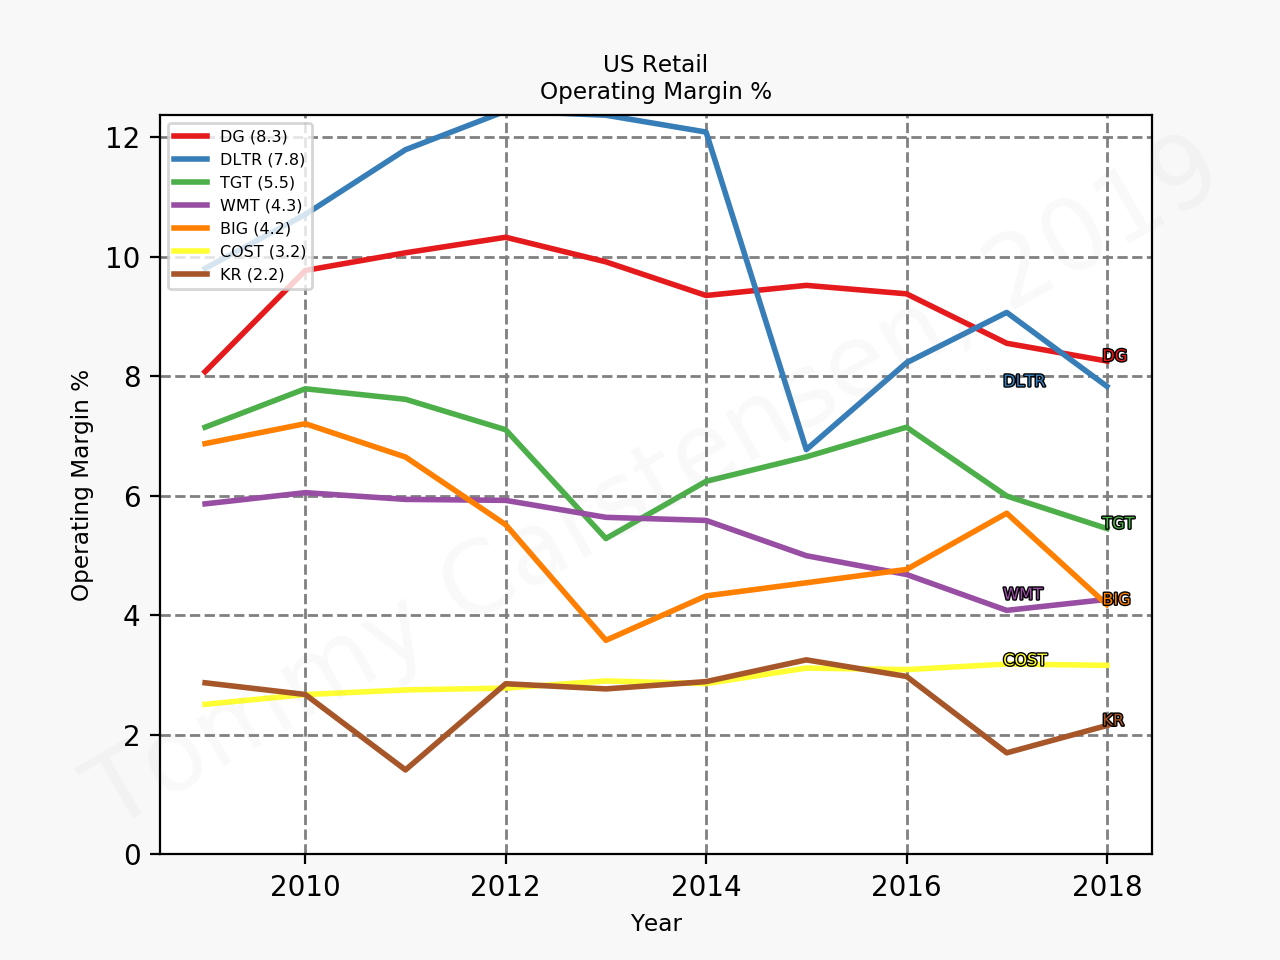
Costco has very low gross margins relative to its peers, and despite its low SG&A it has low single digit operating margins.

Gross margin for various discount stores
SG&A for various discount stores
Operating margin for various discount stores

The beauty of Costco however is their assets turnover of approximately 350%, which is only rivaled by Kroger [KR]

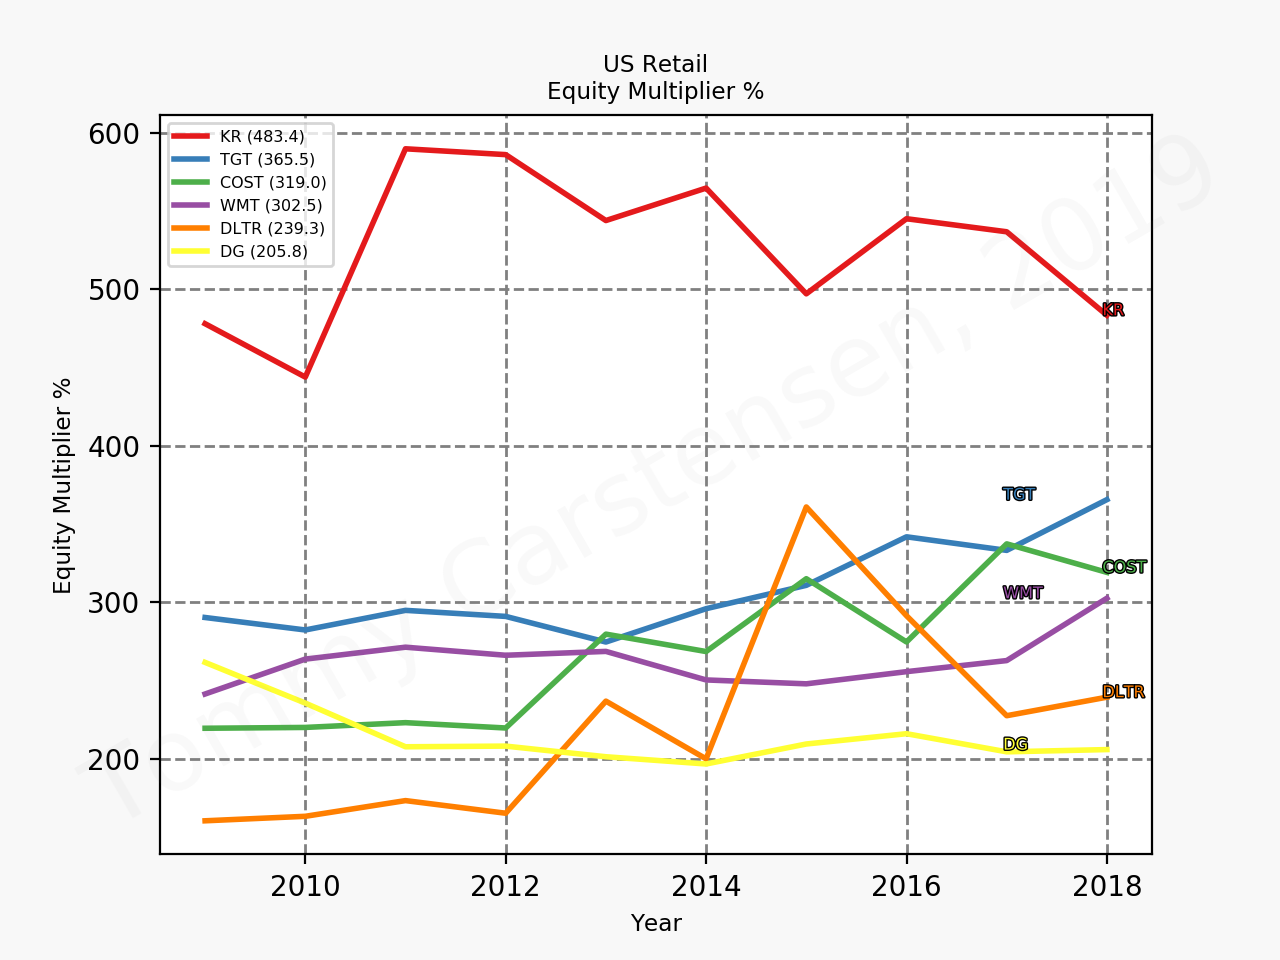
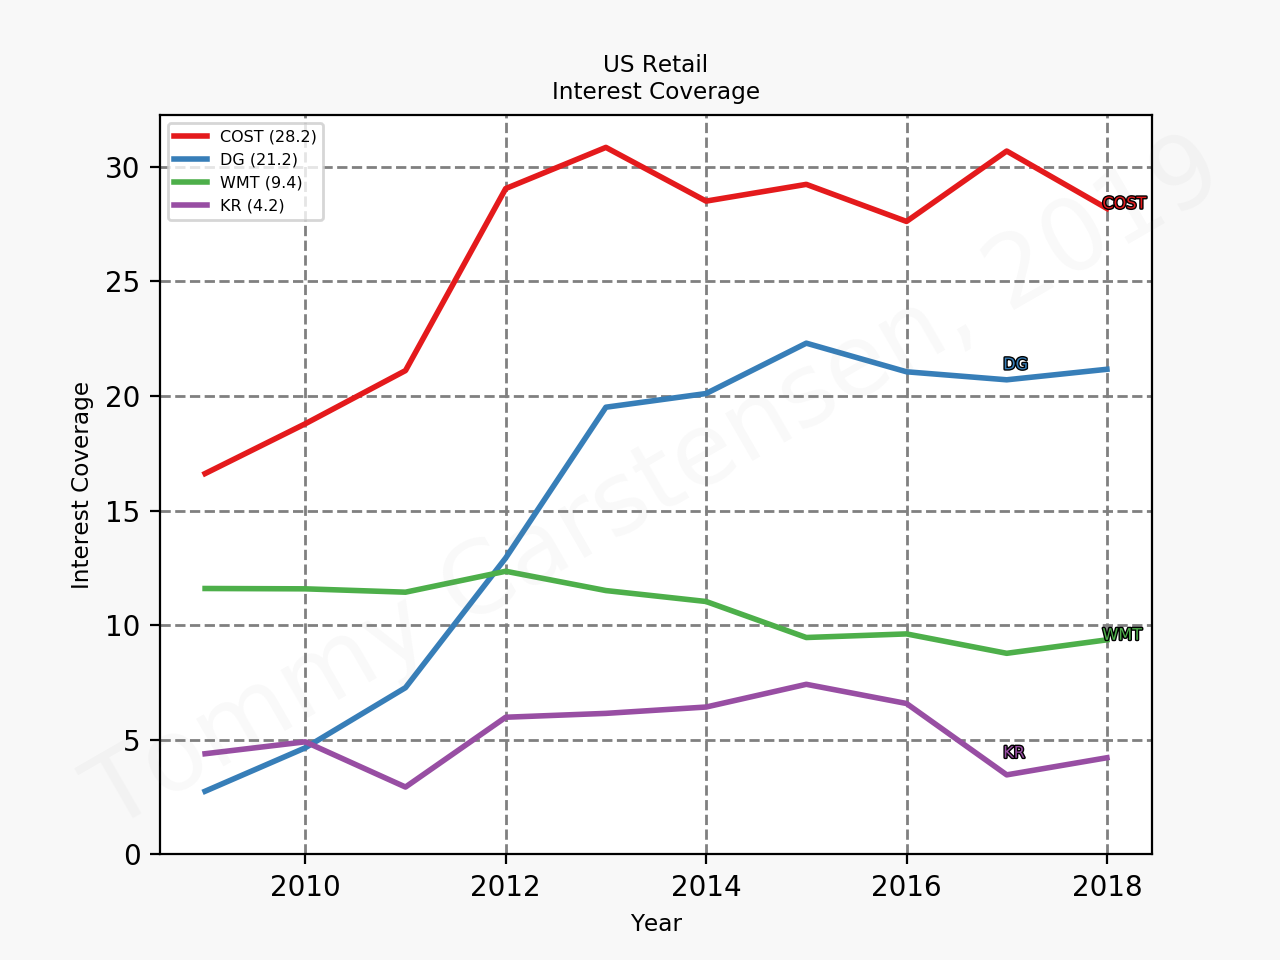
Kroger however has a much higher equity multiplier than Costco and a much lower interest coverage, which makes Costco a more attractive company than Kroger to invest in, when not taking into account valuation.

Equity multiplier for various discount stores
Interest coverage for various discount stores

Valuation

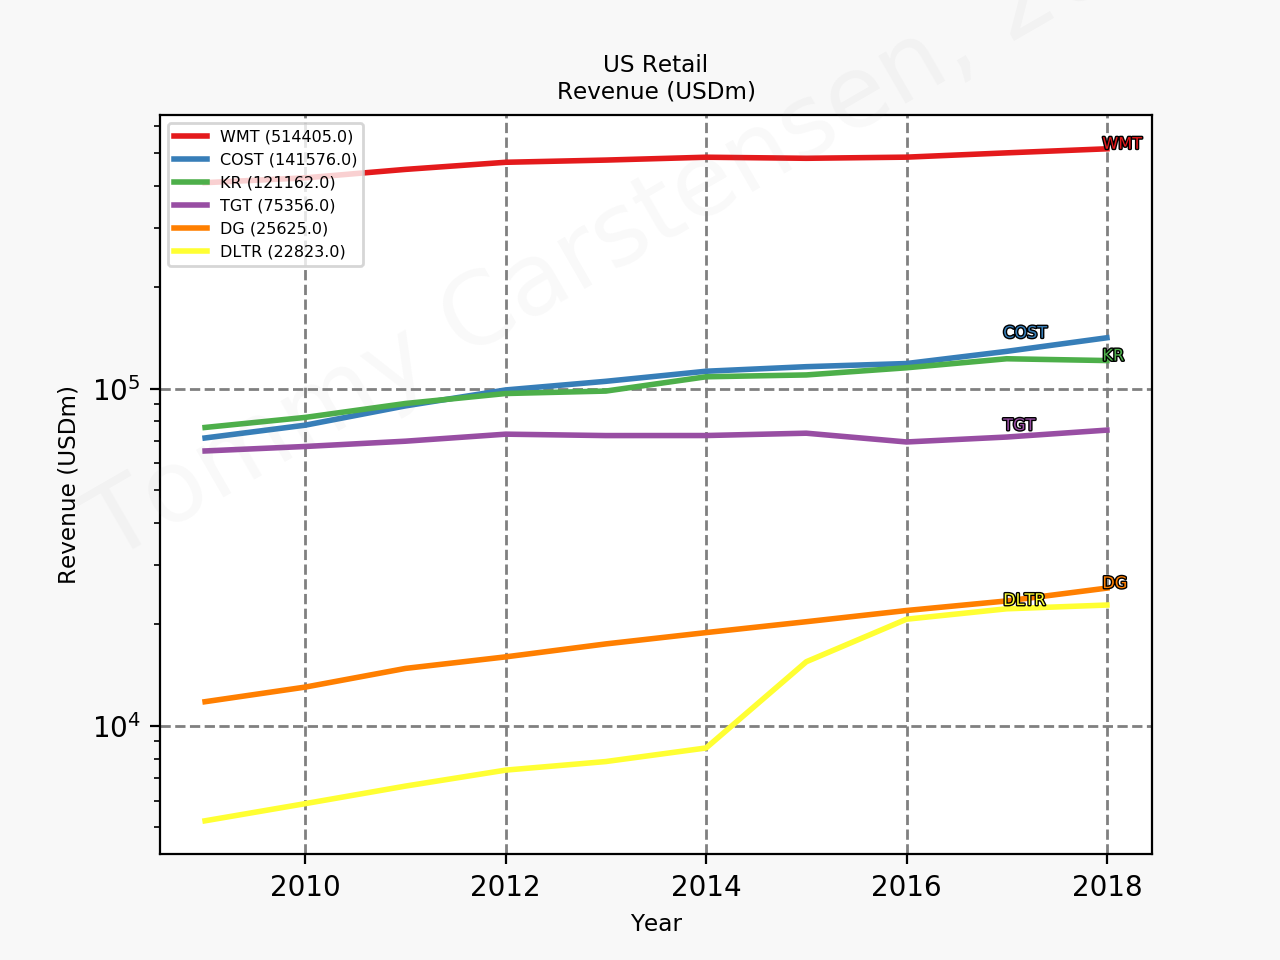
The share price of Costco has over the past 10 years gone up by more than 600% along with those of Dollar General [DG] and Dollar Tree [DLTR].

During that time all three have grown revenue by 200% or more; DLTR even more as a consequence of their acquisition of Family Dollar in 2015.

At a forward P/E of 33.8 Costco is richly valued and the quarterly earnings probably do not justify such lavish multiples. Below a plot of the enterprise value over the operating income as a time series, which shows the expansion of multiples for Costco in particular over the past 10 years. Costco is a wonderful business, but it’s probably too expensive at current levels despite their recent launch in China. If it is indeed priced to perfection, then missing on comparable store sales could have negative consequences for the stock price, when the markets open.

Media coverage

Reuters – Costco quarterly sales miss estimates amid fierce competition

Bloomberg – Costco’s Profit Falls Just Short of Investors’ High Expectations

Constellation Brands takes a hit from Canopy Growth

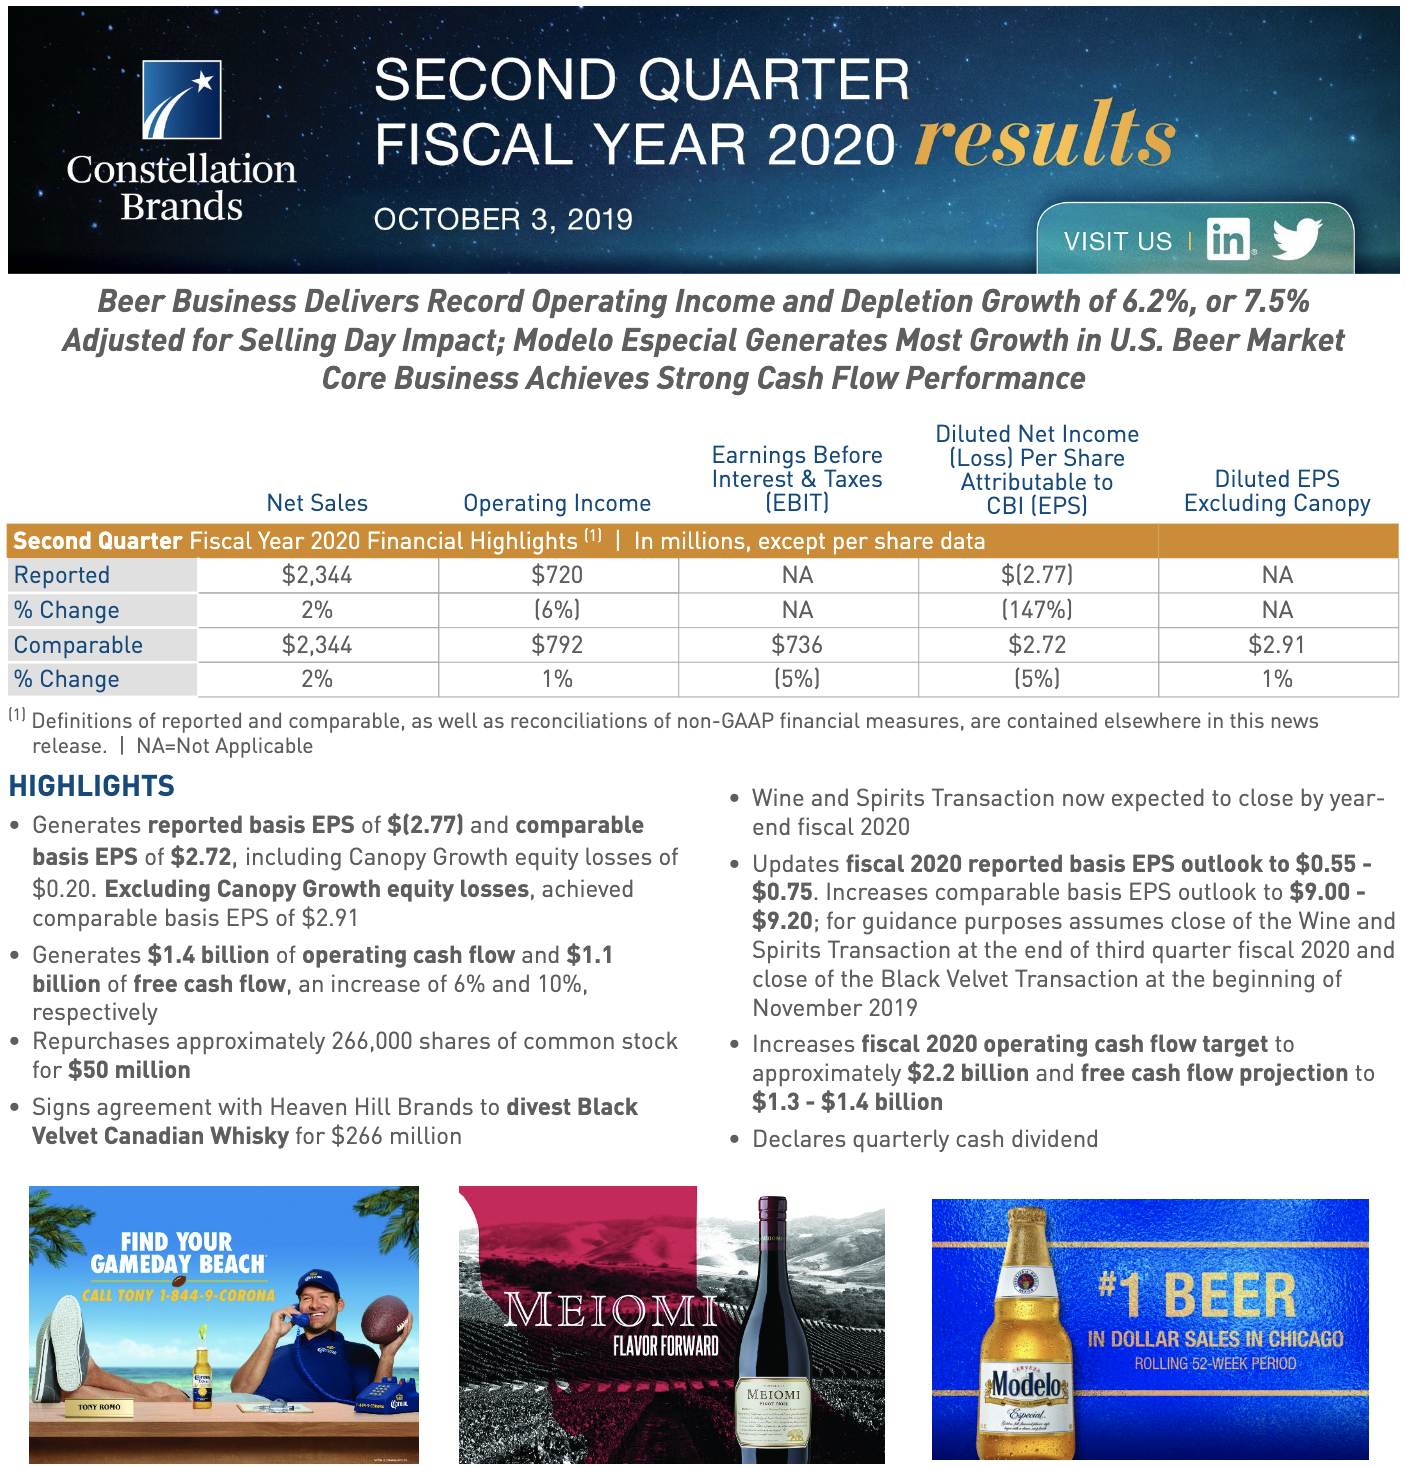
Constellations Brands issued a press release on its quarterly results before markets opened.

Canopy equity loss

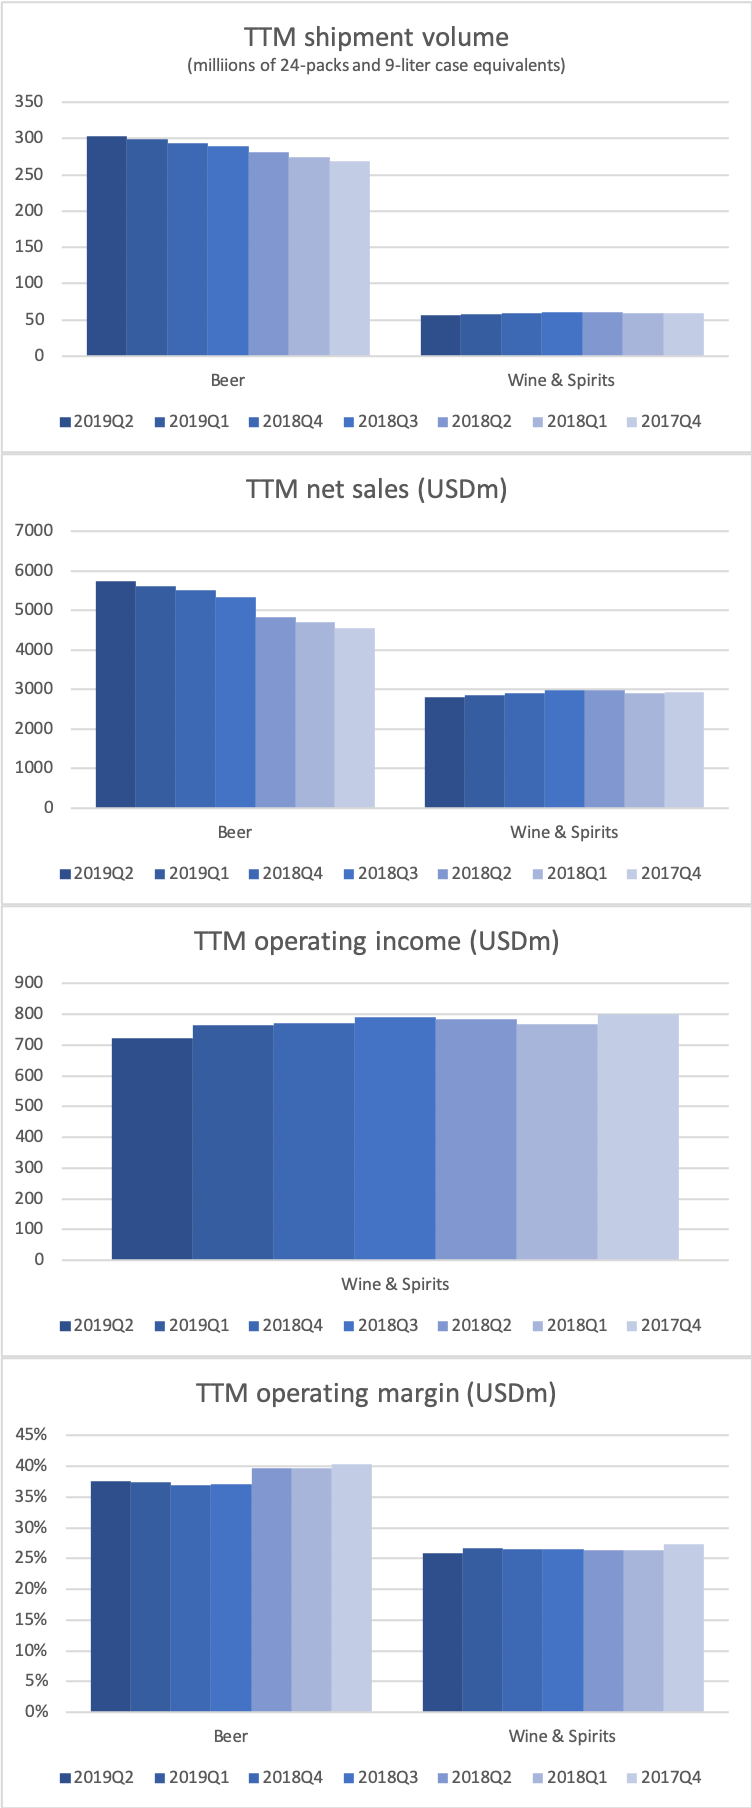
All segments performed well in terms of both shipment volume, revenue and profit.

But due to continued Canopy equity losses Constellation Brands yet again reported negative earnings for the quarter. The announcement of a positively revised outlook in terms of operating earnings was overshadowed by this.

Constellation’s share of Canopy Growth’s equity losses and related activities for second quarter fiscal 2020 totaled a loss of $484.4 million, including the impact from the June 2019 warrant modification, on a reported basis and a loss of $54.7 million on a comparable basis. Constellation has recognized a $757 million unrealized net gain in reported basis results since initial Canopy investment in November 2017; $839 million decrease in the fair value of Canopy investments was recognized for second quarter fiscal 2020.

Valuation

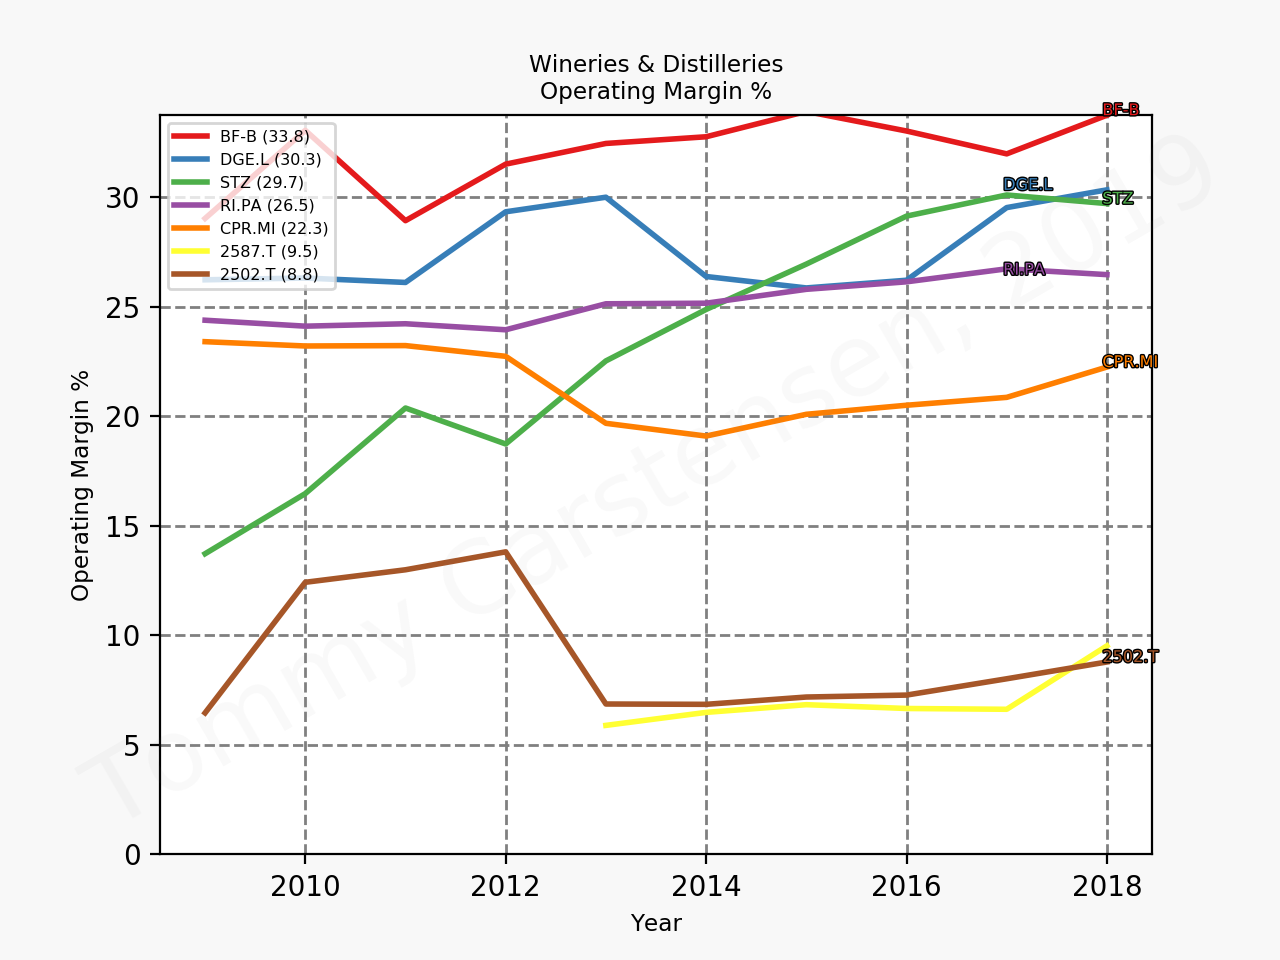
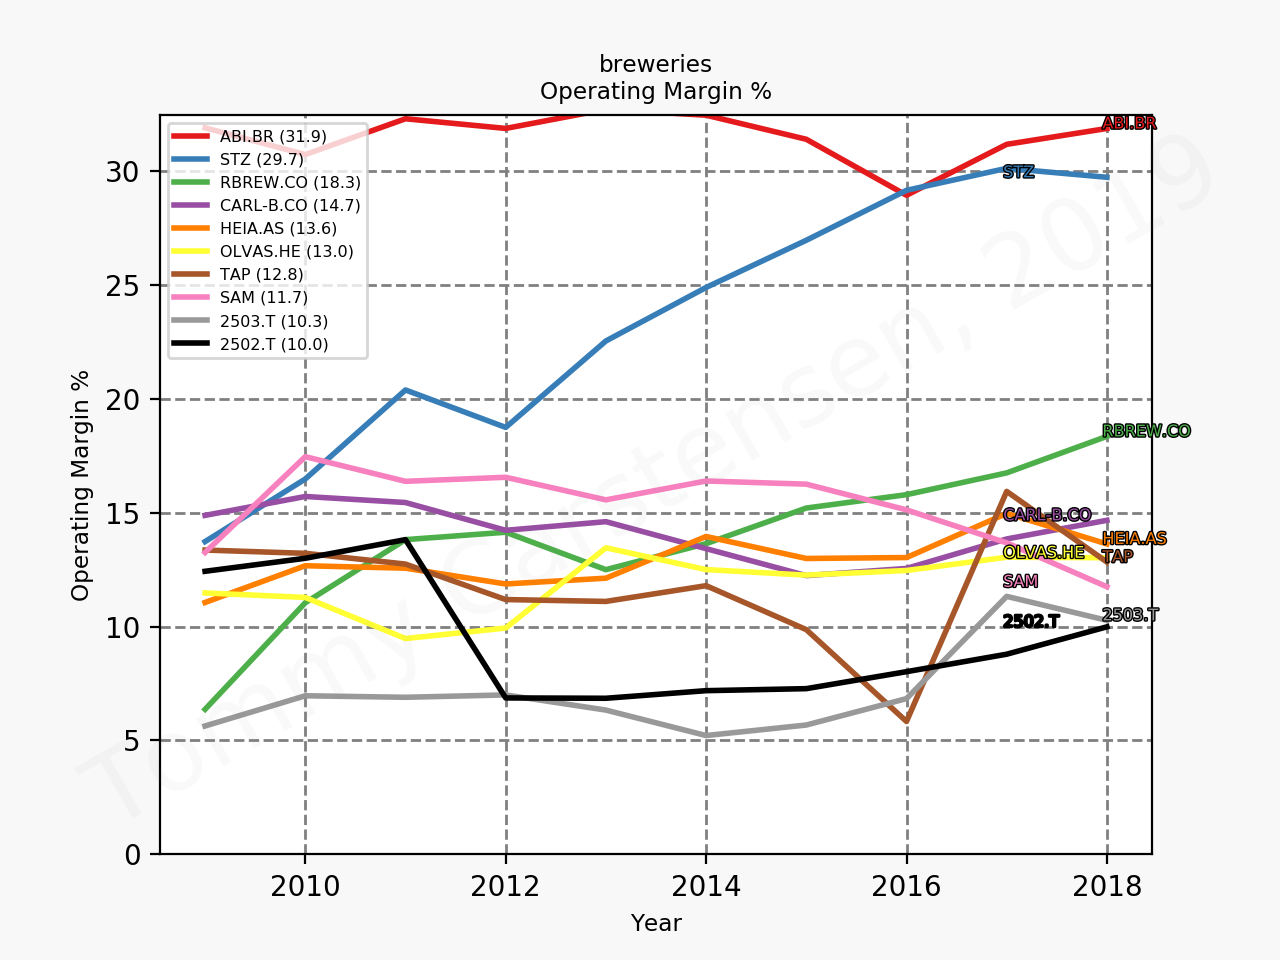
At a forward P/E just above 20 it is not particularly attractively priced. Like distillers Brown Forman [BF-B] and Diageo [DEO] it is somewhat overpriced. An alternative investment could be AB InBev [BUD], which is somewhat more attractively valued compared to smaller brewery rivals Heineken [HEAIS.AS], Carlsberg [CARL-B.CO], Molson Coors [TAP], The Boston Beer Company [SAM] and Constellation Brands. AB InBev just like Constellation Brands have better operating margins than most competitors.

Wineries & Distilleries
Breweries
Wineries & Distilleries
Breweries

References

Nightly Business Report – October 3, 2019

Reuters – Corona maker Constellation hit by pot investment loss; shares drop

PepsiCo will meet or exceed its full-year organic revenue growth target of four percent

PepsiCo issued a press release regarding its quarterly results before the market opened.

CEO comments

The financial results were accompanied by the following comments by CEO Ramon Laguarta.

“We are pleased with our results for the third quarter. While adverse foreign exchange translation negatively impacted reported net revenue performance, organic revenue growth was 4.3% in the quarter. We are making good progress against our strategic priorities and our businesses are performing well as we continue to make the necessary investments in our capabilities, brands, manufacturing and go-to-market capacity to propel our future growth. Given our performance year-to-date, we now expect to meet or exceed our full-year organic revenue growth target of 4%.”

Diving into the financial results

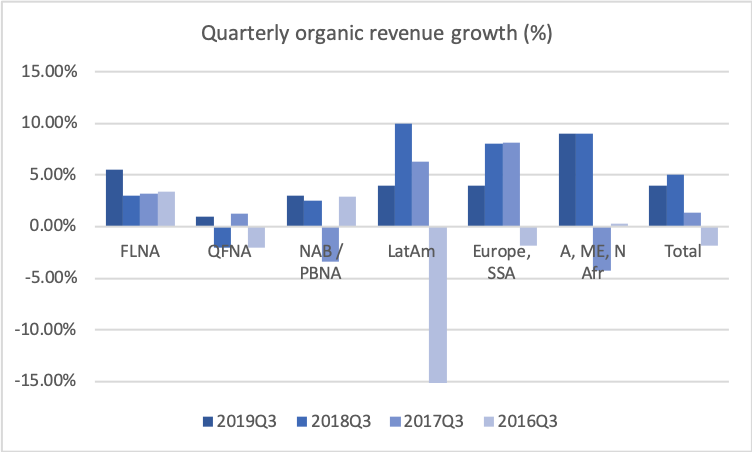
All segments except for Frito Lay North America (FLNA) and Asia/Middle East/North Africa suffered from decreasing volume, but this was offset by an increase in price and all segments experienced organic revenue growth.

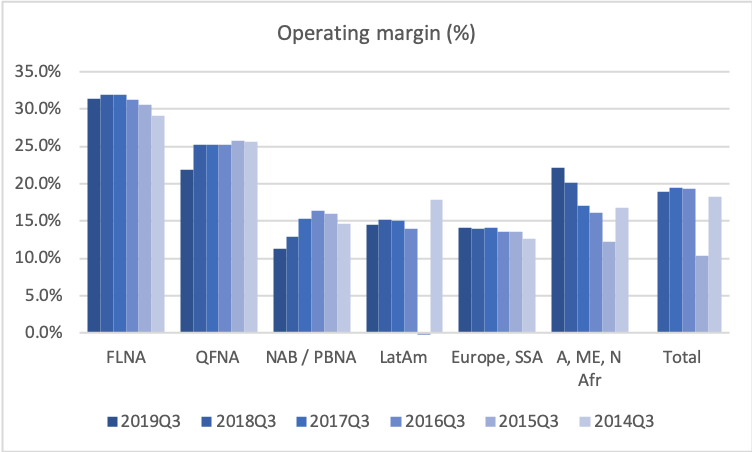
The operating margin margin for Quaker Foods North America contracted from 25.2% to 21.9%.

[expand title=”A question regarding the permanency of the contraction of the margins of the Quaker Foods North America segment was asked, and the decreasing margins were explained as being due to increased COGS as a consequence of an improved formulation that eliminates artificials.”]

A question on Quaker. Quaker’s trend seems to be getting better, second quarter in a row that — of organic growth at Quaker, something not seen since 2015, if I’m correct. So could you please give us more granularity in those results, especially, and it’s not necessarily what we are seeing in
Nielsen data? And how sustainable this trend is in your view? And also, I mean, this growth seems to be coming at the expense of operating income, which seems to be a change of strategy this year versus the last few years. Should we think about operating margins to continue to compress to sustain the growth here?

Good question, Laurent. Of course, we want each one of our businesses to be a positive growth business, so Quaker, no different. We will continue to invest to make sure that business continues to grow, maybe not at the levels that we have Frito-Lay, but just good levels.

We’ve done several things with that business. One is we invested a bit more, both in CapEx and on cost of goods. Cost of goods, specifically in the area of improving the formulation of our Quaker products. So we’ve eliminated all the artificials, now it’s only natural and I think that will do well for the brand going forward. Although it’s quite an important investment in terms of cost of goods. So that’s why you’re seeing the operating —
the gross margin reducing a little bit in Quaker.

[/expand]

2019 Expectations

PepsiCo maintains its expectations in terms of operating cash flow $9B and cash returns to shareholders of approximately $8B.

  • Approximately $9 billion in cash from operating activities and free cash flow of approximately $5 billion, which assumes net capital spending of approximately $4.5 billion.
  • Total cash returns to shareholders of approximately $8 billion, comprised of dividends of approximately $5 billion and share repurchases of approximately $3 billion.

This expectation is in line with previous years. The free cash flow in recent years have suffered a bit from increased net capital spending and in particular from a reduced operating cash flow. Given the increased share price and the reduced free cash flow it makes that share repurchases have been decreasing since 2015. As a consequence of the reduced buybacks and the increasing share price PepsiCo currently has one of the lower buyback ratios compared to other US consumer staples.

Annual time series of operating cash flow, free cash flow, capital expenditures, dividends and share repurchases.
Time series of buyback ratio in 2019.
Time series of dividend yield in 2019.

Valuation

PepsiCo is not cheap in absolute terms and neither relative to its peers nor its past. It’s probably not a time to buy, but given organic growth of four percent it’s probably not the time to sell either. Better consumer staples alternatives to buy might be Kraft Heinz [KHC], Unilever [UN, UNA.AS] or AB InBev [BUD, ABI.BR].

References

PepsiCo Q3 2019 Earnings

Reuters – Advertising blitz, sugar-free Gatorade drive PepsiCo profit beat

Bloomberg – Pepsi Says Consumer Chugging Along Even With Higher Prices

CNBC – Pepsi’s stock jumps as higher advertising spending fuels sales growth and earnings beat

CNBC Earnings Alert – PepsiCo beats on revenue, EPS in Q3
Nightly Business Report – October 3, 2019
PepsiCo CFO Hugh Johnston on Q3 results

HP to lay off 7000-9000 of its 55,000 employees

HP Inc. [HPQ] has announced its 2020 outlook and restructuring plan in a press release with the following headlines.

  • Estimates GAAP diluted net earnings per share (“EPS”) for fiscal 2020 of $1.98 to $2.10
  • Estimates non-GAAP diluted net EPS for fiscal 2020 of $2.22 to $2.32
  • Estimates fiscal 2020 free cash flow of at least $3.0 billion
  • Estimates total costs in connection with the restructuring plan of $1.0 billion and estimated annualized gross run rate savings of about $1.0 billion by the end of fiscal 2022
  • HP Inc. (“HP”) announces dividend increase of 10%

[expand title=”The incoming CEO Enrique Lores commented on the restructuring plan.”]

“We are taking bold and decisive actions as we embark on our next chapter.

We see significant opportunities to create shareholder value and we will accomplish this by advancing our leadership, disrupting industries and aggressively transforming the way we work.

We will become an even more customer-focused and digitally enabled company, that will lead with innovation and execute with purpose.”

[/expand]

The restructuring plan comes on the back of revenue dropping and being flat in multiple segments.

If free cash flow is indeed reduced to $3B, then free cash flow multiples in the absence of share price drops will expand by approximately 30%. One can probably expect a rocky ride until at least the Q3 earnings in November.

Time series of share price (blue), operating income (green) and enterprise value over operating income (red).
Time series of share price (blue), free cash flow (green) and enterprise value over free cash flow (red).

Reuters – PC maker HP to cut up to 9,000 jobs in restructuring push

Bloomberg – HP Tumbles as Analysts See ‘Turbulence Ahead’ With Restructuring

Bloomberg – HP to Cut as Much as 16% of Workforce Amid Print Unit Woes

Profit margins stabilising at H&M

H&M released their nine month report prior to the market opening on October 3rd. Some of the headlines from that report are:

  • With well-received summer collections, the H&M group’s net sales increased by 12 percent to SEK 62,572 m (55,821) in the third quarter. In local currencies, net sales increased by 8 percent compared with the corresponding quarter the previous year.
  • Online sales in the third quarter increased by 30 percent in SEK and by 25 percent in local currencies.
  • Gross profit increased by 13 percent to SEK 31,815 m (28,091). This corresponds to a gross margin of 50.8 percent (50.3).
  • Profit after financial items increased by 25 percent to SEK 5,011 m (4,012). The group’s profit after tax increased to SEK 3,859 m (3,099), corresponding to SEK 2.33 (1.87) per share.

Revenue, profits and margins

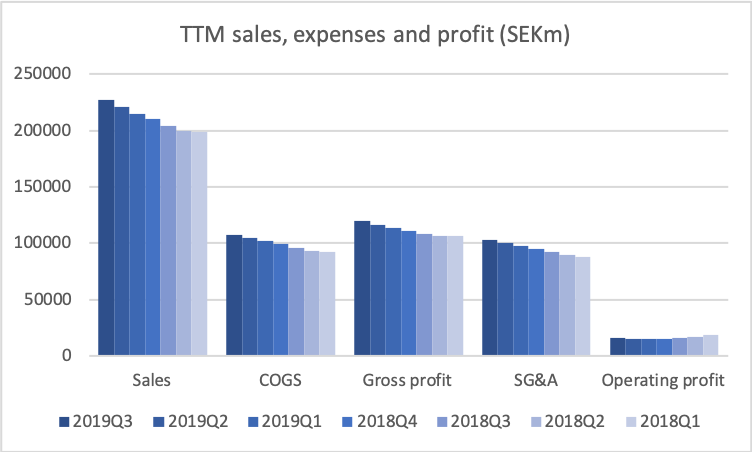
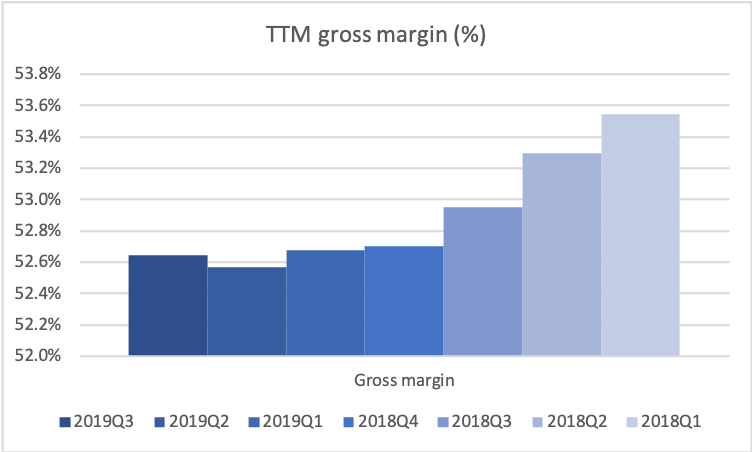
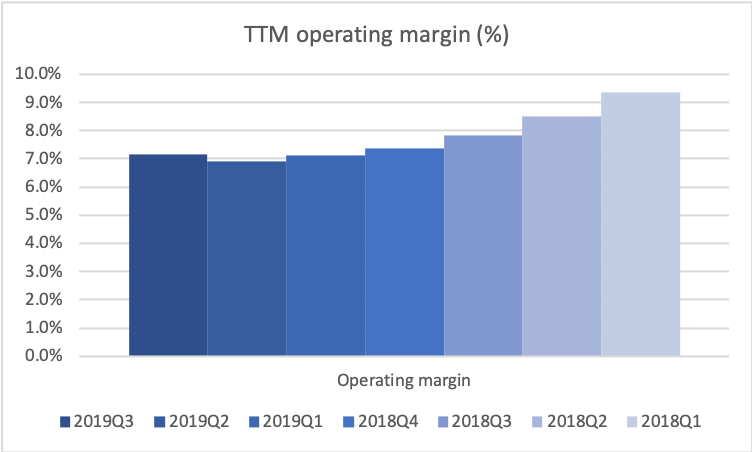
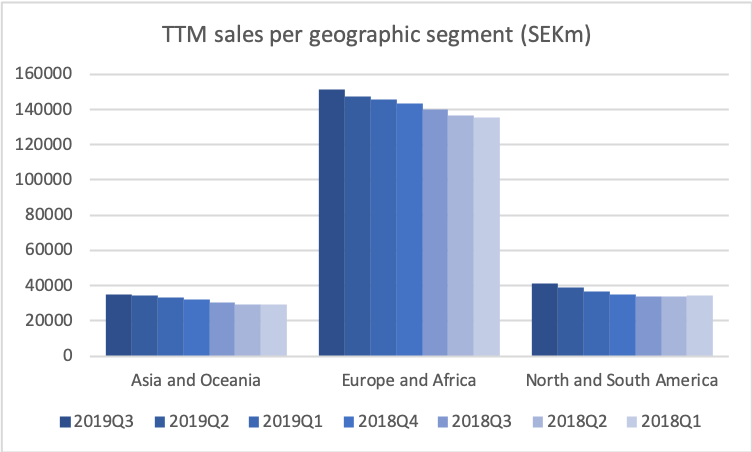
The figures below summarise the data for the trailing twelve months (TTM). Revenue continues to go up primarily as a consequence of improved sales in each store rather than new store openings.

TTM revenue, expenses and profit
TTM gross margin
TTM operating margin
TTM sales by geographic segment

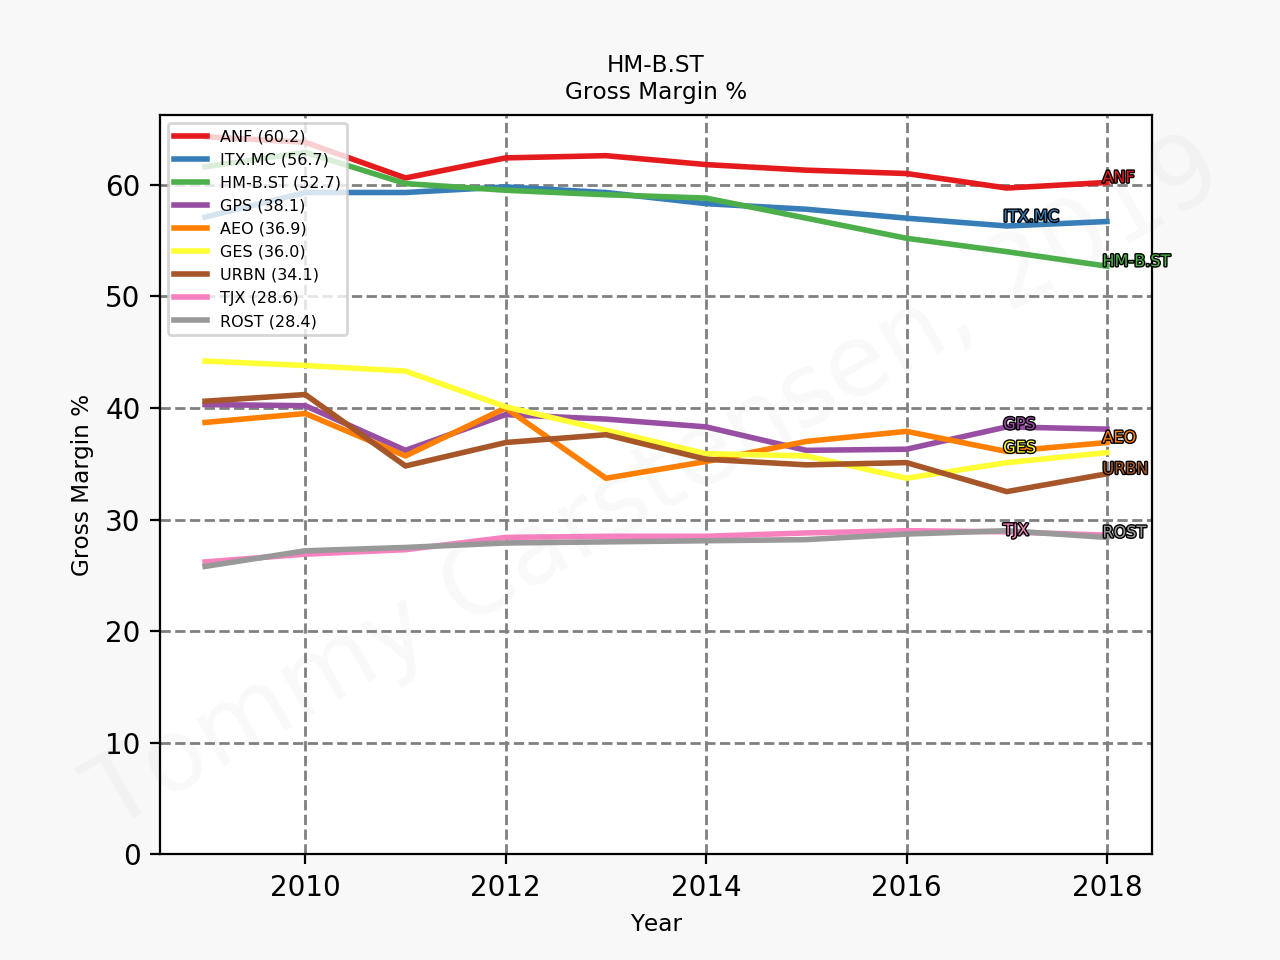
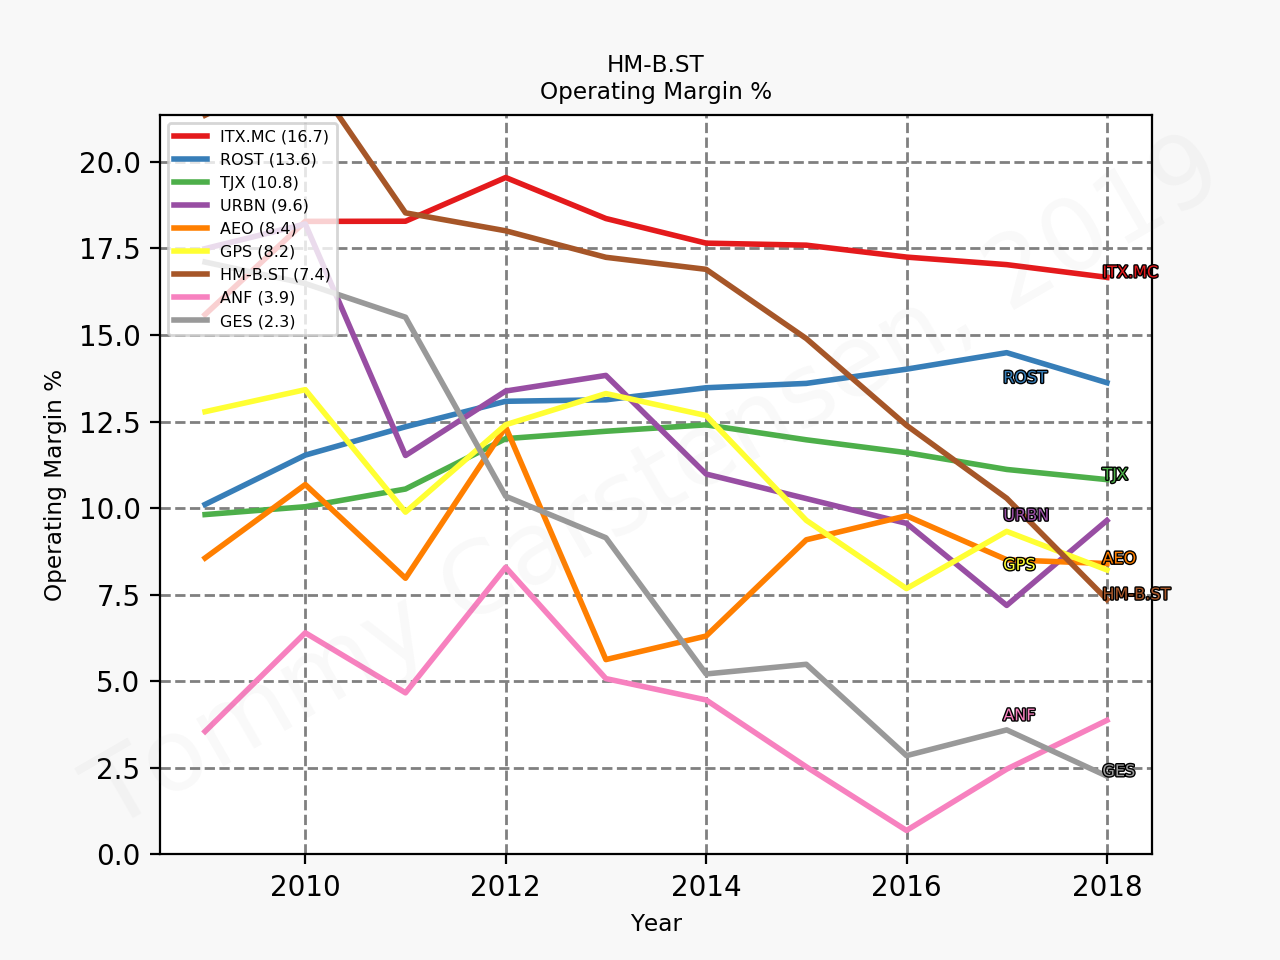
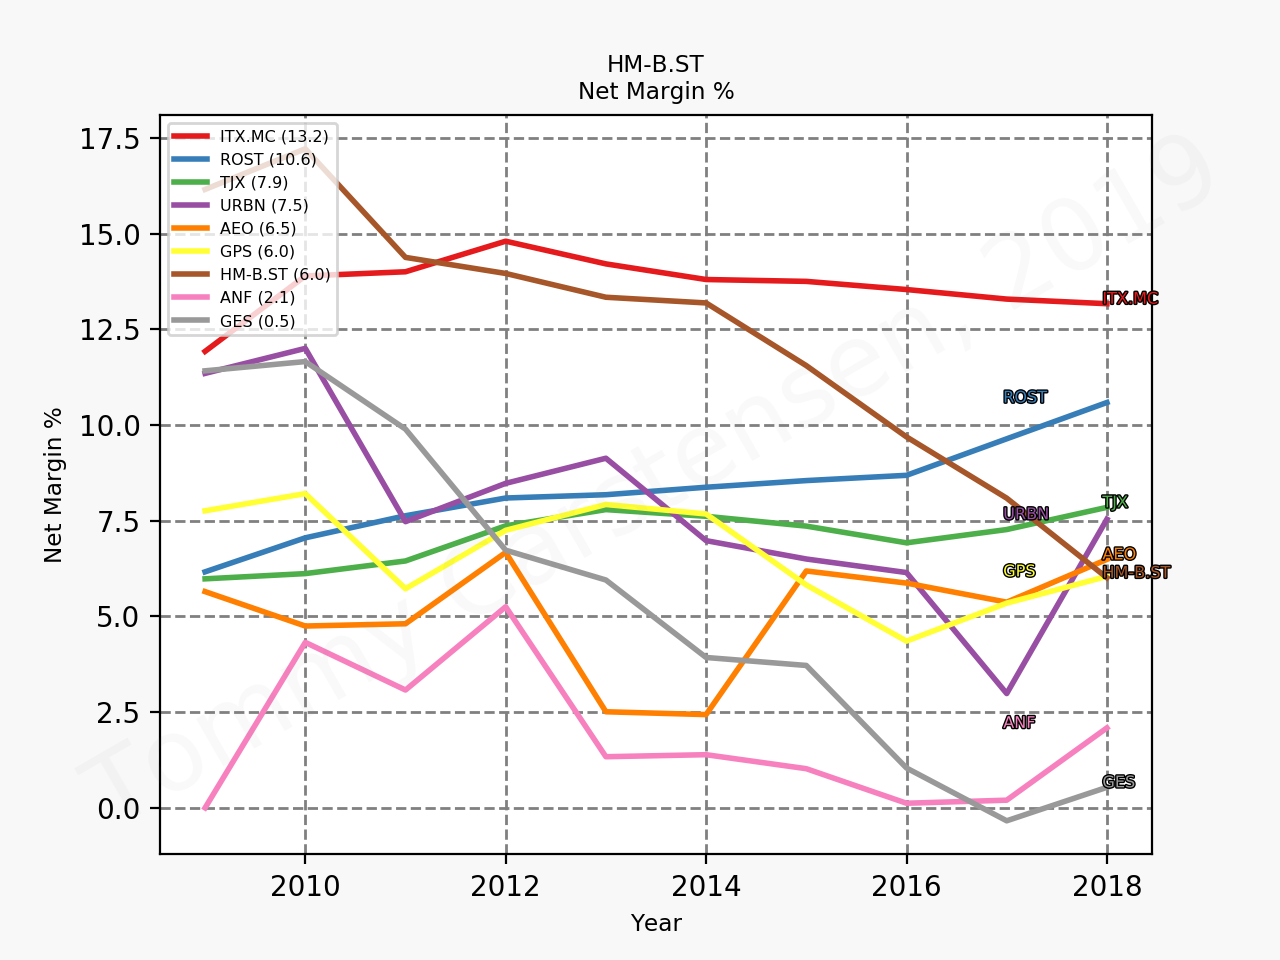
The stabilised margins follow years of declining margins.

Time series of gross margins
Time series of operating margins
Time series of net margins

Price movement and multiples

H&M has unlike its Spanish competitor Inditex [$ITX.MC] seen its market capitalisation cut in more than half, which coincided with the deterioration of margins. The share price has gone up by approximately 54% from a 52 week low at the end of December 2018 of SEK125 to SEK192.

For a brief period of time in the winter of 2018 H&M sported a dividend yield above 7%.

Time series of trailing annual dividend yield of H&M and its peers

The time to buy H&M was probably in 2018 or after the Q4 earnings on December 17th. But at that time there were doubts about the turnaround. However the share price started going up, when the chairman Stefan Persson bought more than 1% of the outstanding shares on February 5th and 12th. The H&M share price experienced a triple bottom at the end of 2018 (SEK125.18 on 26Mar2018, SEK121.28 on 03Sep2018, SEK126.02 on 24Dec2018) and the multiples were lower in 2018 and the beginning of 2019 than they are now. Below various multiples are summarised as time series and compared to those of competitors.

Time series of enterprise value over revenue
Time series of enterprise value over operating income
Time series of enterprise value over net income
Time series of enterprise value over cash flow

Time to buy?

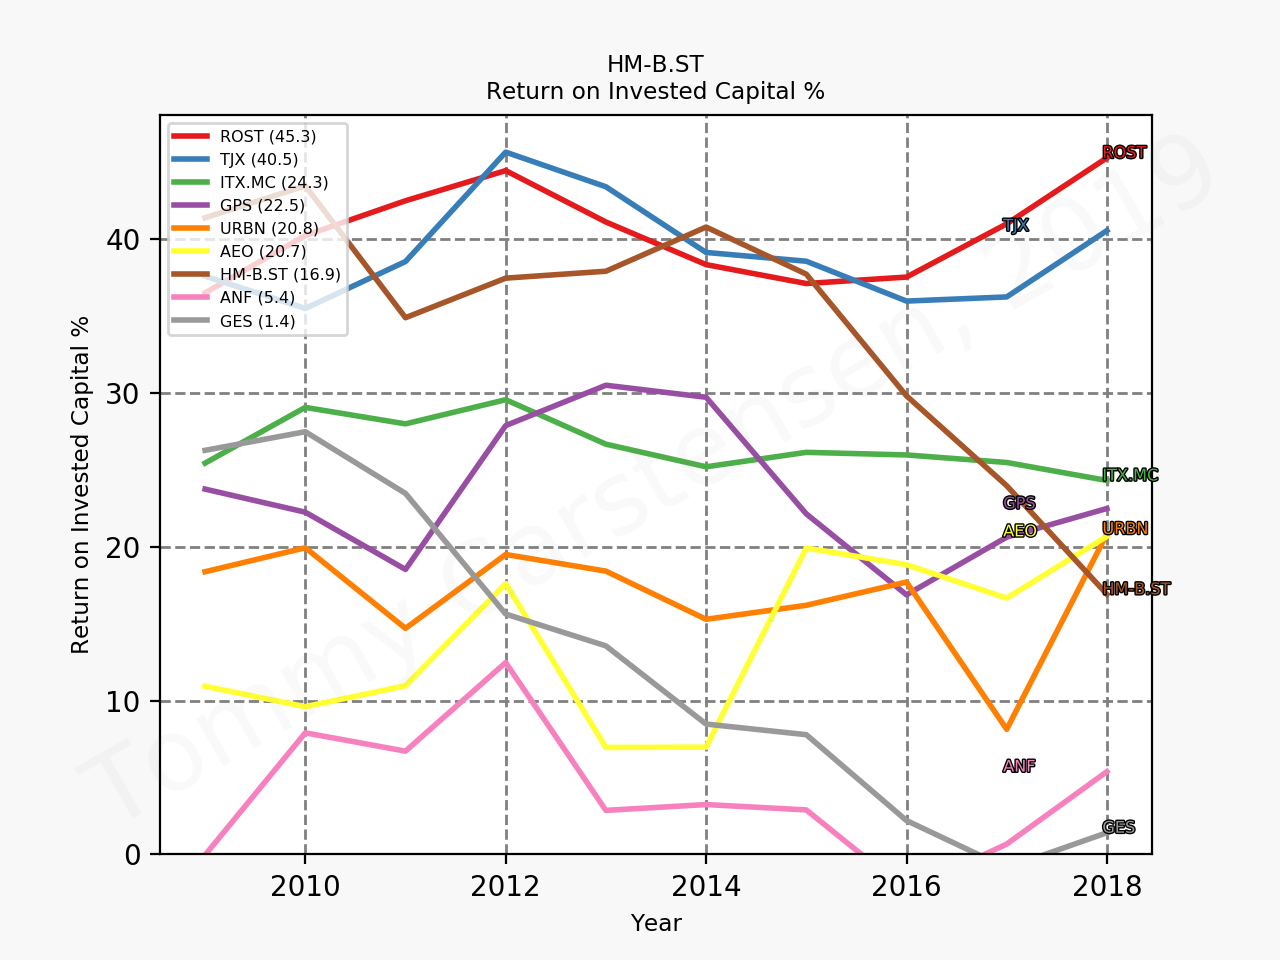
Although H&M is still attractively valued, Gap Inc. [$GPS], which is trading a multi year lows, might prove to be the better investment from a value perspective at current prices, despite the inferior profit margins and the historically inferior return on invested capital (ROIC).

ROIC

Media coverage

Reuters – H&M shares surge after first quarterly profit rise in two years

Bloomberg – H&M Earnings Return to Growth After Two-Year Slump

03Oct Dagens Industri – H&M fortsätter att bromsa butiksöppningarna

03Oct Dagens Industri – Stark rapport från H&M

04Oct Dagens Industri – Trippelhöjning för H&M – här är dagens rekar

McCormick shows strong growth in the third quarter

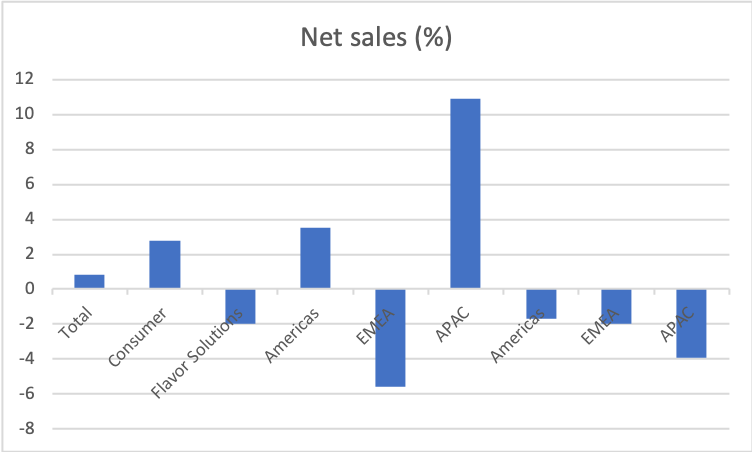
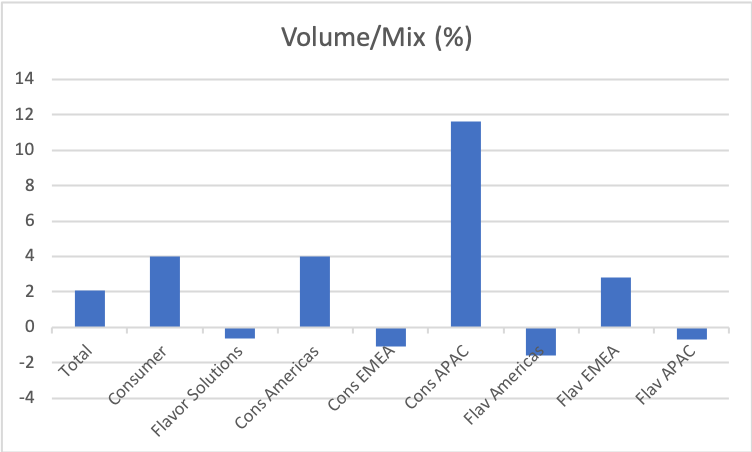
McCormick [MKC] has issued a press release on its third quarter earnings. The company increased its full year earnings per share outlook. Strong growth was shown in volume/mix and net sales despite currency headwinds and weaknesses in the flavor solutions segment and the EMEA consumer segments. The headlines of the quarter were as follows.

  • McCormick Reports Strong Third Quarter Performance And Increases Full Year Earnings Per Share Outlook
  • Earnings per share was $1.43 in the third quarter as compared to $1.30 in the year-ago period. Adjusted earnings per share rose 14% to $1.46 from $1.28 in the year-ago period.
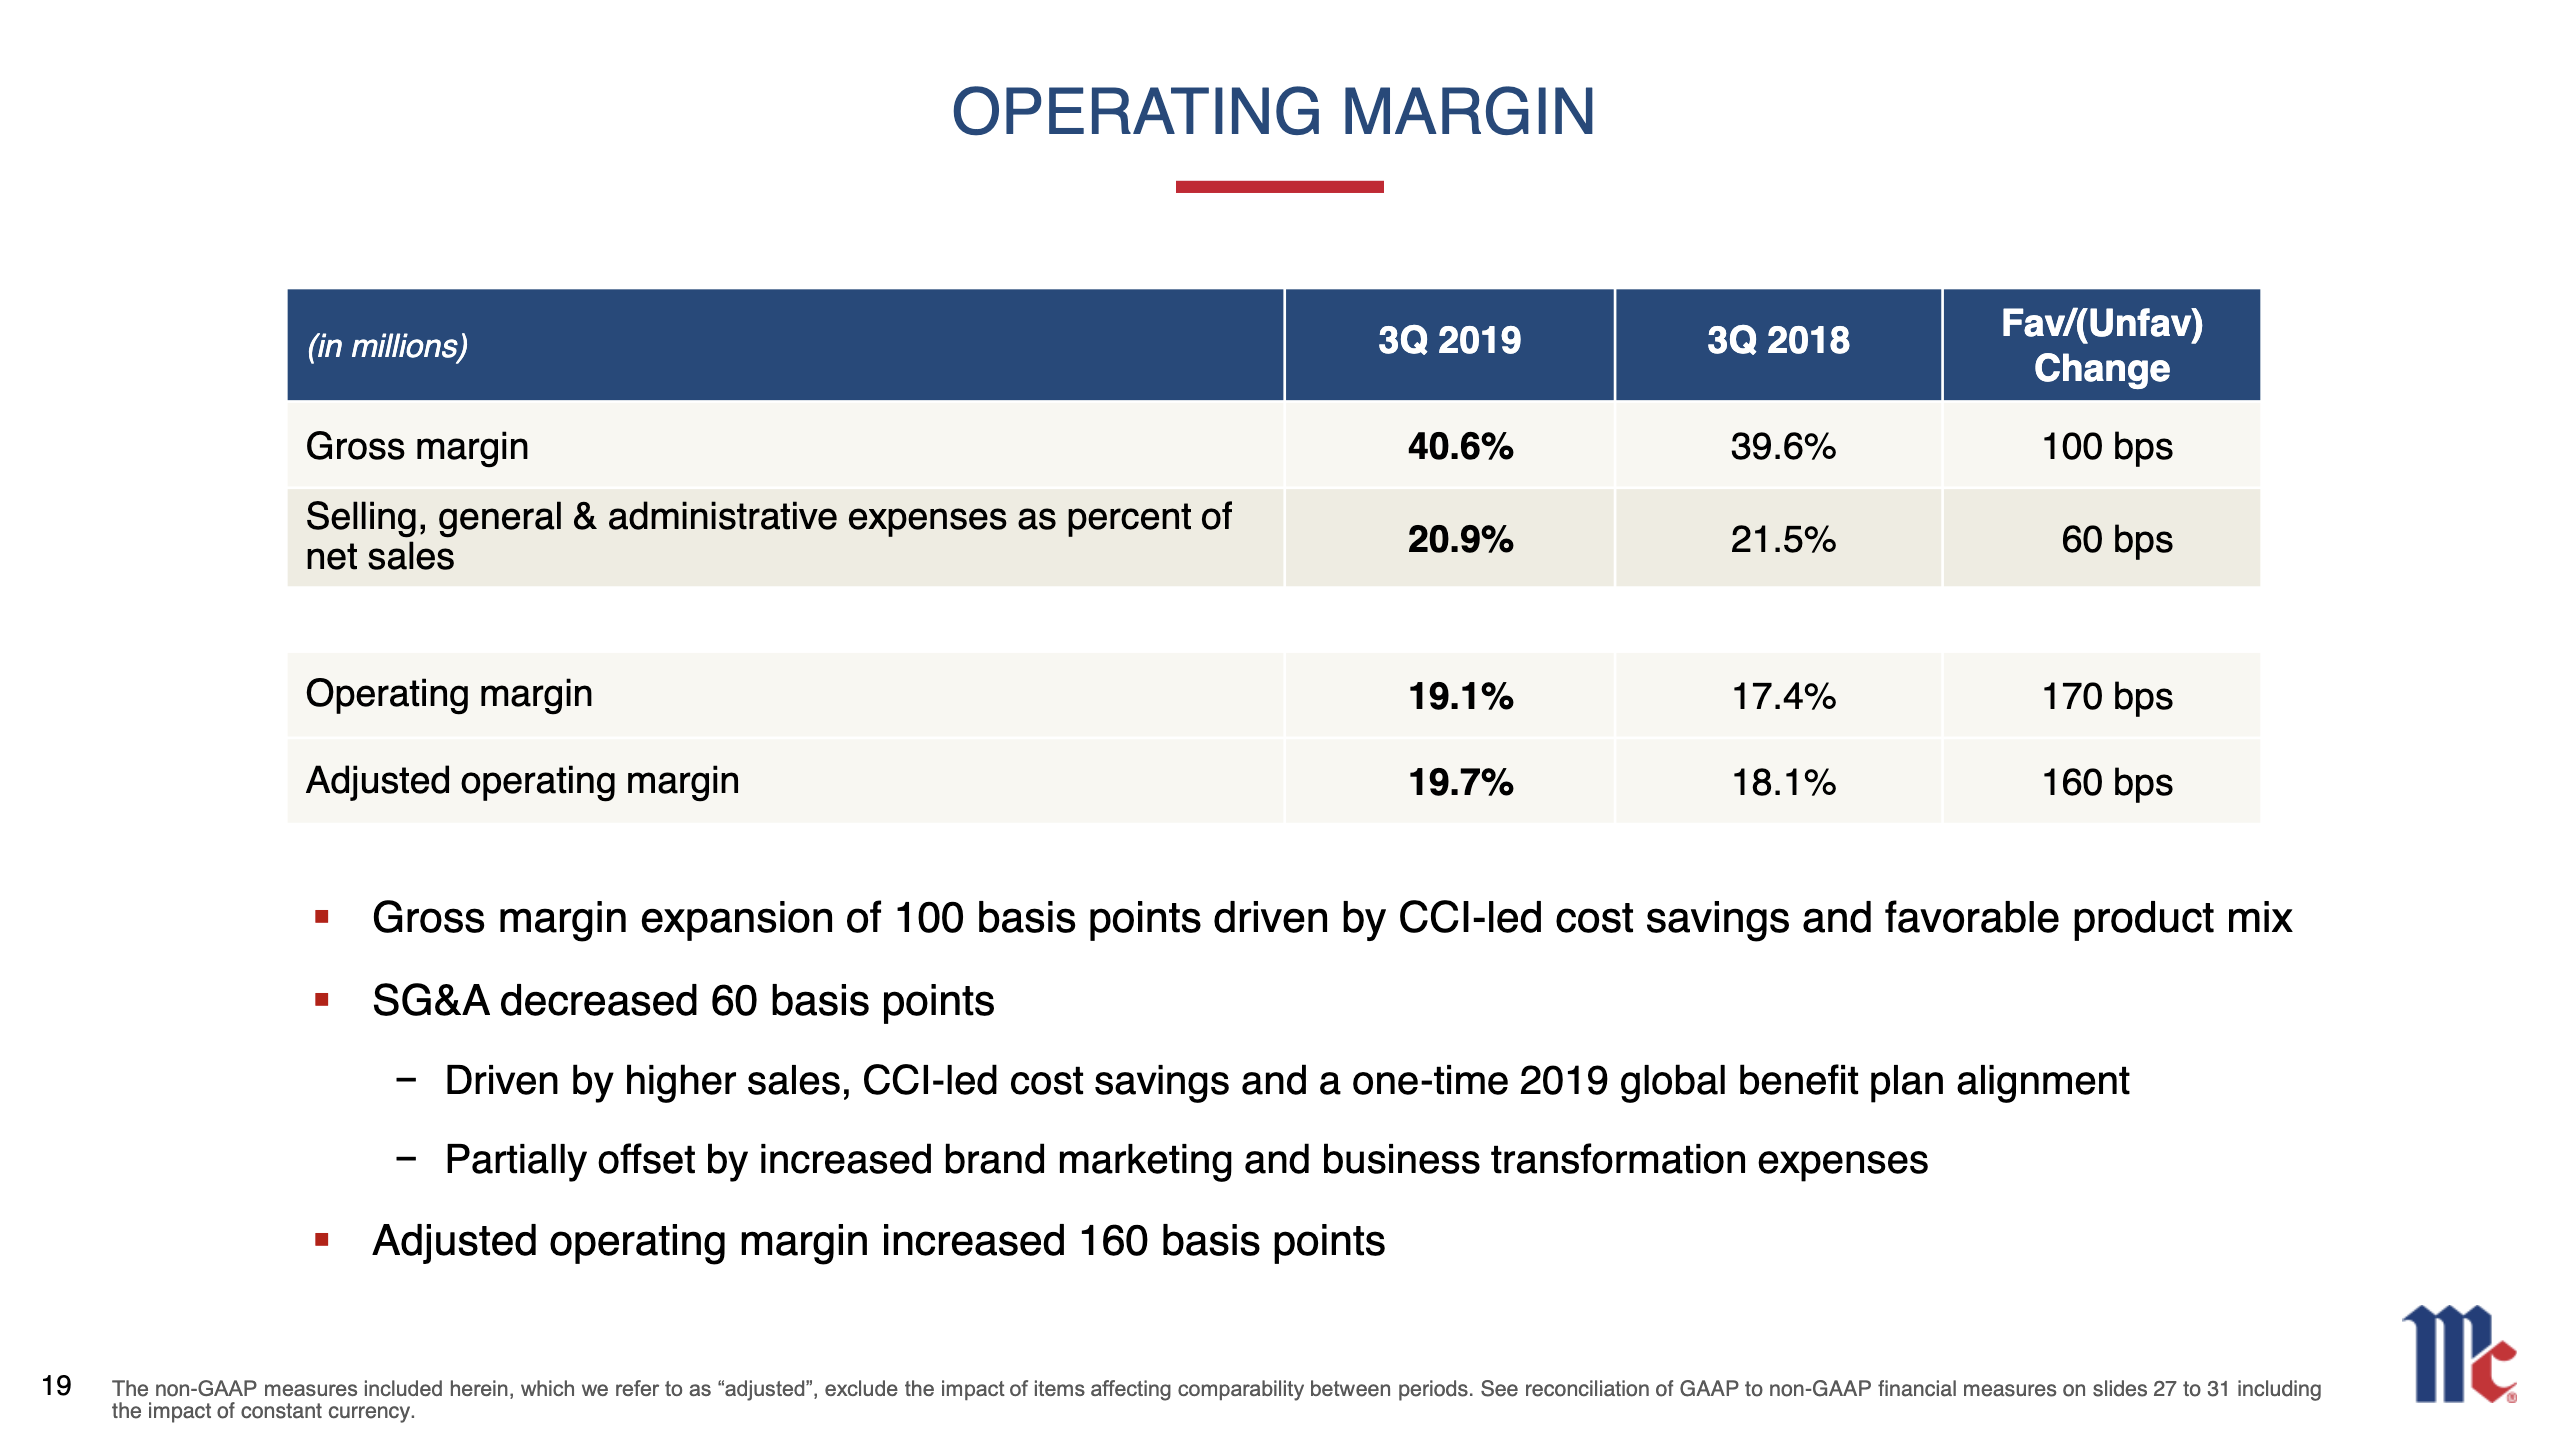
  • Operating income was $254 million in the third quarter compared to $230 million in the year-ago period. Adjusted operating income was $261 million, a 9% increase from $239 million in the third quarter of 2018, and a 10% increase in constant currency.
  • Sales rose 1% in the third quarter from the year-ago period with gross margin expansion of 100 basis points. In constant currency, the company grew sales 2%.
  • For fiscal year 2019, McCormick continues to expect strong growth and based on its year-to-date performance raised its earnings per share outlook.

Growth

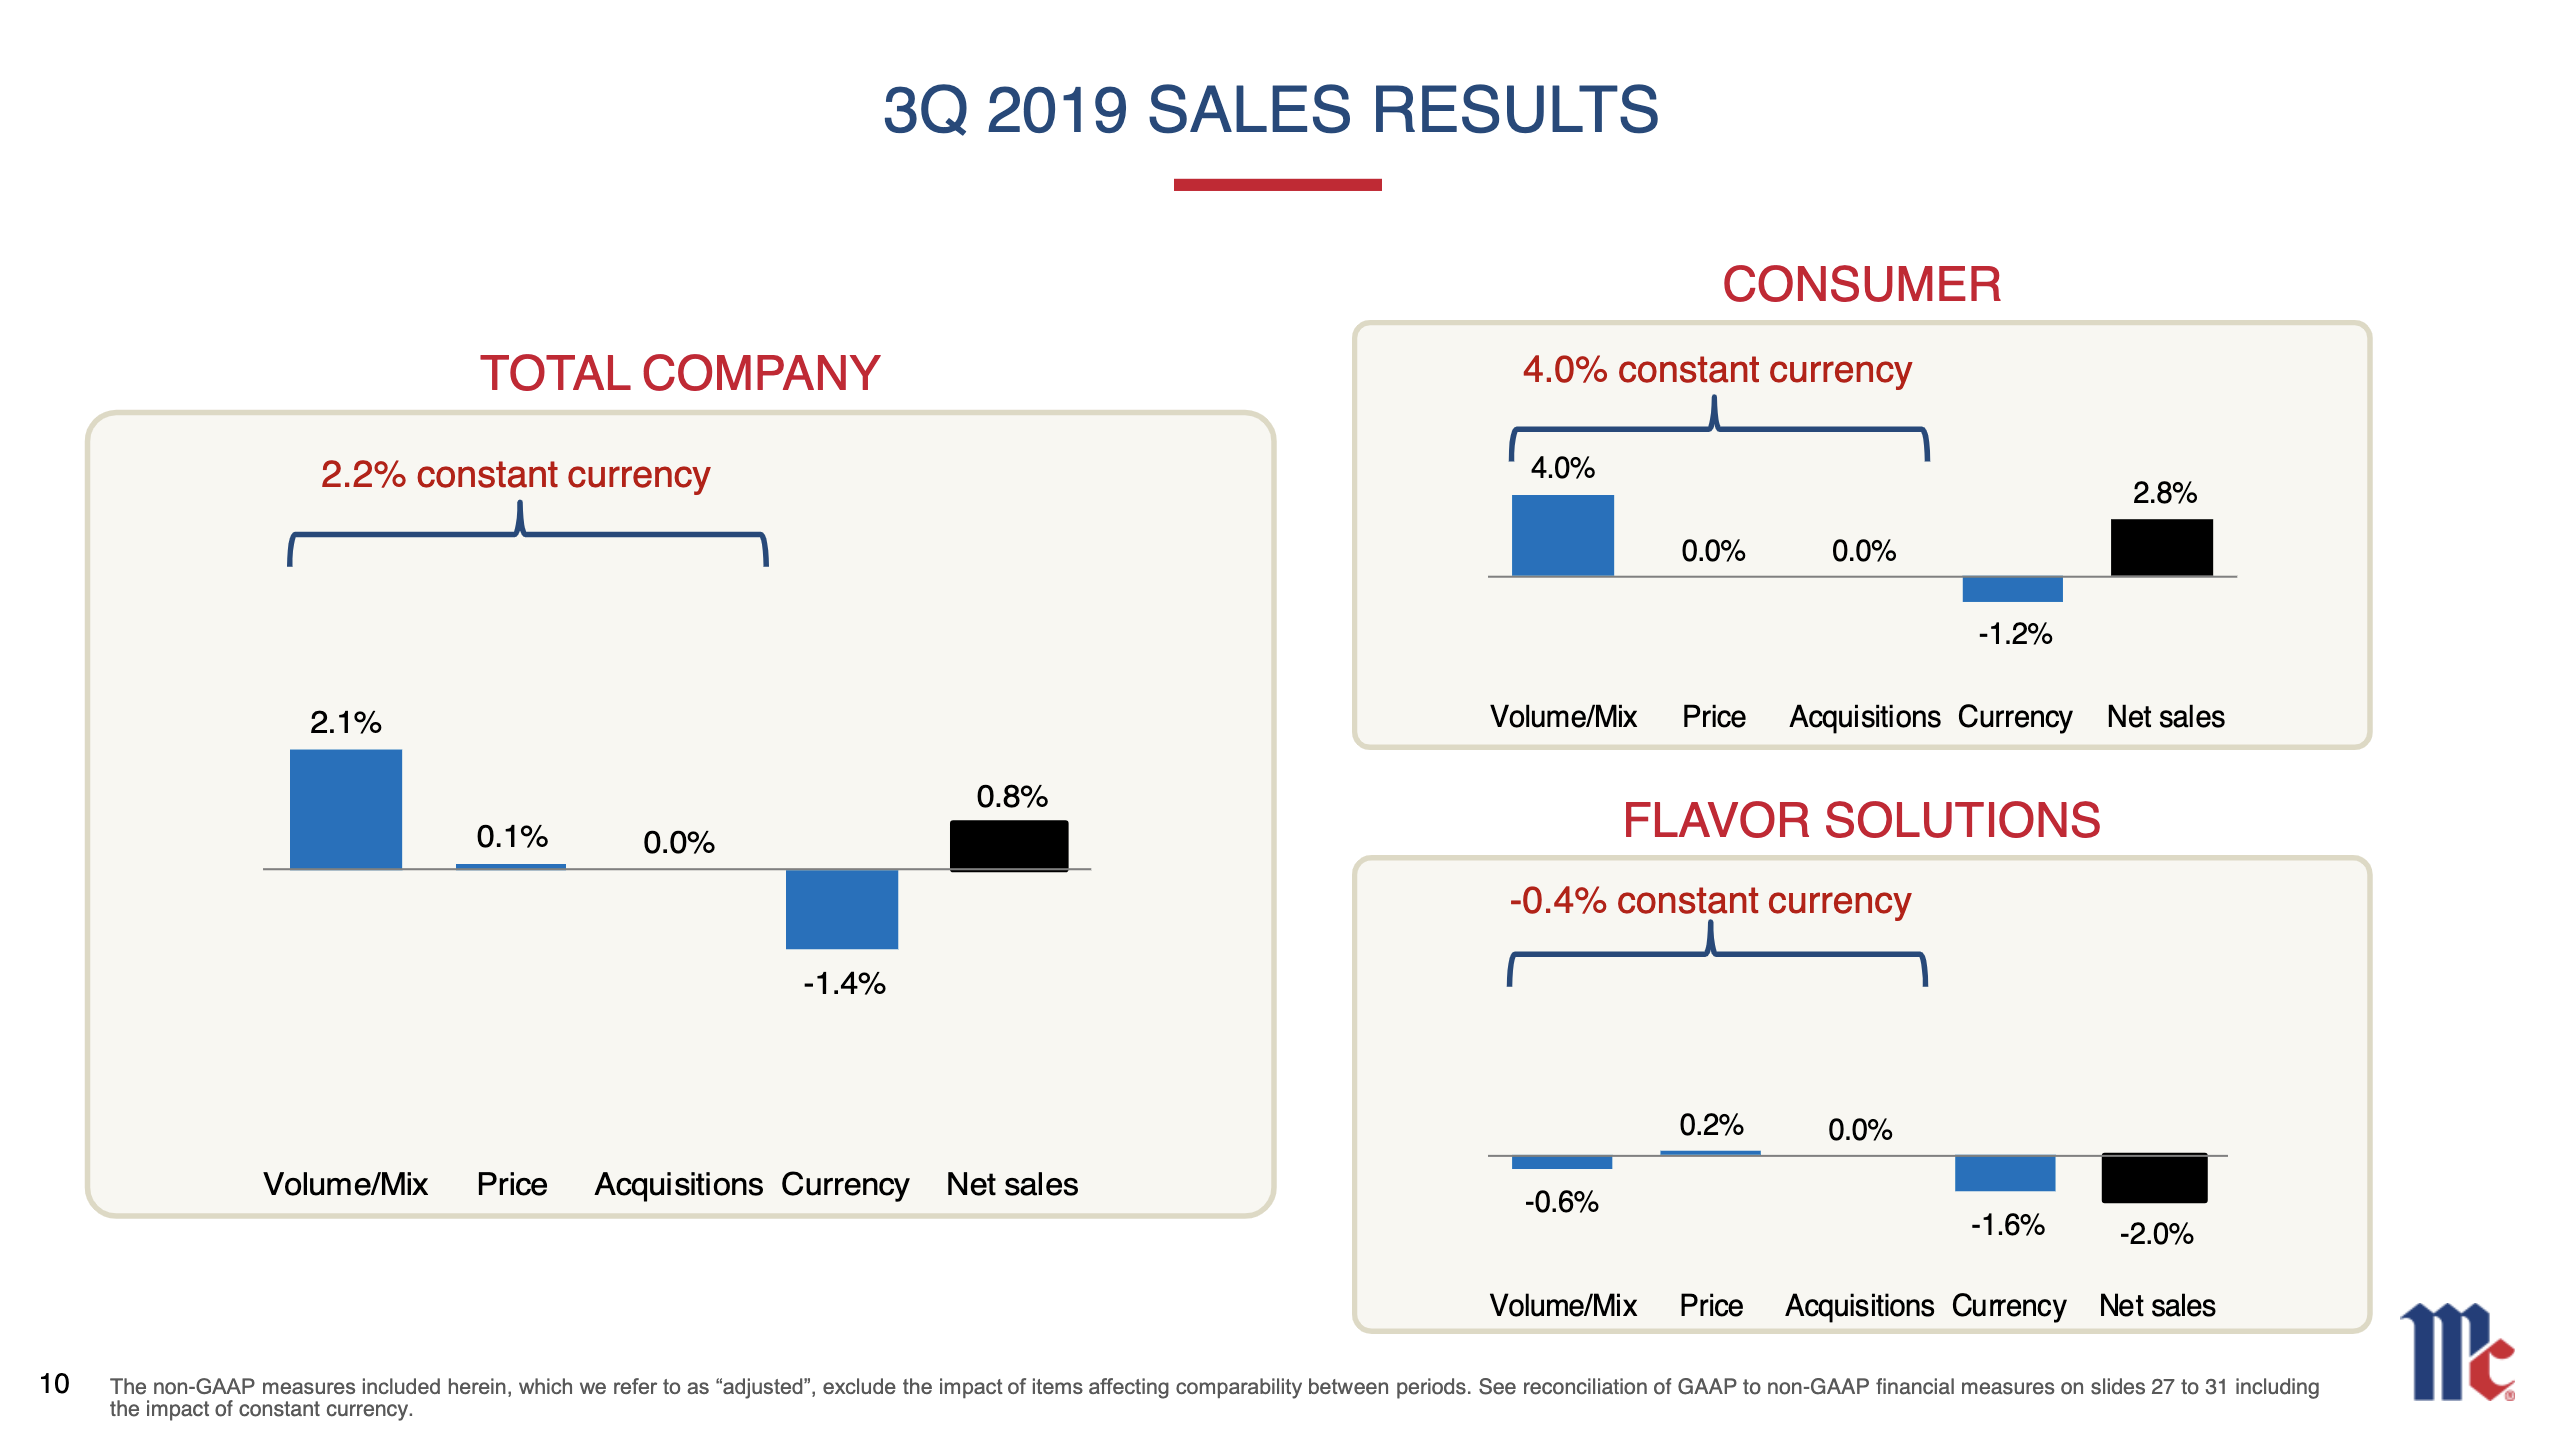
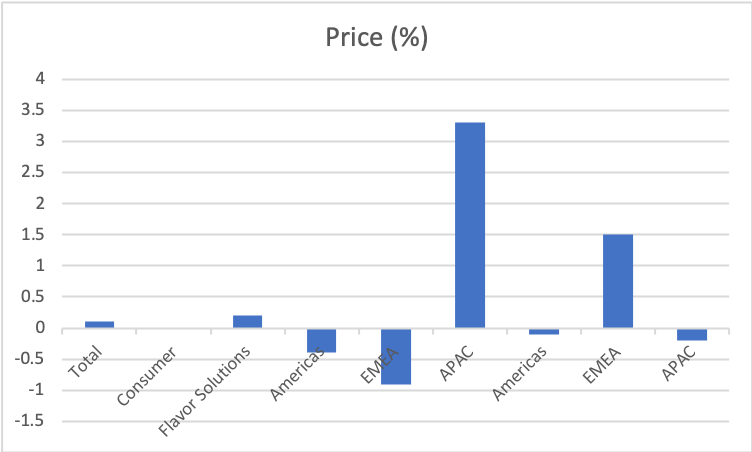
The consumer segment fueled growth, whereas the flavor solutions segments was a small drag on growth.

Growth in the EMEA segment was tempered by extreme high temperatures in Europe.

Growth in net sales including constant currency effects
Growth in volume/mix
Growth in price

Operating margin

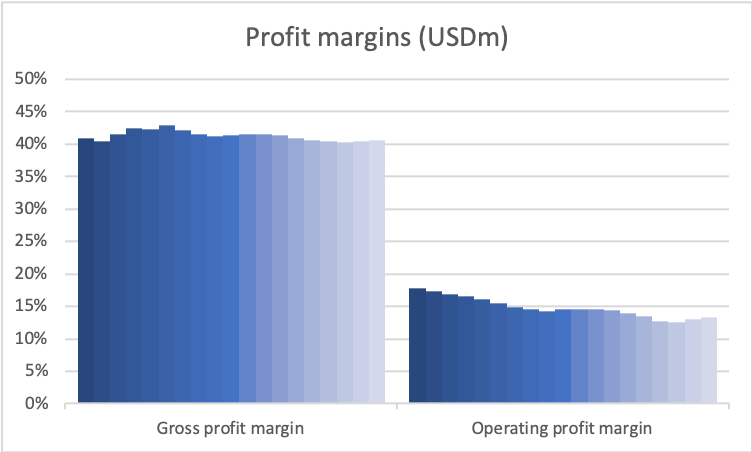
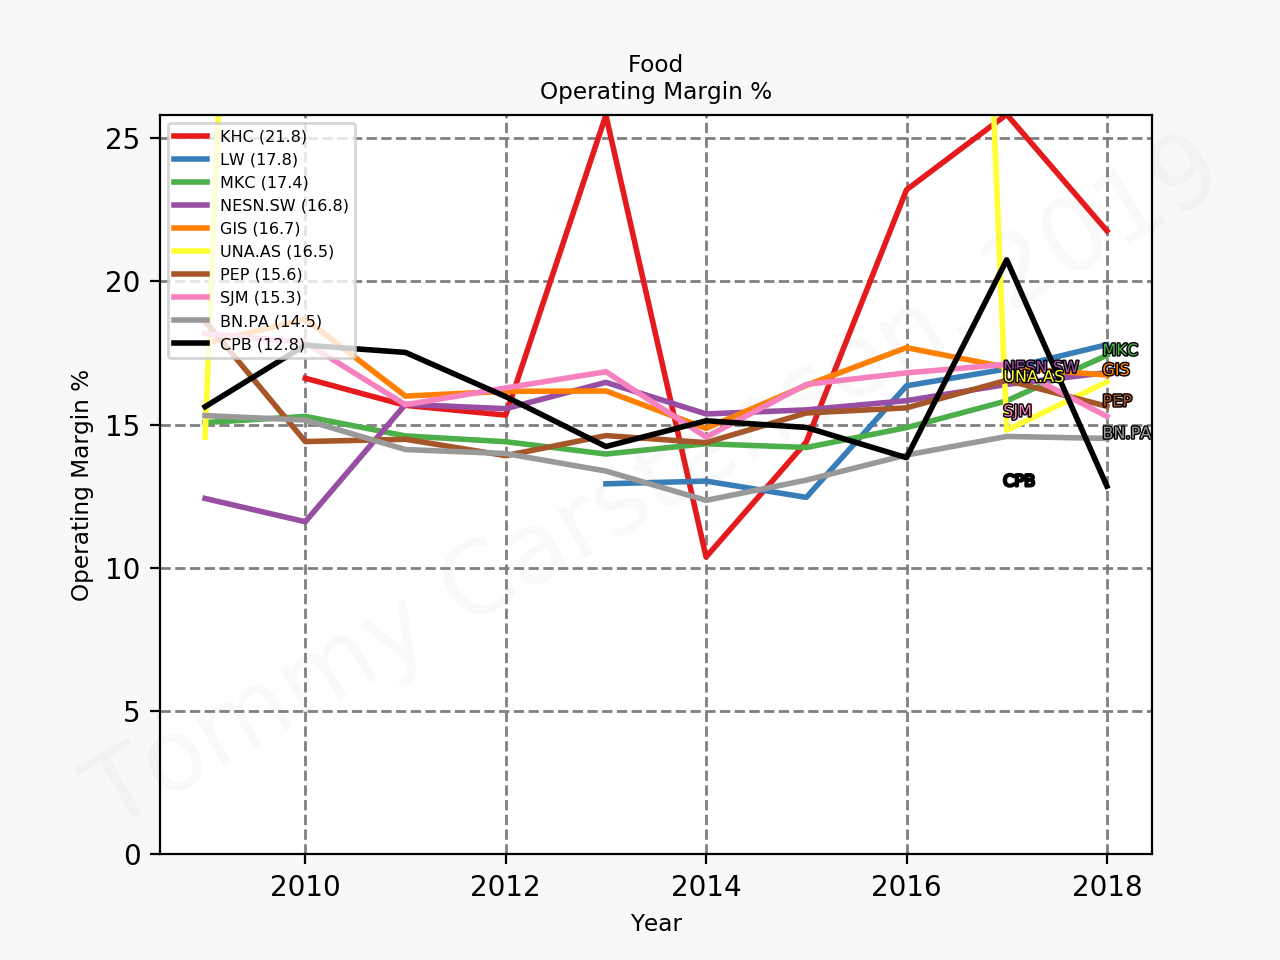
The operating margin expanded to 19.1% and 17.8% on a TTM basis, which is very high compared to industry peers. The improved operating margin also follows the divestiture of low margin businesses.

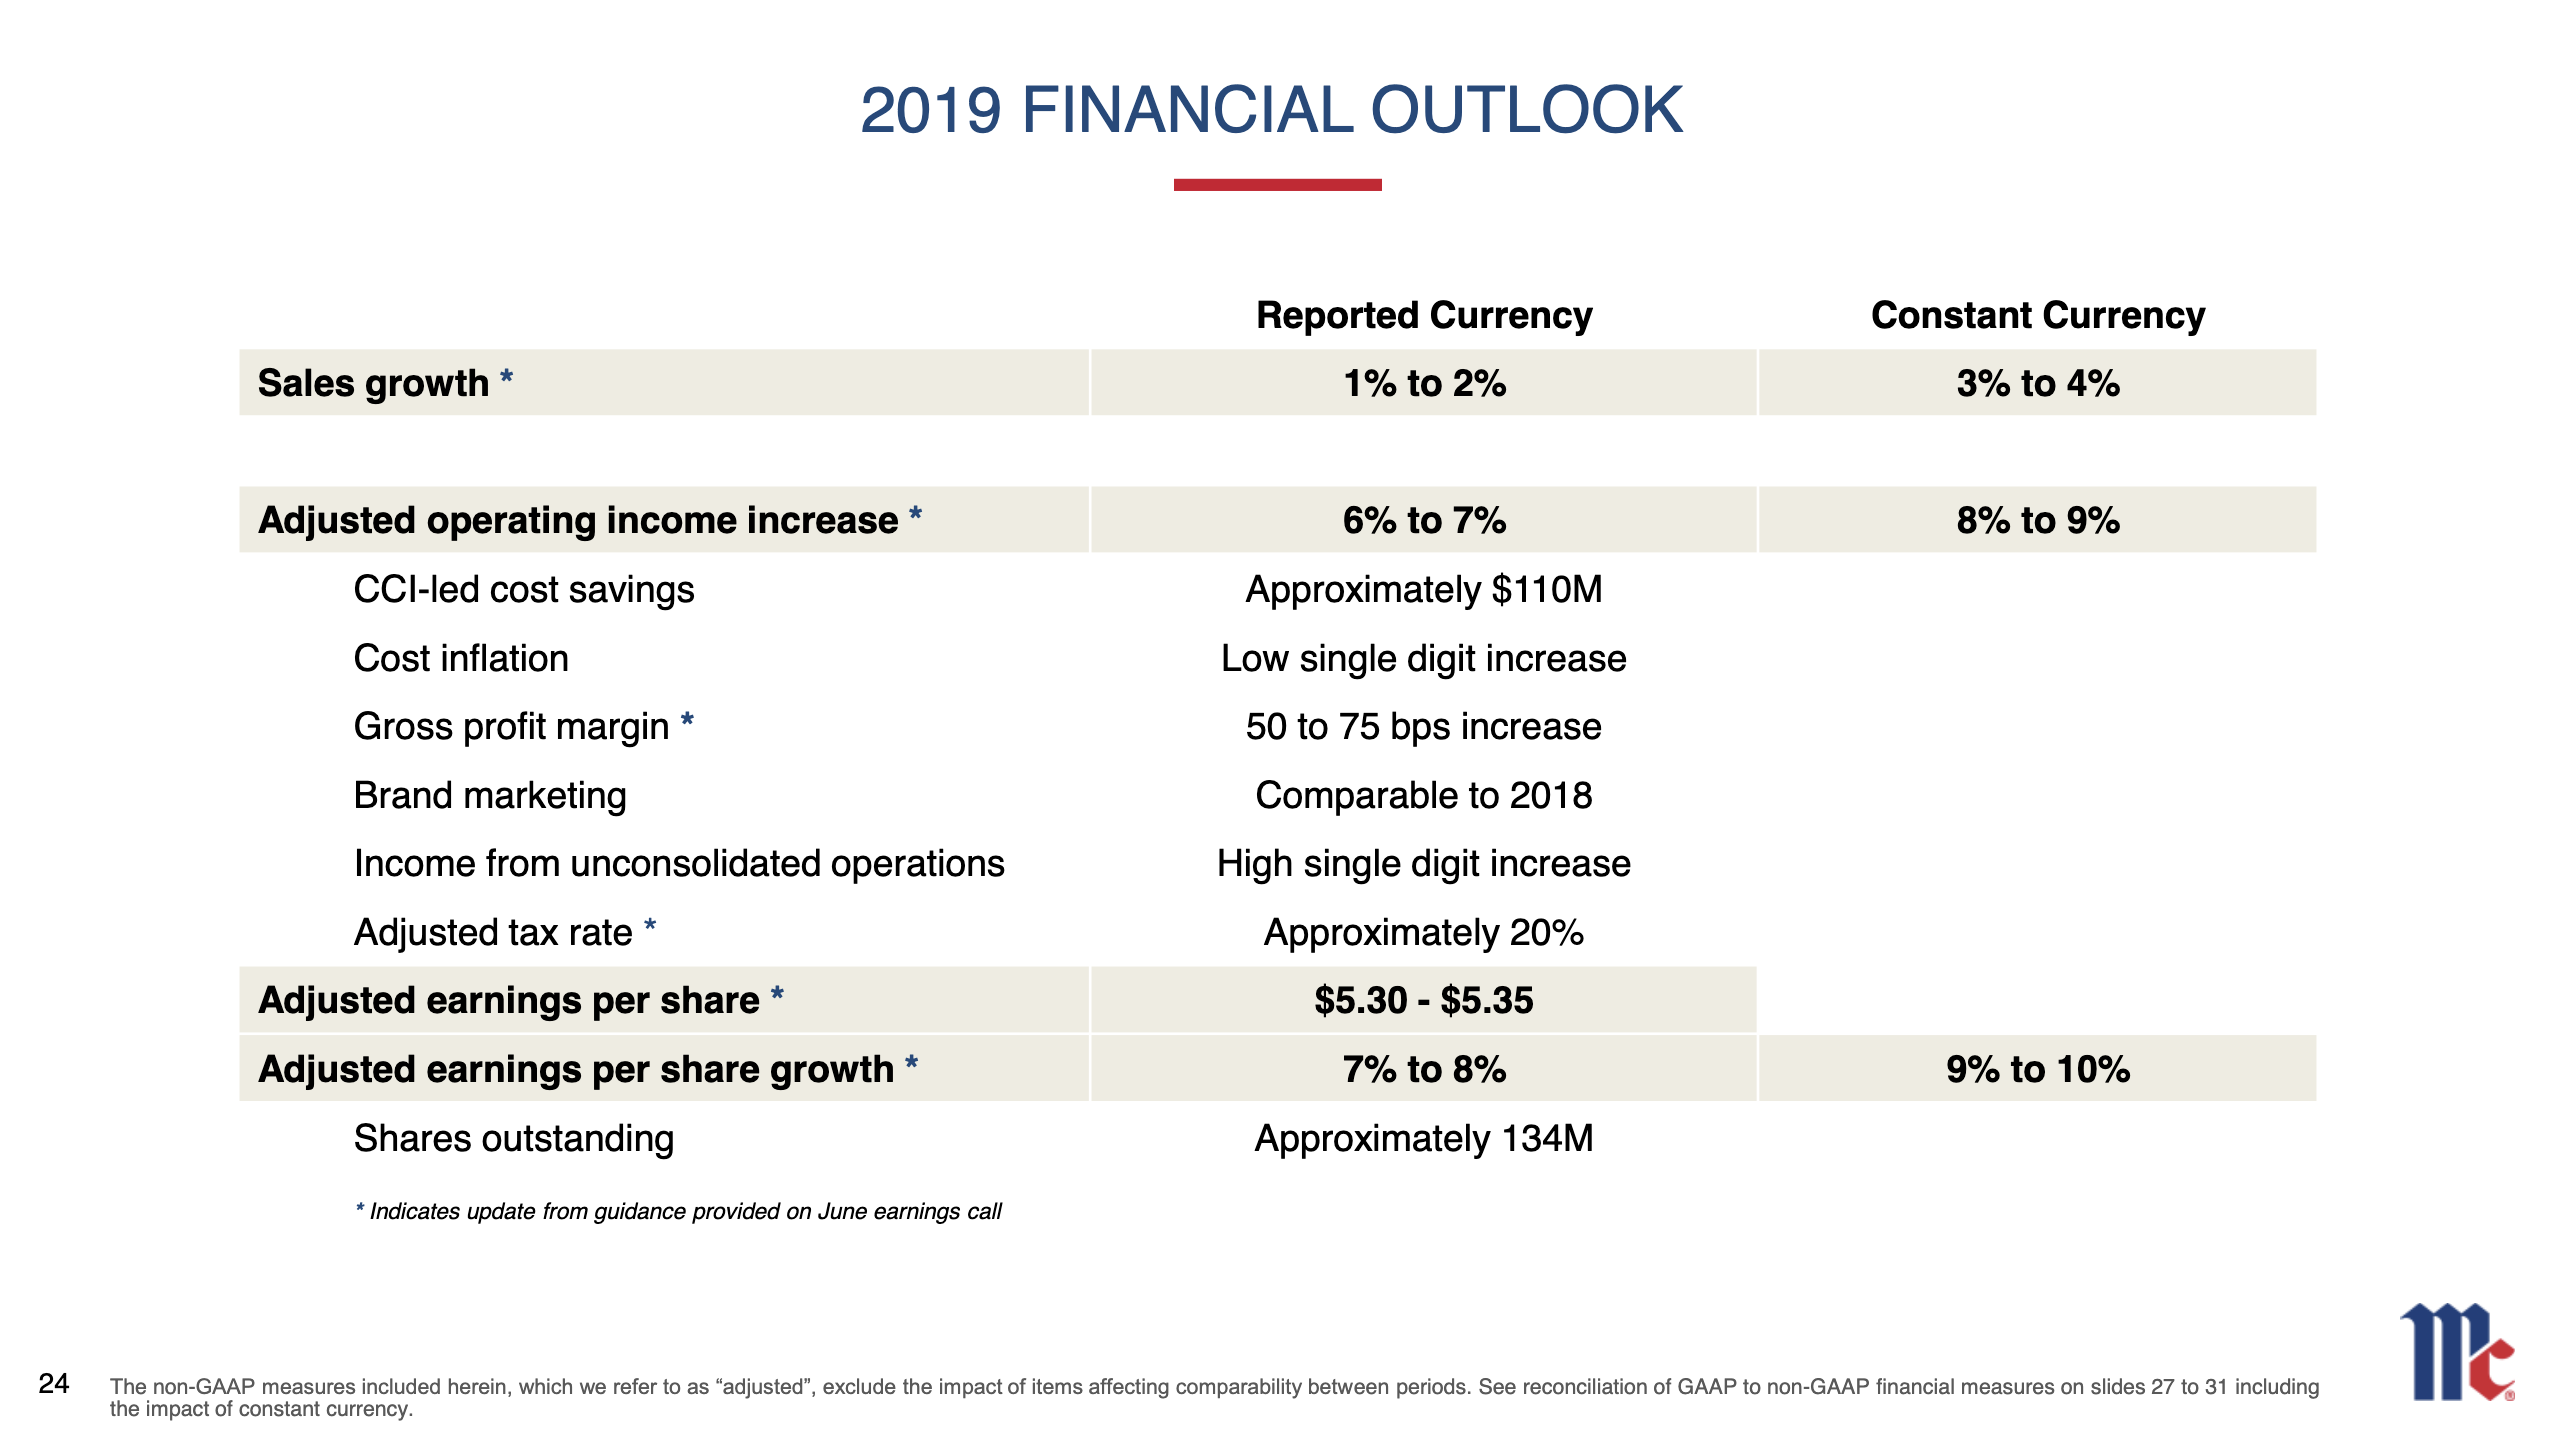
Revised financial outlook

The slide below summarises the revised financial outlook. This revised outlook comes at the back of earnings from other S&P500 companies that almost entirely involved lowered estimates.

Expanded multiples

Given the revised financial outlook and the improved margins the acquisition of RB Foods comes across as a master stroke. But McCormick remains very richly valued compared to other businesses in the sector. Kraft Heinz [KHC] might be the better choice at a forward P/E of 10.7 compared to a forward P/E of 27.6 for McCormick.

Time series of enterprise value over operating income for businesses similar to McCormick

Status on the S&P500 going into the Q3 earnings season

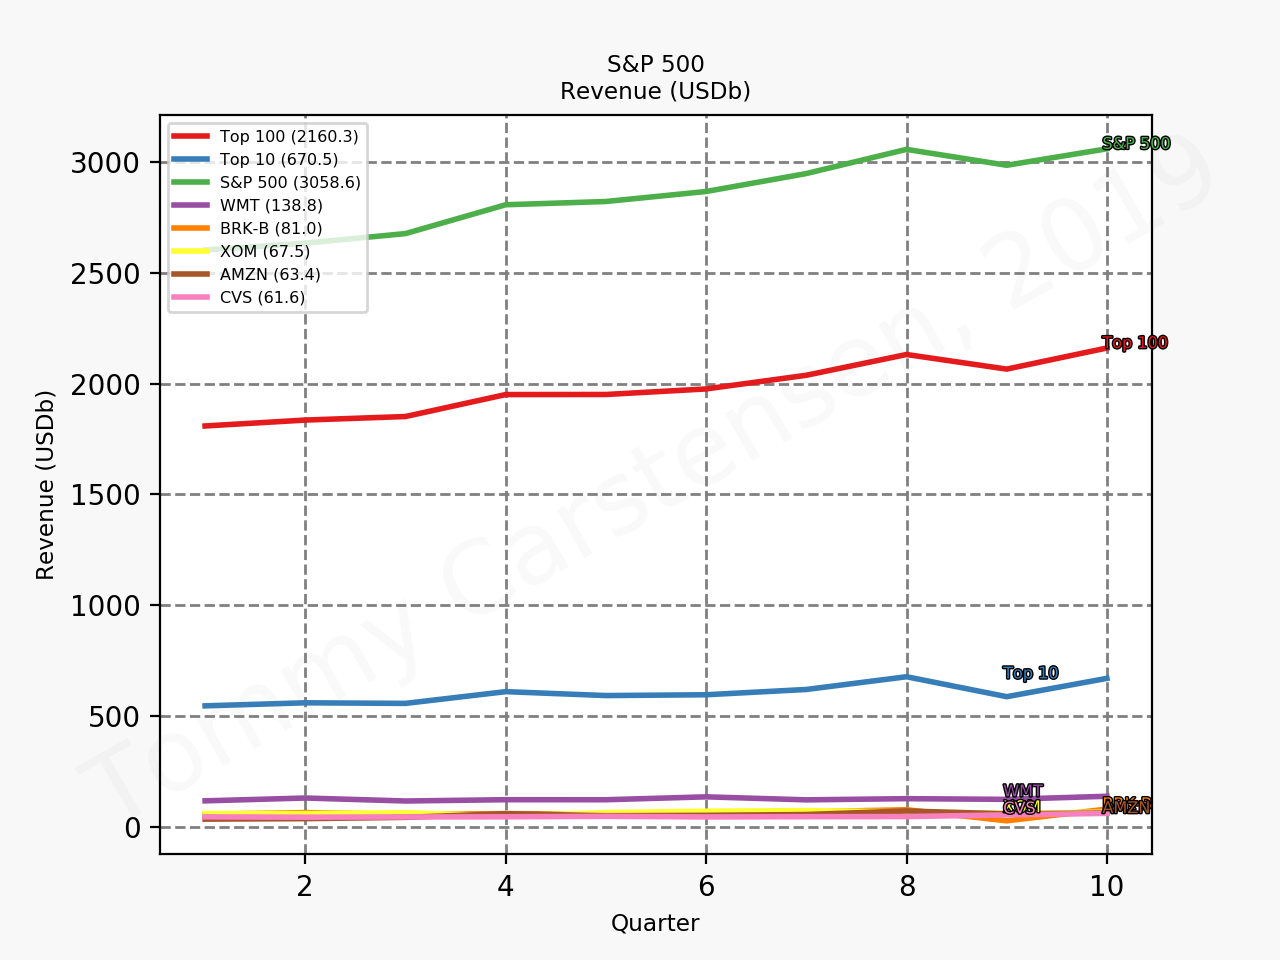
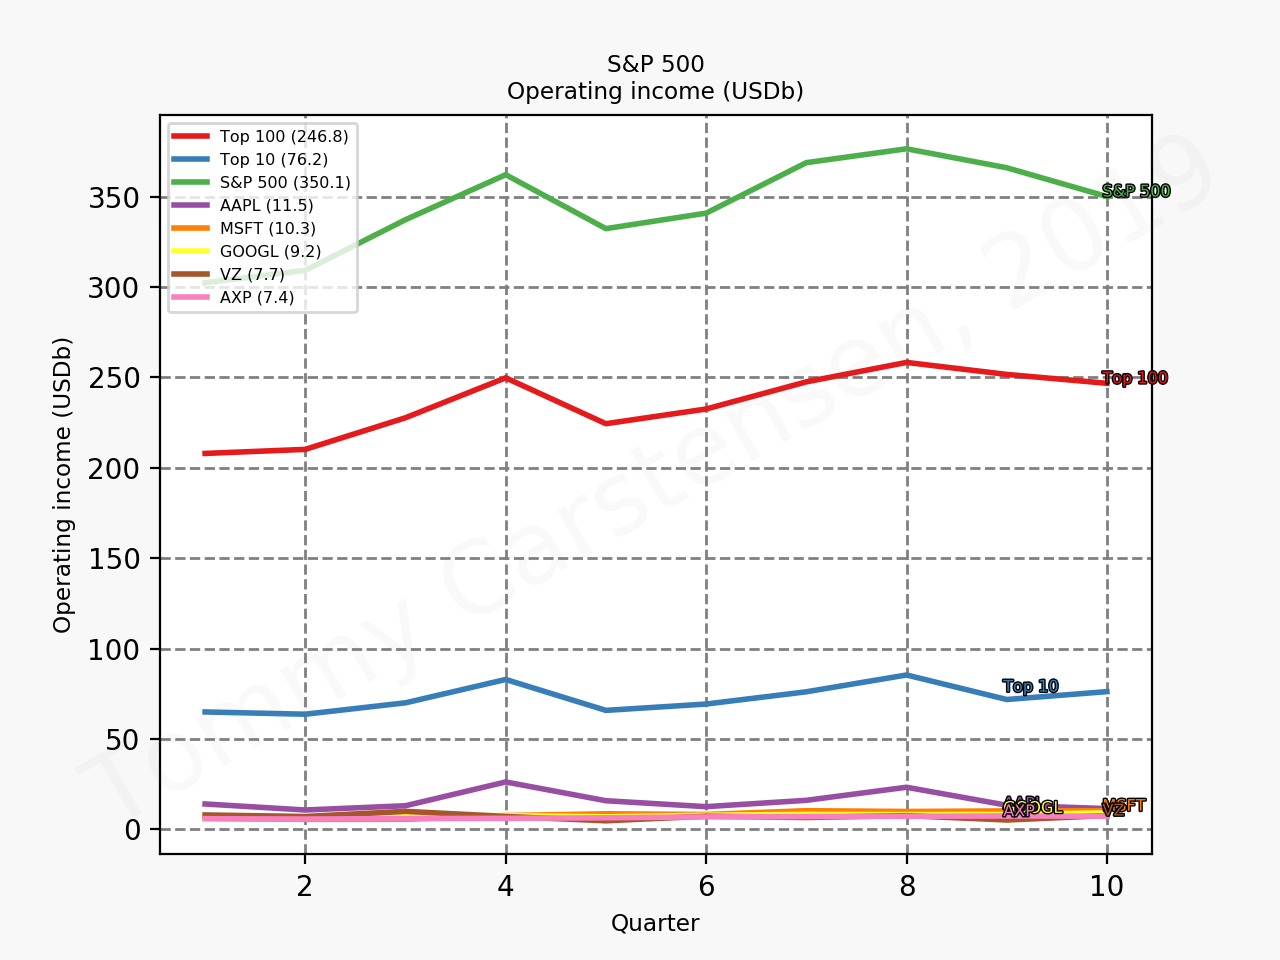
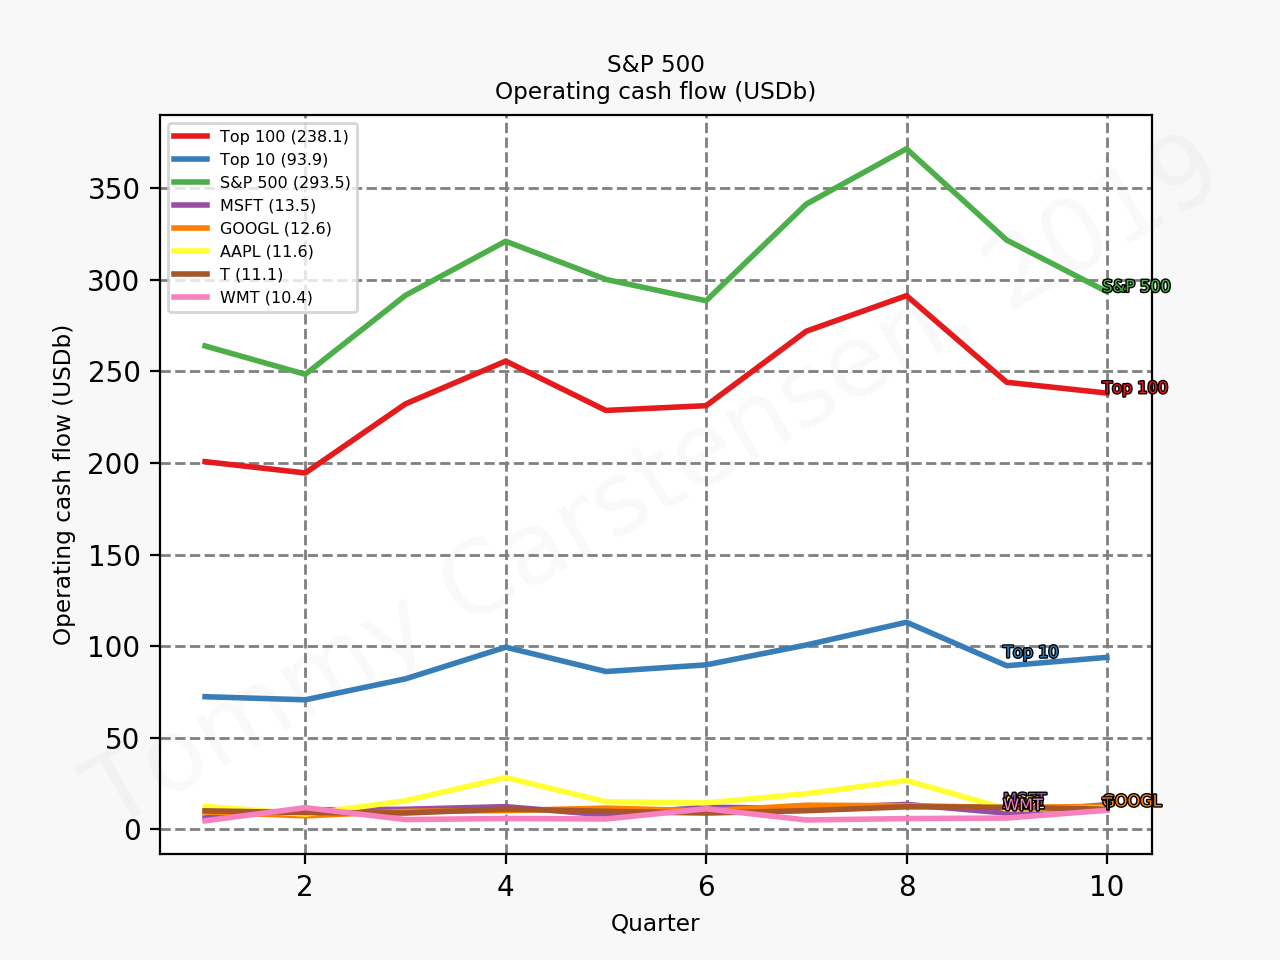
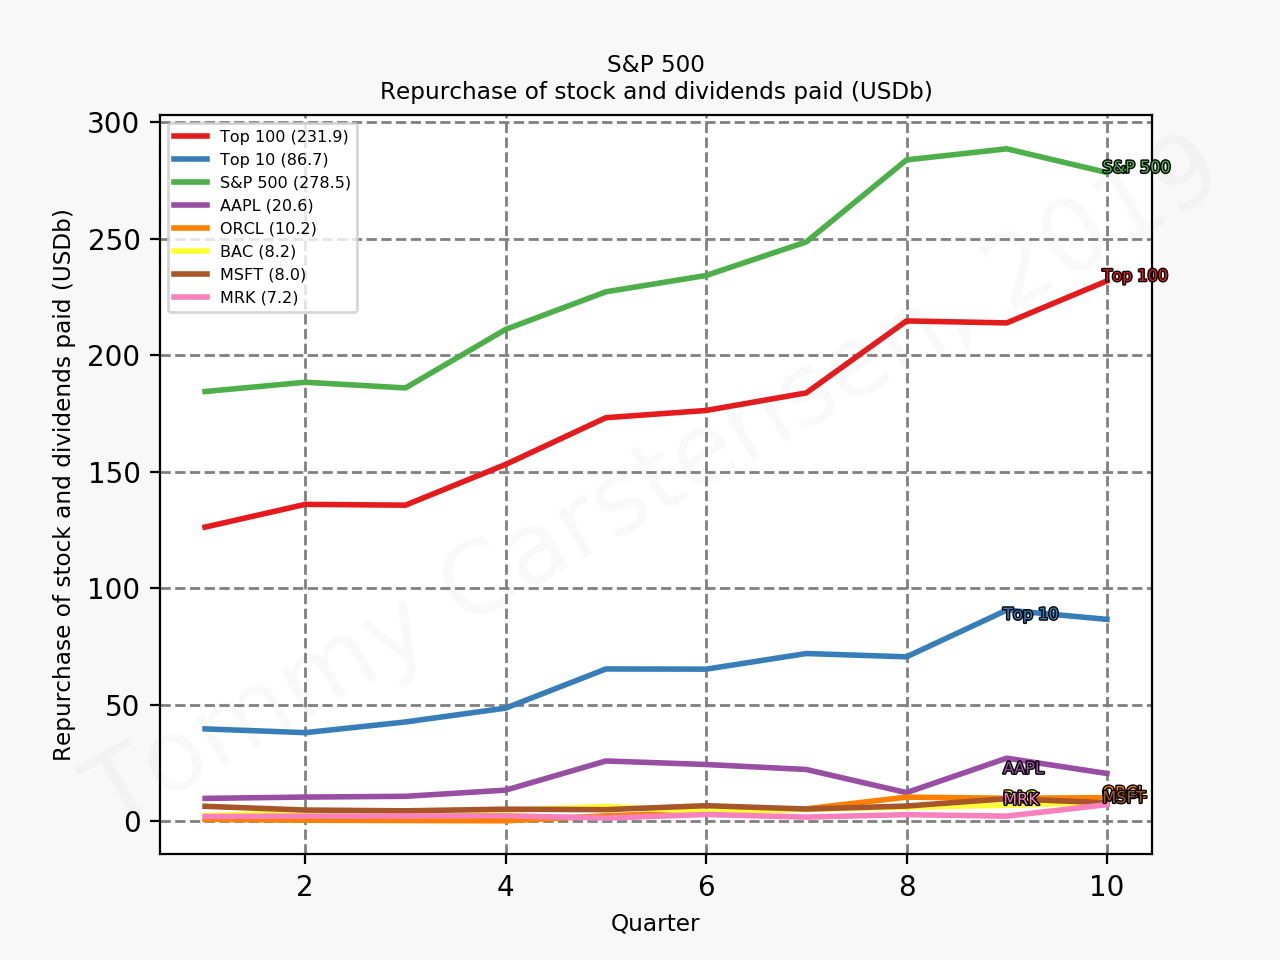
The earnings season kicks into gear this week with earnings from PepsiCo, Costco, McCormick, Constellations Brands and others. The week from October 14th to 18th sees JP Morgan, Wells Fargo, BoA, J&J, UnitedHealth, Coca Cola and others reporting. Revenue as well as dividends and stock repurchases are at all time highs, but operating income and operating cash flow seems to be suffering from the trade war between China and the US. The figures below summarise the numbers for S&P500 going into the earnings season.

Revenue
Operating income
Operating cash flow
Repurchase of stock and dividends paid

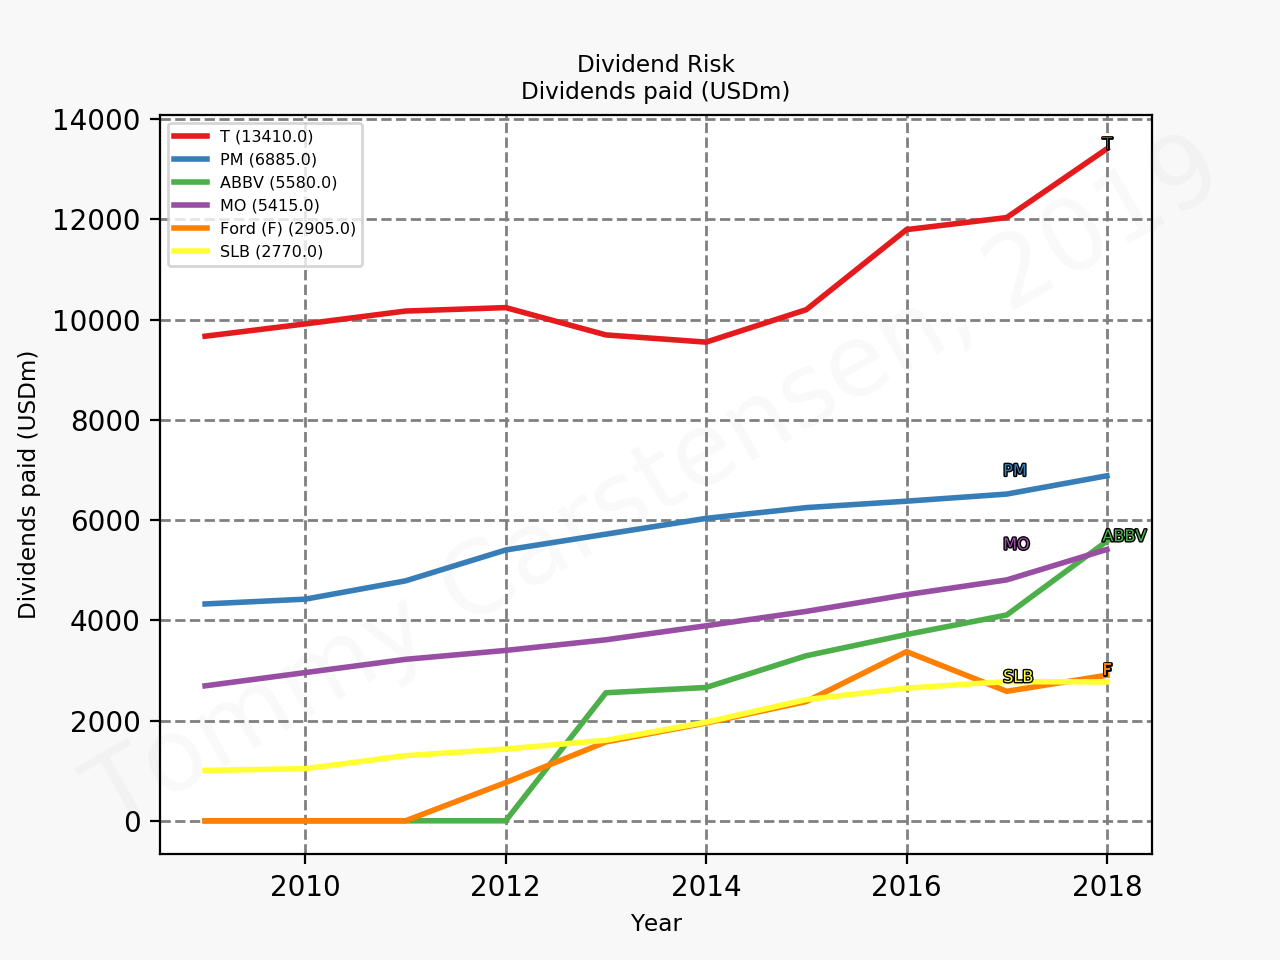
Some companies have very high payout ratios and their dividend might be at risk of being cut going into a recession.

Schlumberger [SLB]
Altria [MO]
Philip Morris [PM]
AT&T [T]
AbbVie [ABBV]
Ford [F]
Time series of trailing annual dividend yield
Time series of dividends paid

Oral semaglutide (Rybelsus®) receives FDA approval for the treatment of type 2 diabetes

The FDA has issued a press release regarding the approval of the first oral GLP-1 treatment for type 2 diabetes. Novo Nordisk also issued a press release on Rybelsus®. Novo Nordisk in the US issued a separate press release. In terms of future peak sales this might be the most important FDA approval of any drug this year.

Insulin has in recent years lost market share to drugs such as injected GLP1, oral SGLT2 and in particular oral DPP4 such as Januvia® from Merck and Trajenta® from Eli Lilly.

Novo Nordisk has annual sales of approximately $17B of which more than 80% originate from anti-diabetic drugs. The oral DPP4 drug Januvia® in 2016 reached worldwide peak sales of approximately $6B. Rybelsus® does not have the same side effects as DPP4 and it is not impossible imagining Rybelsus® reaching peak sales as high or higher than Januvia®. Sales of Victoza® and Levemir® will continue to shrink as they are cannibalised by their superior equivalents Ozempic® and Tresiba® and other drugs. But this deterioration will most likely be more than offset by Rybelsus® going forward.

The late stage clinical trial SOUL (NCT03914326) for oral semaglutide follows the phase 3 PIONEER studies. If this trial is succesful, then this could put Rybelsus® on par with other GLP1 class drugs in terms of major adverse cardiovascular events (MACE) and further boost sales of Rybelsus® in the decade ahead.

Additionally it is worth pointing out that injected semaglutide is already used for the treatment of obesity (Saxenda®) and oral semaglutide could very well be approved for the same purpose.

Novo Nordisk has with the approval of oral semaglutide for the treatment of type 2 diabetes (Rybelsus®) positioned itself well for the future. But the approval might have been expected by the market for the past few years and a lot of it might already be priced in as witnessed by the somewhat insignificant share price movement of approximately +2% following the approval.

Reuters – Novo Nordisk wins U.S. approval for first-of-its-kind oral diabetes drug