H&M released their nine month report prior to the market opening on October 3rd. Some of the headlines from that report are:
- With well-received summer collections, the H&M group’s net sales increased by 12 percent to SEK 62,572 m (55,821) in the third quarter. In local currencies, net sales increased by 8 percent compared with the corresponding quarter the previous year.
- Online sales in the third quarter increased by 30 percent in SEK and by 25 percent in local currencies.
- Gross profit increased by 13 percent to SEK 31,815 m (28,091). This corresponds to a gross margin of 50.8 percent (50.3).
- Profit after financial items increased by 25 percent to SEK 5,011 m (4,012). The group’s profit after tax increased to SEK 3,859 m (3,099), corresponding to SEK 2.33 (1.87) per share.
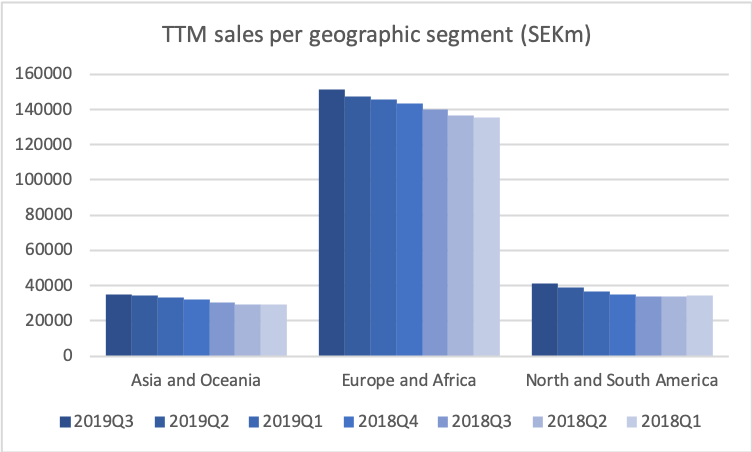
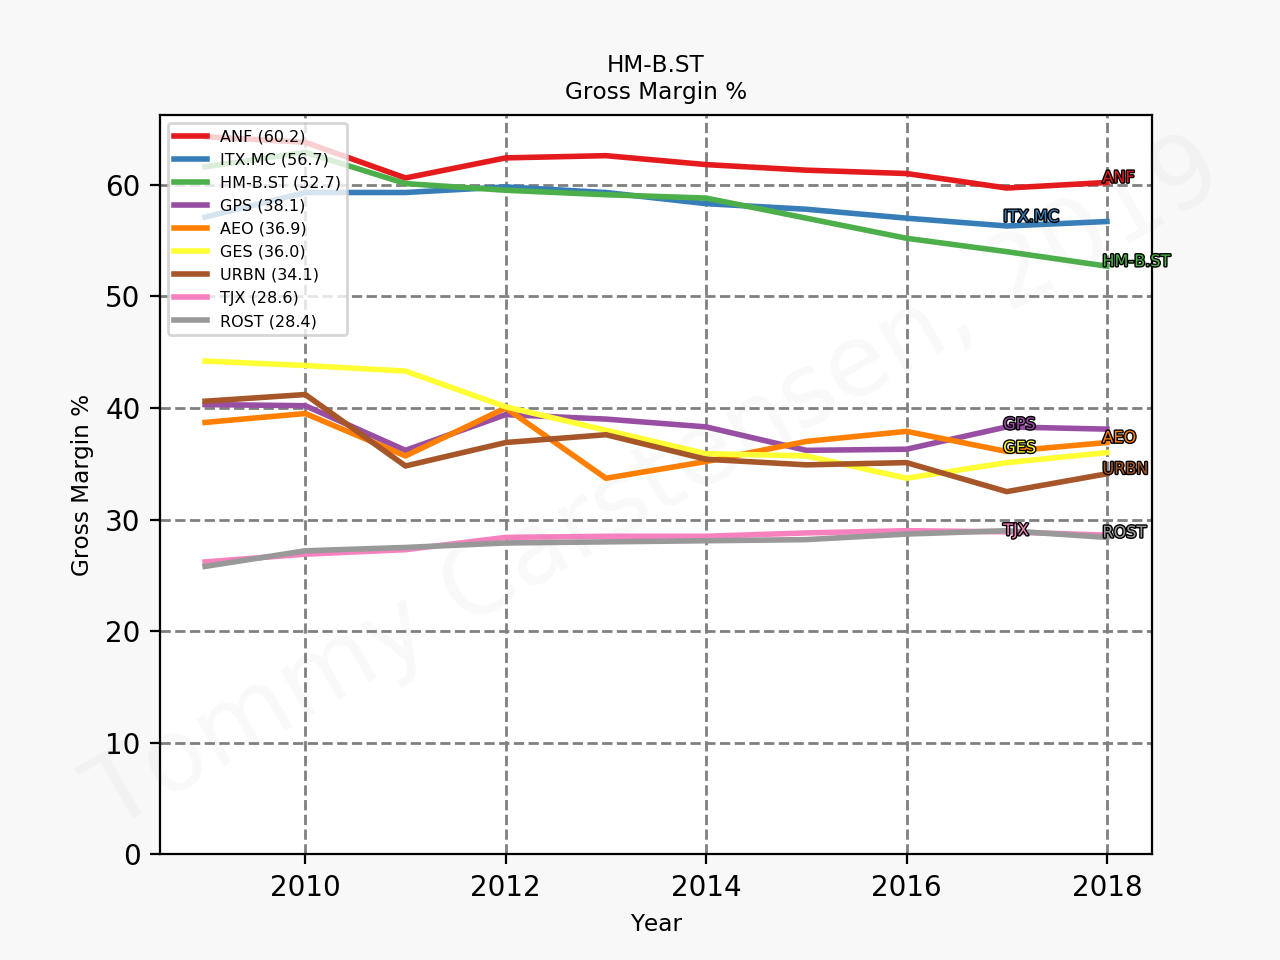
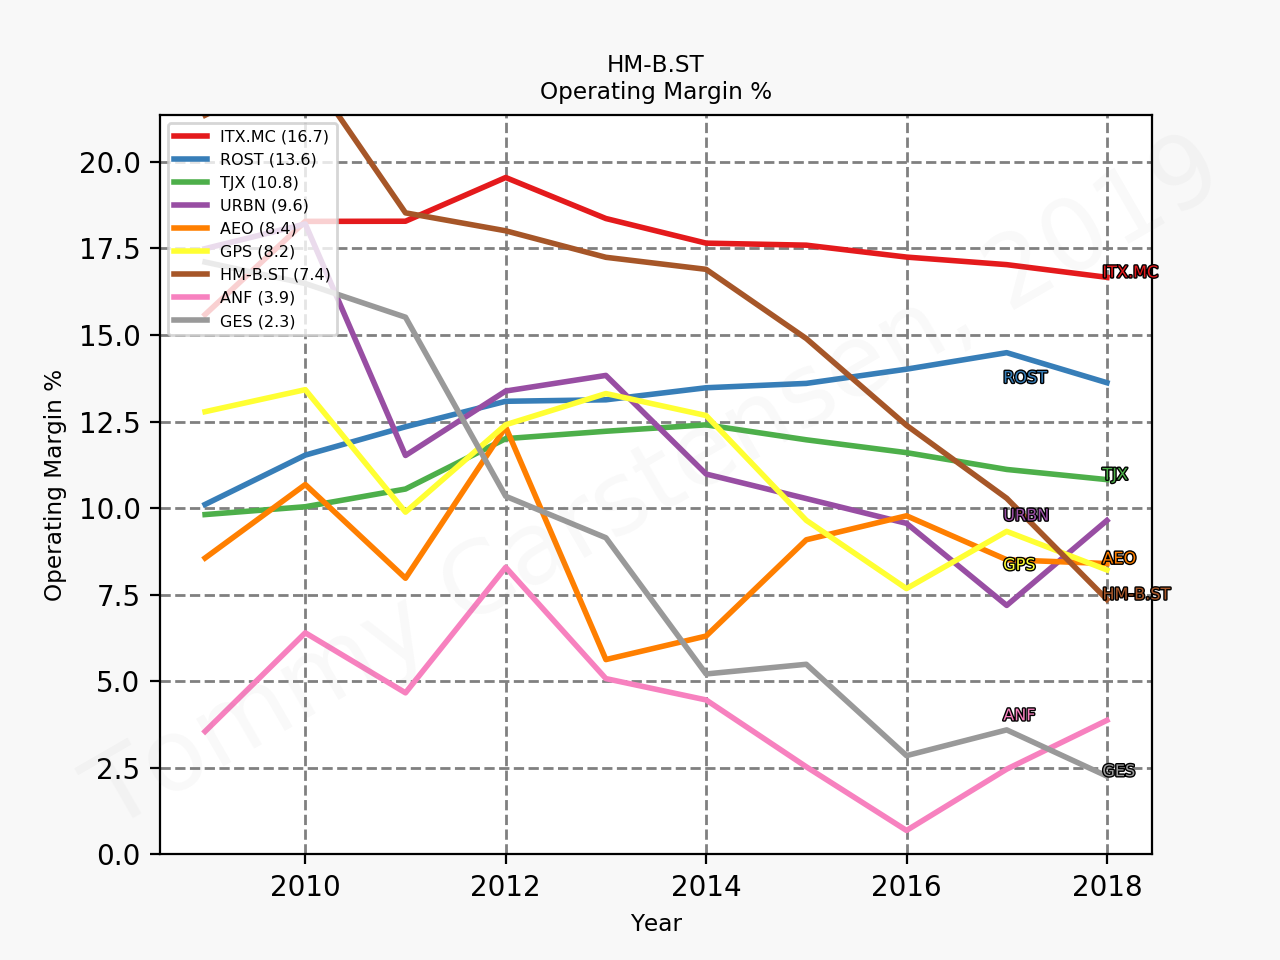
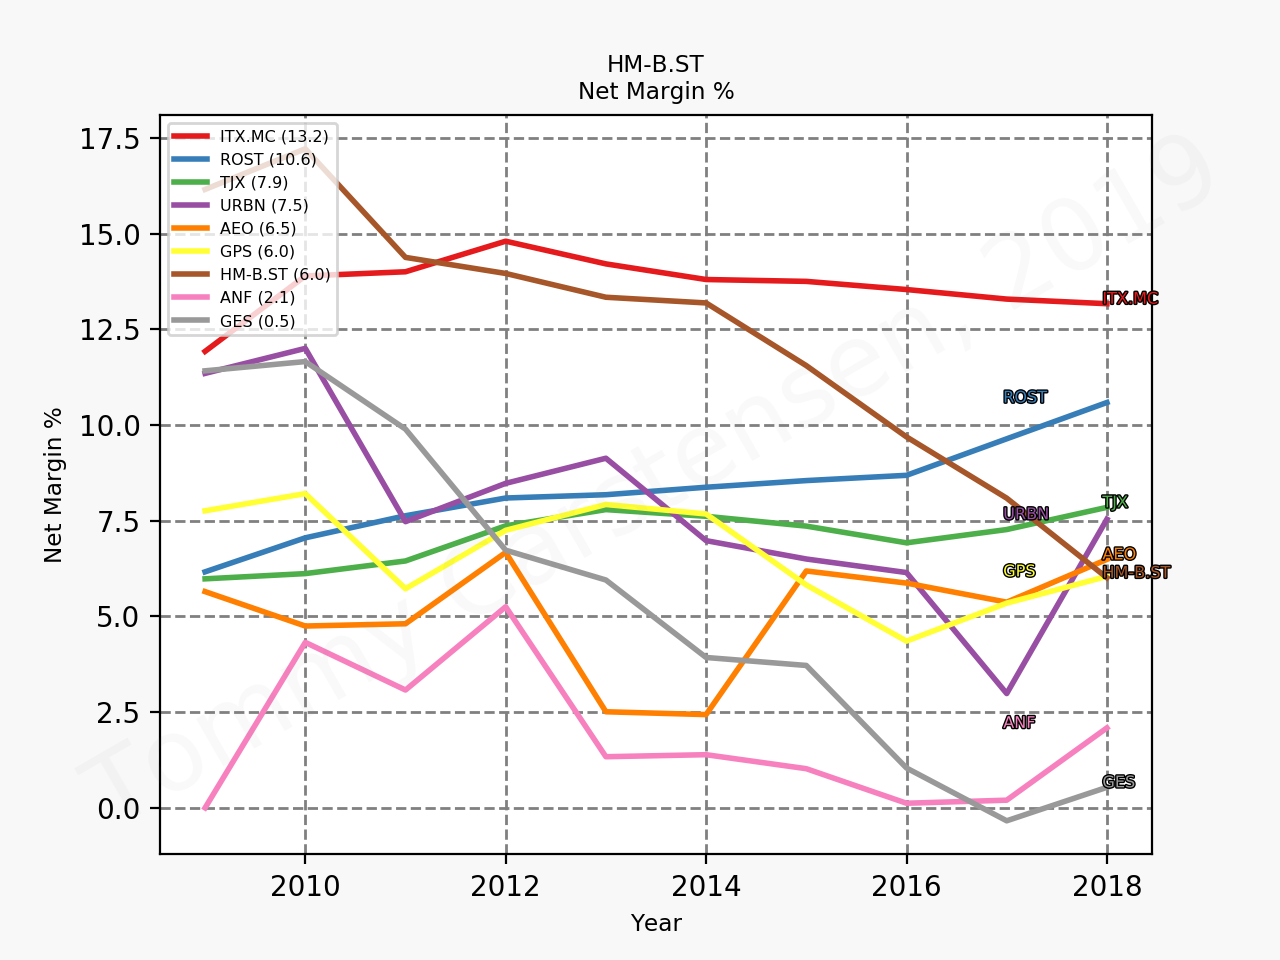
Revenue, profits and margins
The figures below summarise the data for the trailing twelve months (TTM). Revenue continues to go up primarily as a consequence of improved sales in each store rather than new store openings.
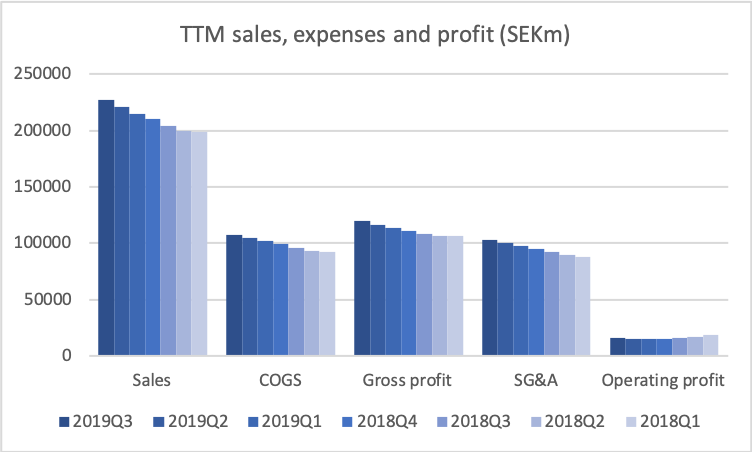
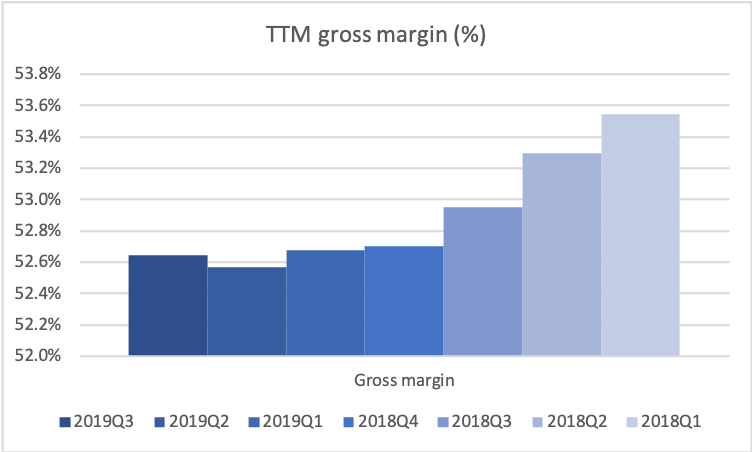
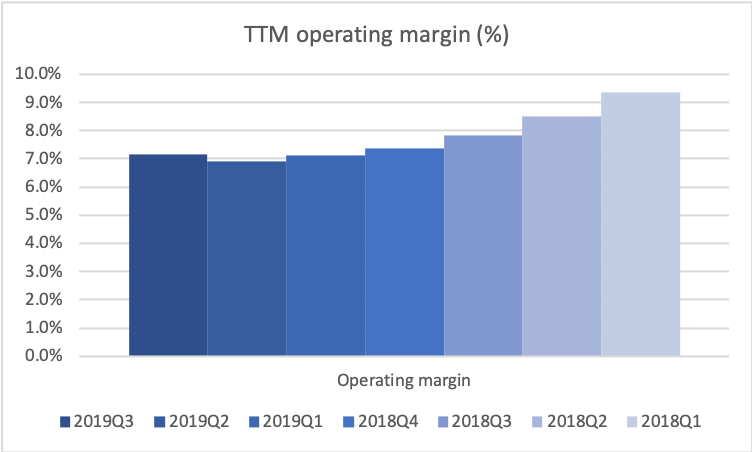
The stabilised margins follow years of declining margins.
Price movement and multiples
H&M has unlike its Spanish competitor Inditex [$ITX.MC] seen its market capitalisation cut in more than half, which coincided with the deterioration of margins. The share price has gone up by approximately 54% from a 52 week low at the end of December 2018 of SEK125 to SEK192.

For a brief period of time in the winter of 2018 H&M sported a dividend yield above 7%.

The time to buy H&M was probably in 2018 or after the Q4 earnings on December 17th. But at that time there were doubts about the turnaround. However the share price started going up, when the chairman Stefan Persson bought more than 1% of the outstanding shares on February 5th and 12th. The H&M share price experienced a triple bottom at the end of 2018 (SEK125.18 on 26Mar2018, SEK121.28 on 03Sep2018, SEK126.02 on 24Dec2018) and the multiples were lower in 2018 and the beginning of 2019 than they are now. Below various multiples are summarised as time series and compared to those of competitors.


Time to buy?
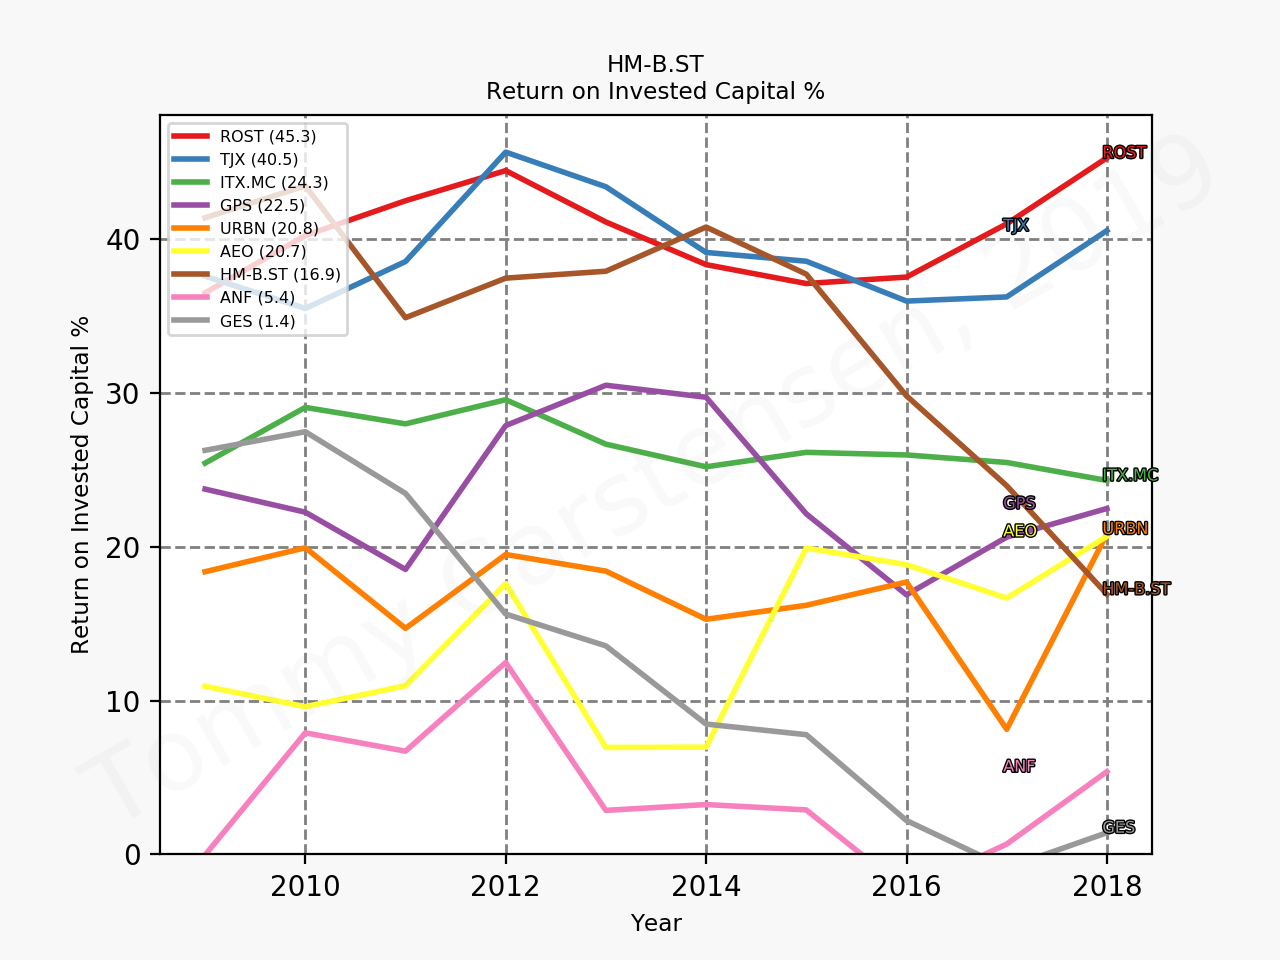
Although H&M is still attractively valued, Gap Inc. [$GPS], which is trading a multi year lows, might prove to be the better investment from a value perspective at current prices, despite the inferior profit margins and the historically inferior return on invested capital (ROIC).
Media coverage
Reuters – H&M shares surge after first quarterly profit rise in two years
Bloomberg – H&M Earnings Return to Growth After Two-Year Slump
03Oct Dagens Industri – H&M fortsätter att bromsa butiksöppningarna
03Oct Dagens Industri – Stark rapport från H&M
04Oct Dagens Industri – Trippelhöjning för H&M – här är dagens rekar