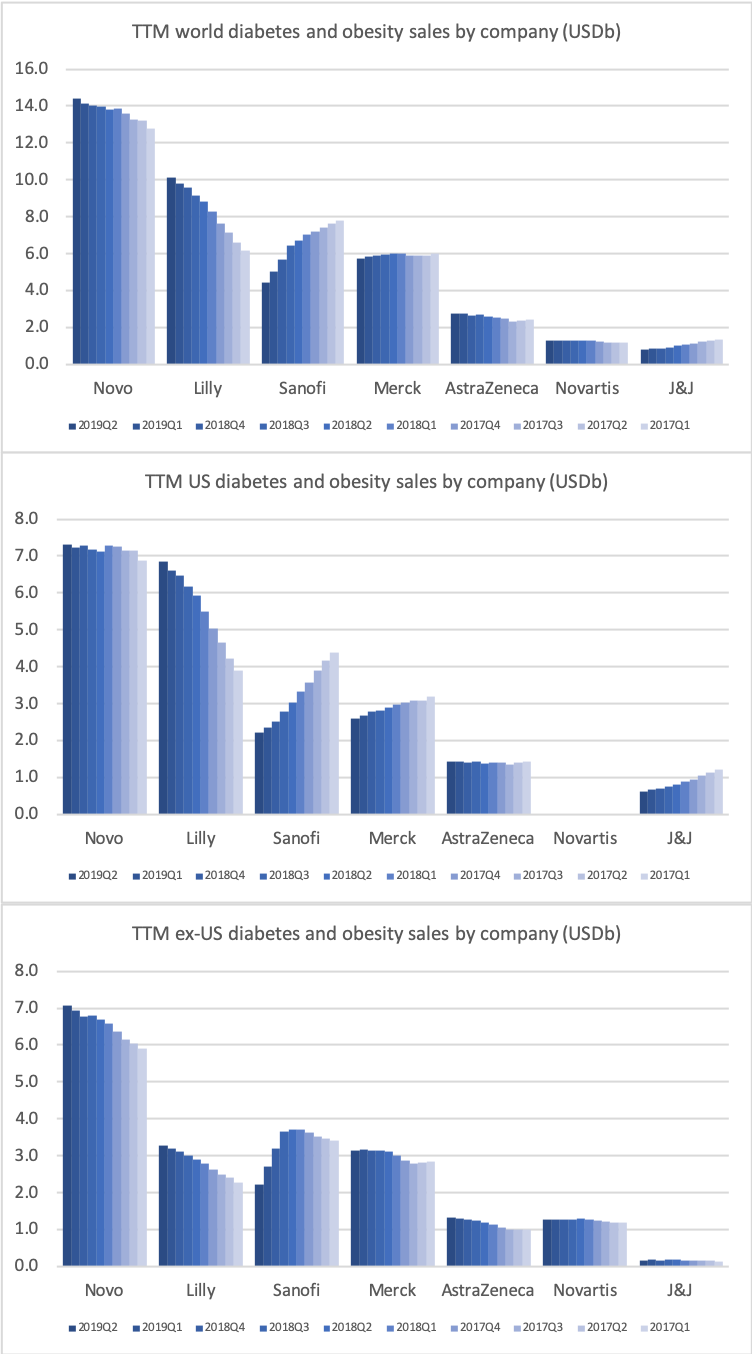
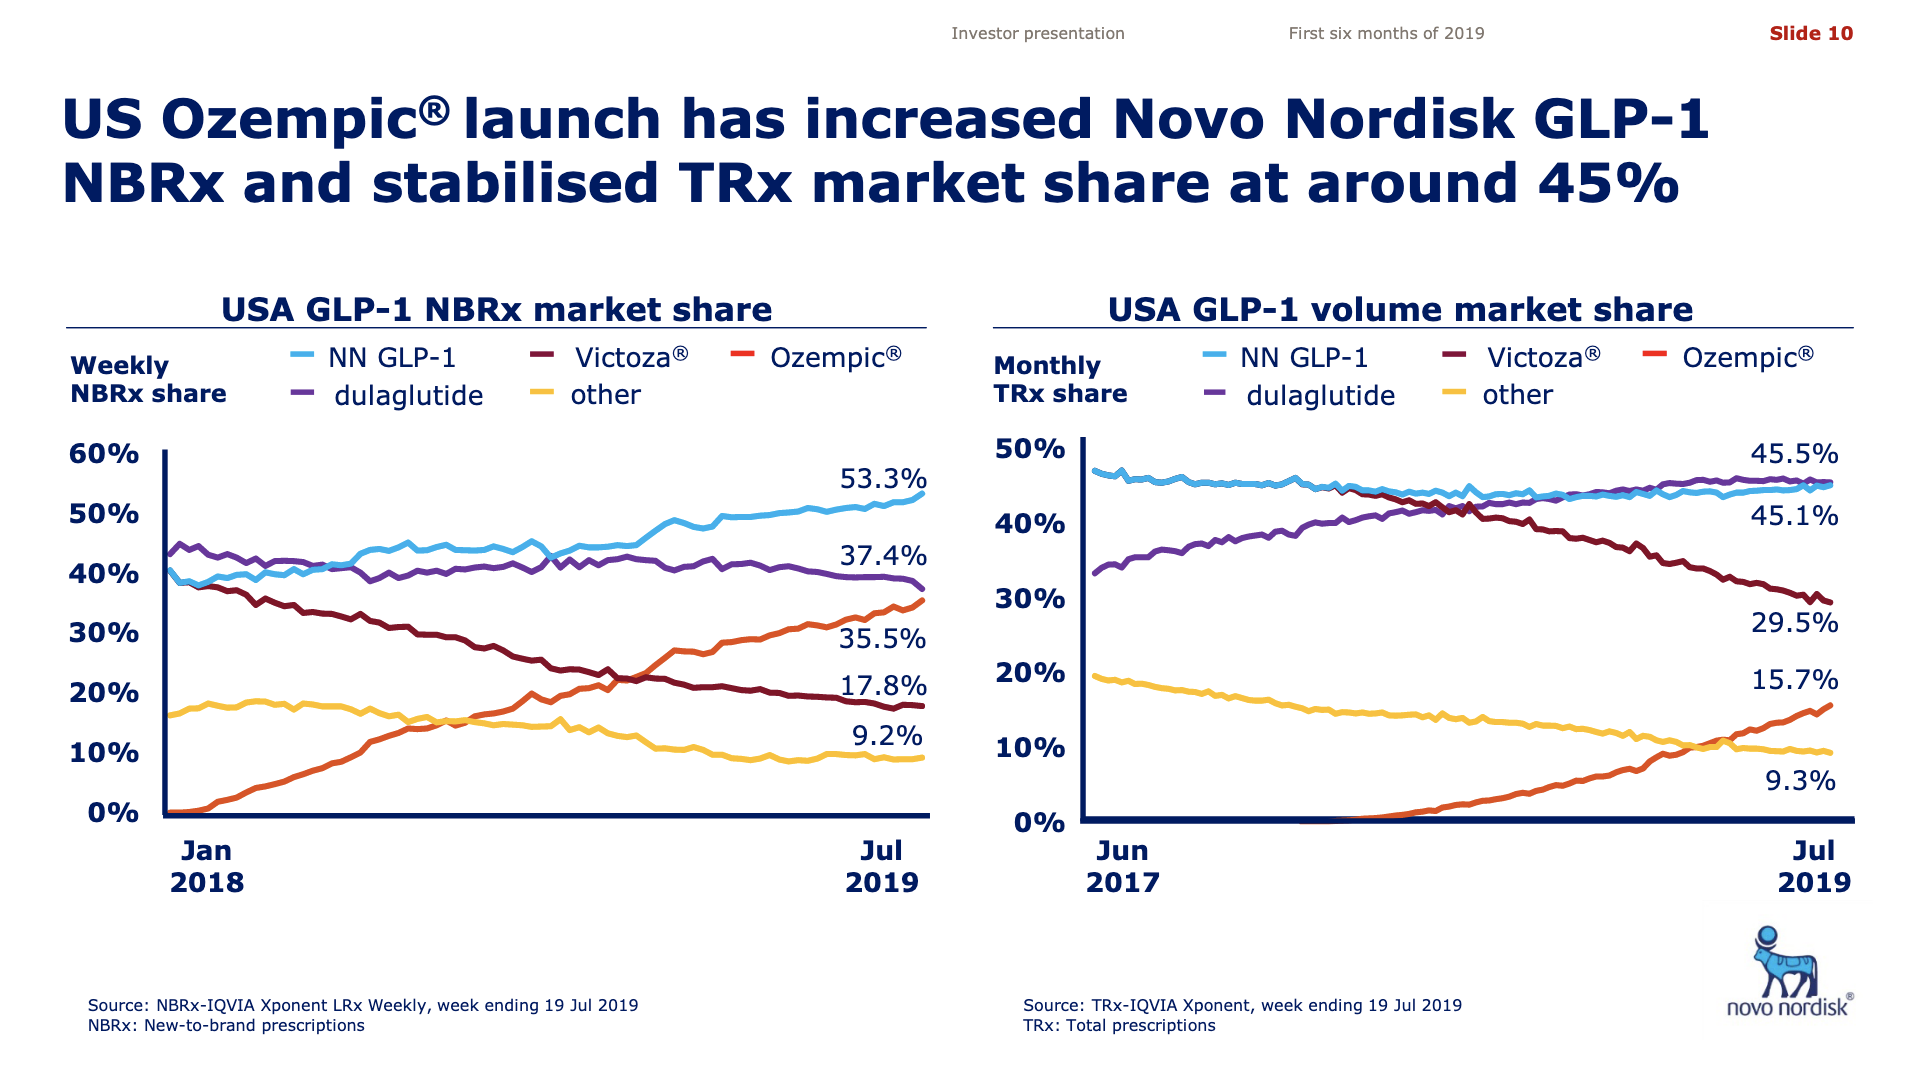
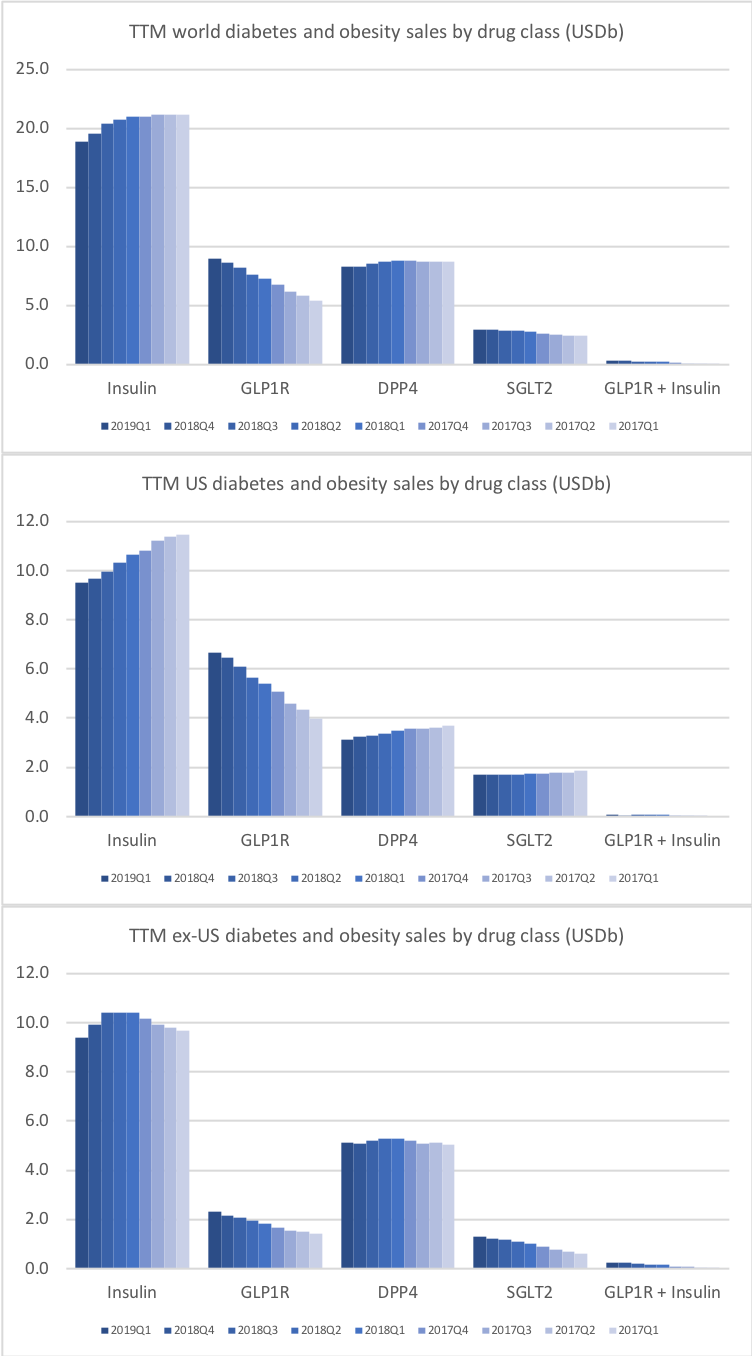
All manufacturers of anti-diabetic drugs have issued press releases on their Q2 earnings. Novo Nordisk on August 9th and Eli Lilly on July 30th. And the 79th Scientific Sessions of the American Diabetes Association took place June 7-11, so a look at the changes in the diabetes landscape is due.
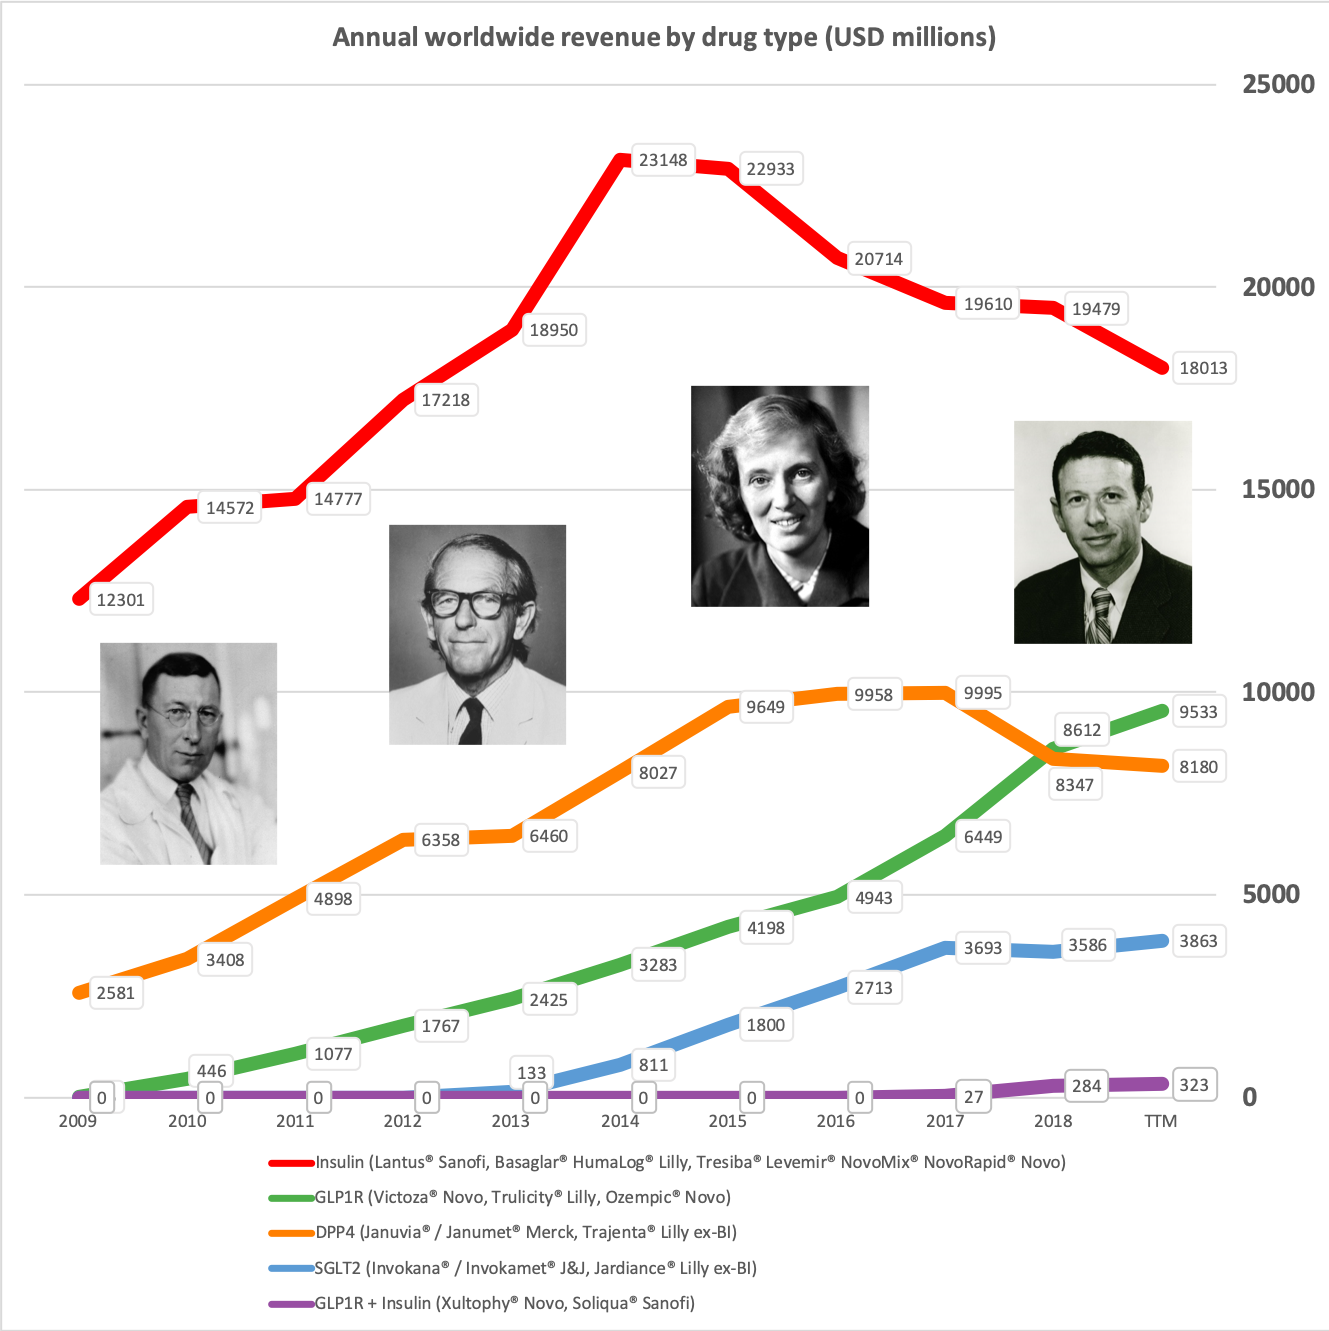
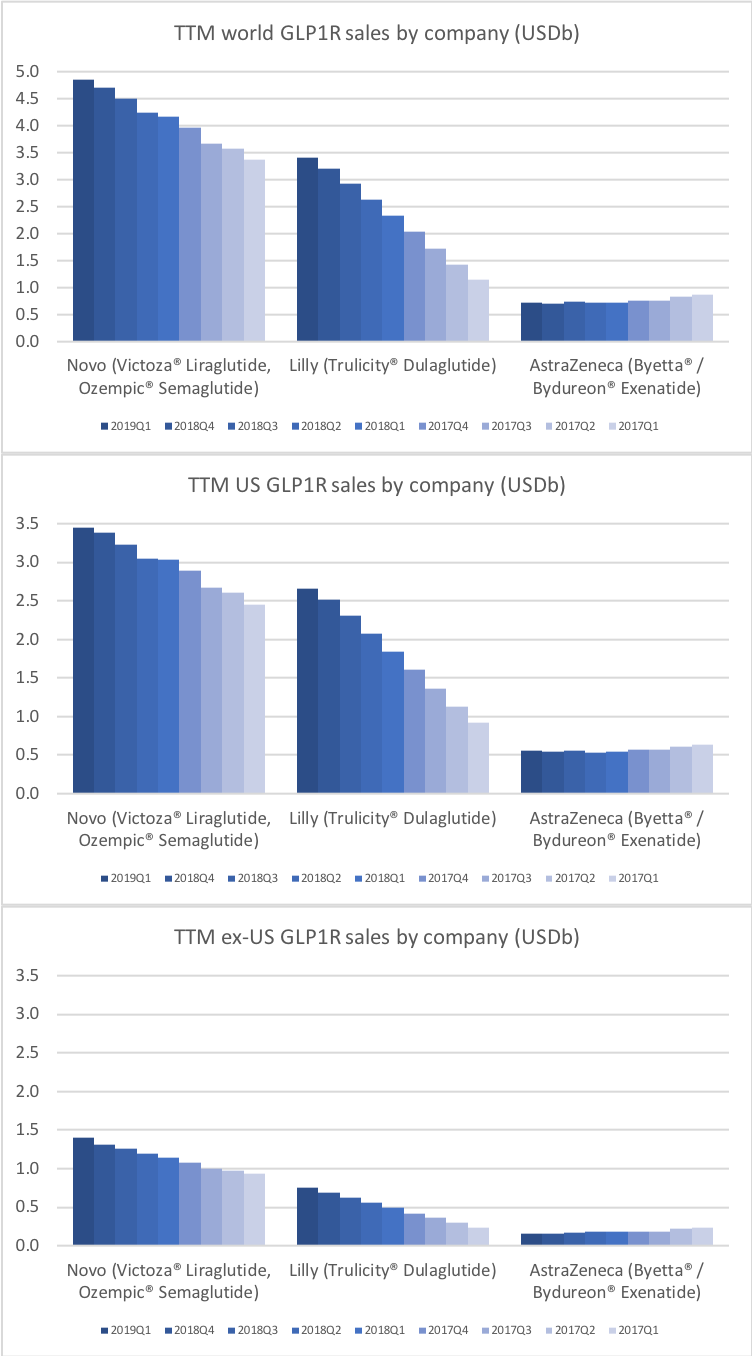
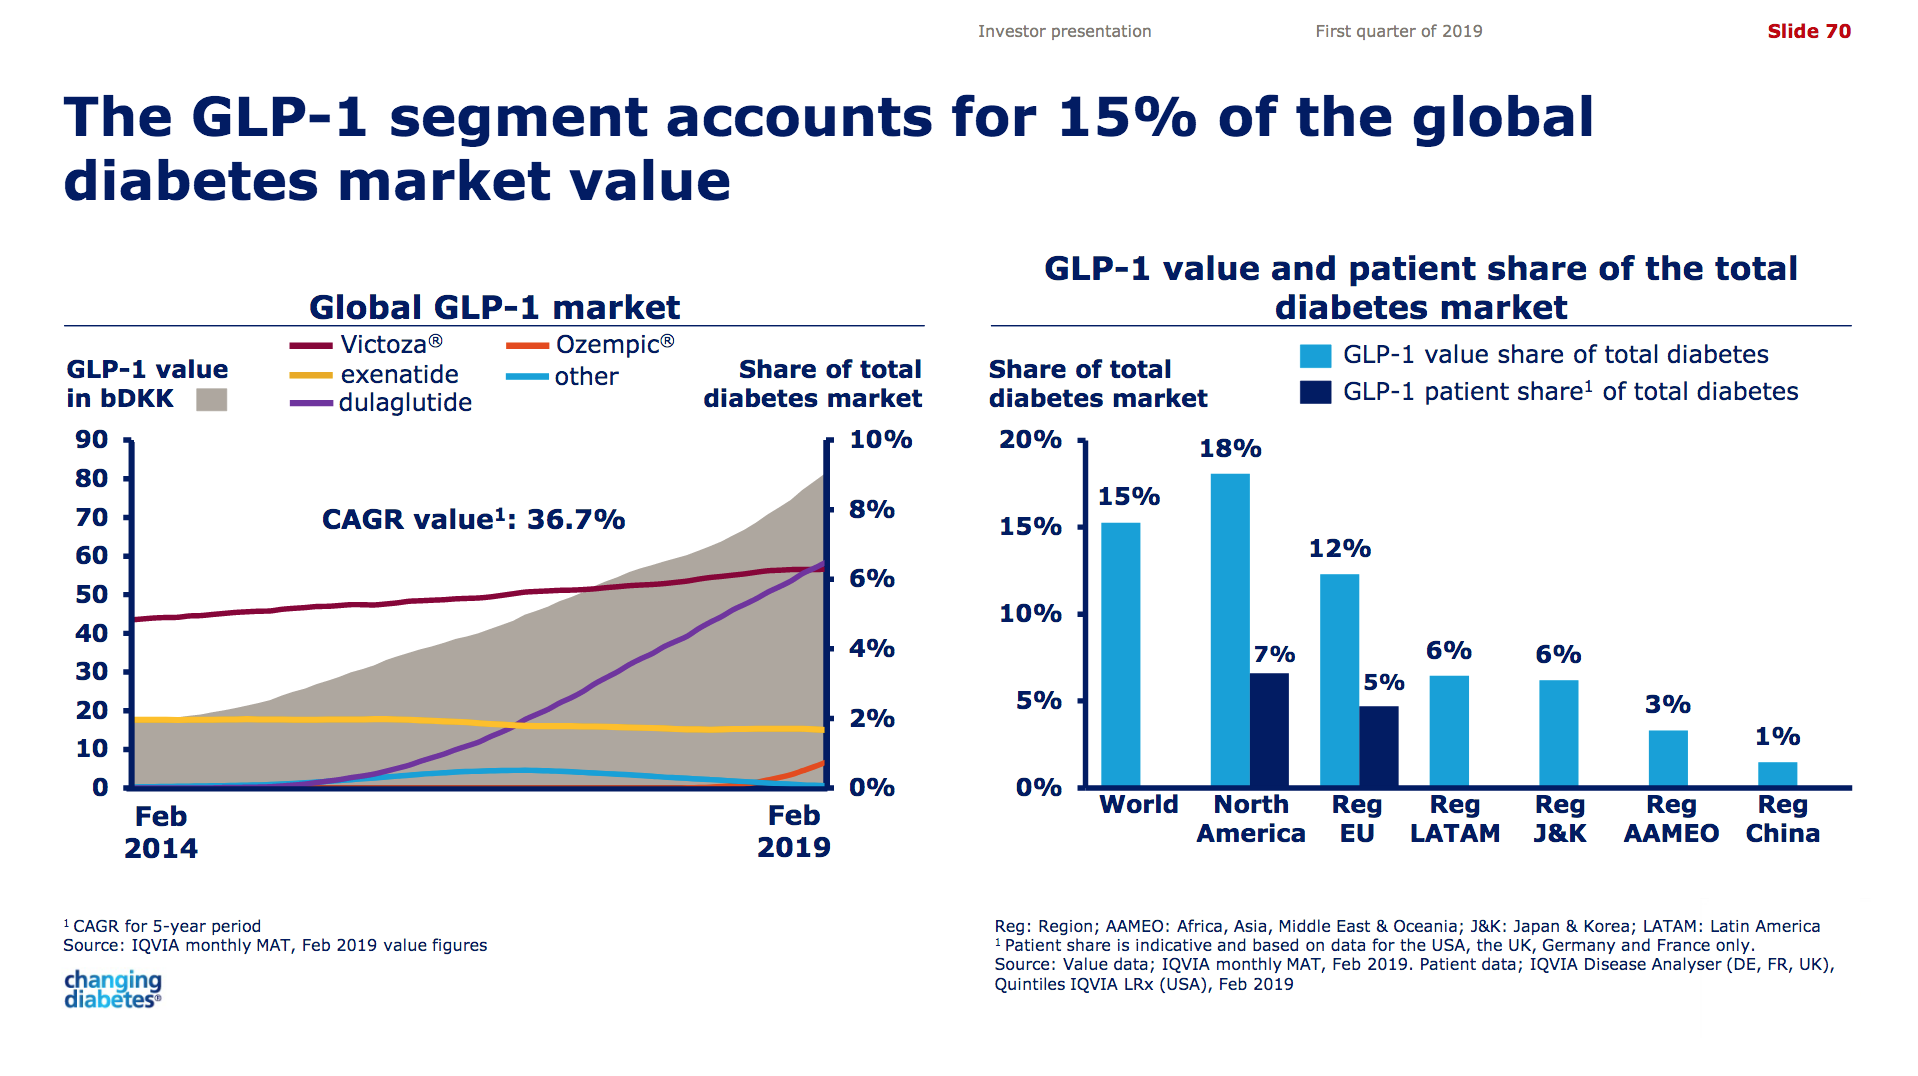
Worldwide sale of insulin continues to deteriorate, whereas the GLP1 class of drugs (e.g. Trulicity® from Eli Lilly and Ozempic® from Novo Nordisk) continues to grow within and outside the US.
The majority of the growth in the US is spearheaded by Lilly and the GLP1 drug Trulicity®, whereas Sanofi and their insulin Lantus® continues to descend lower.
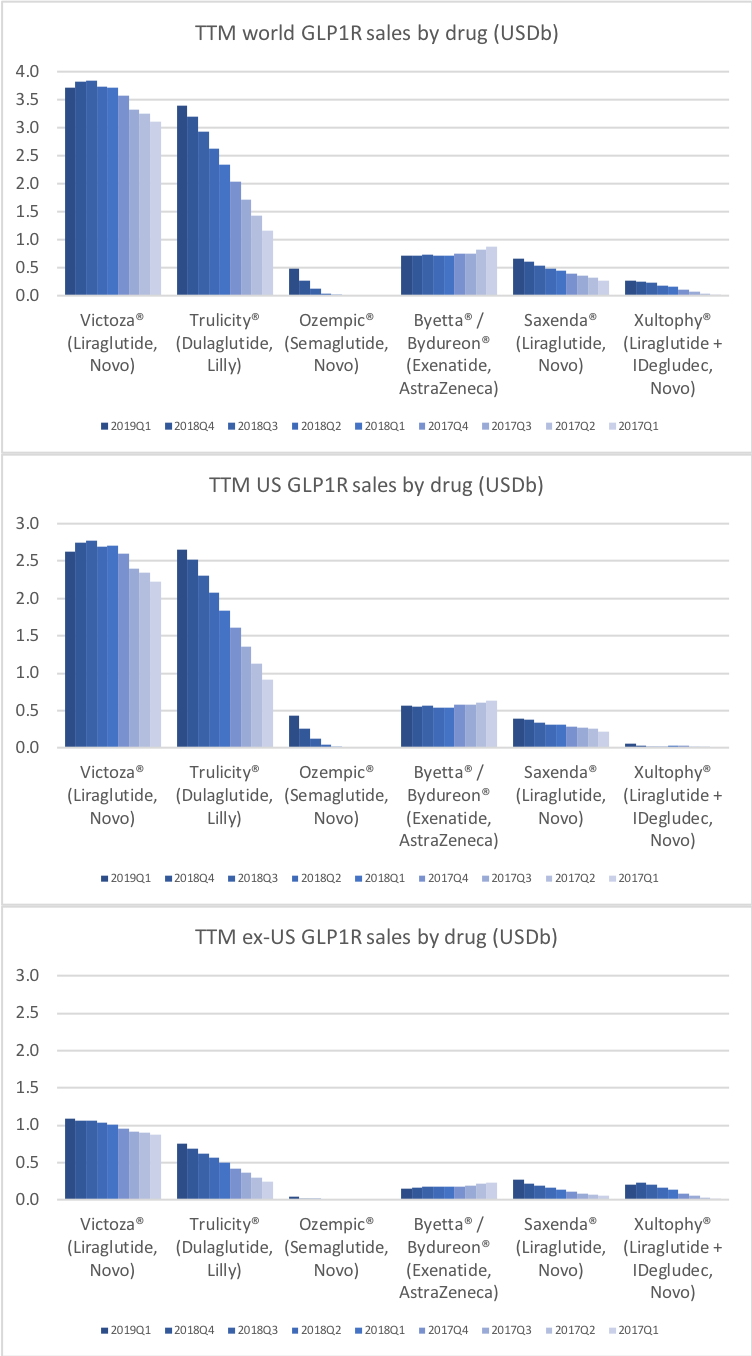
GLP1
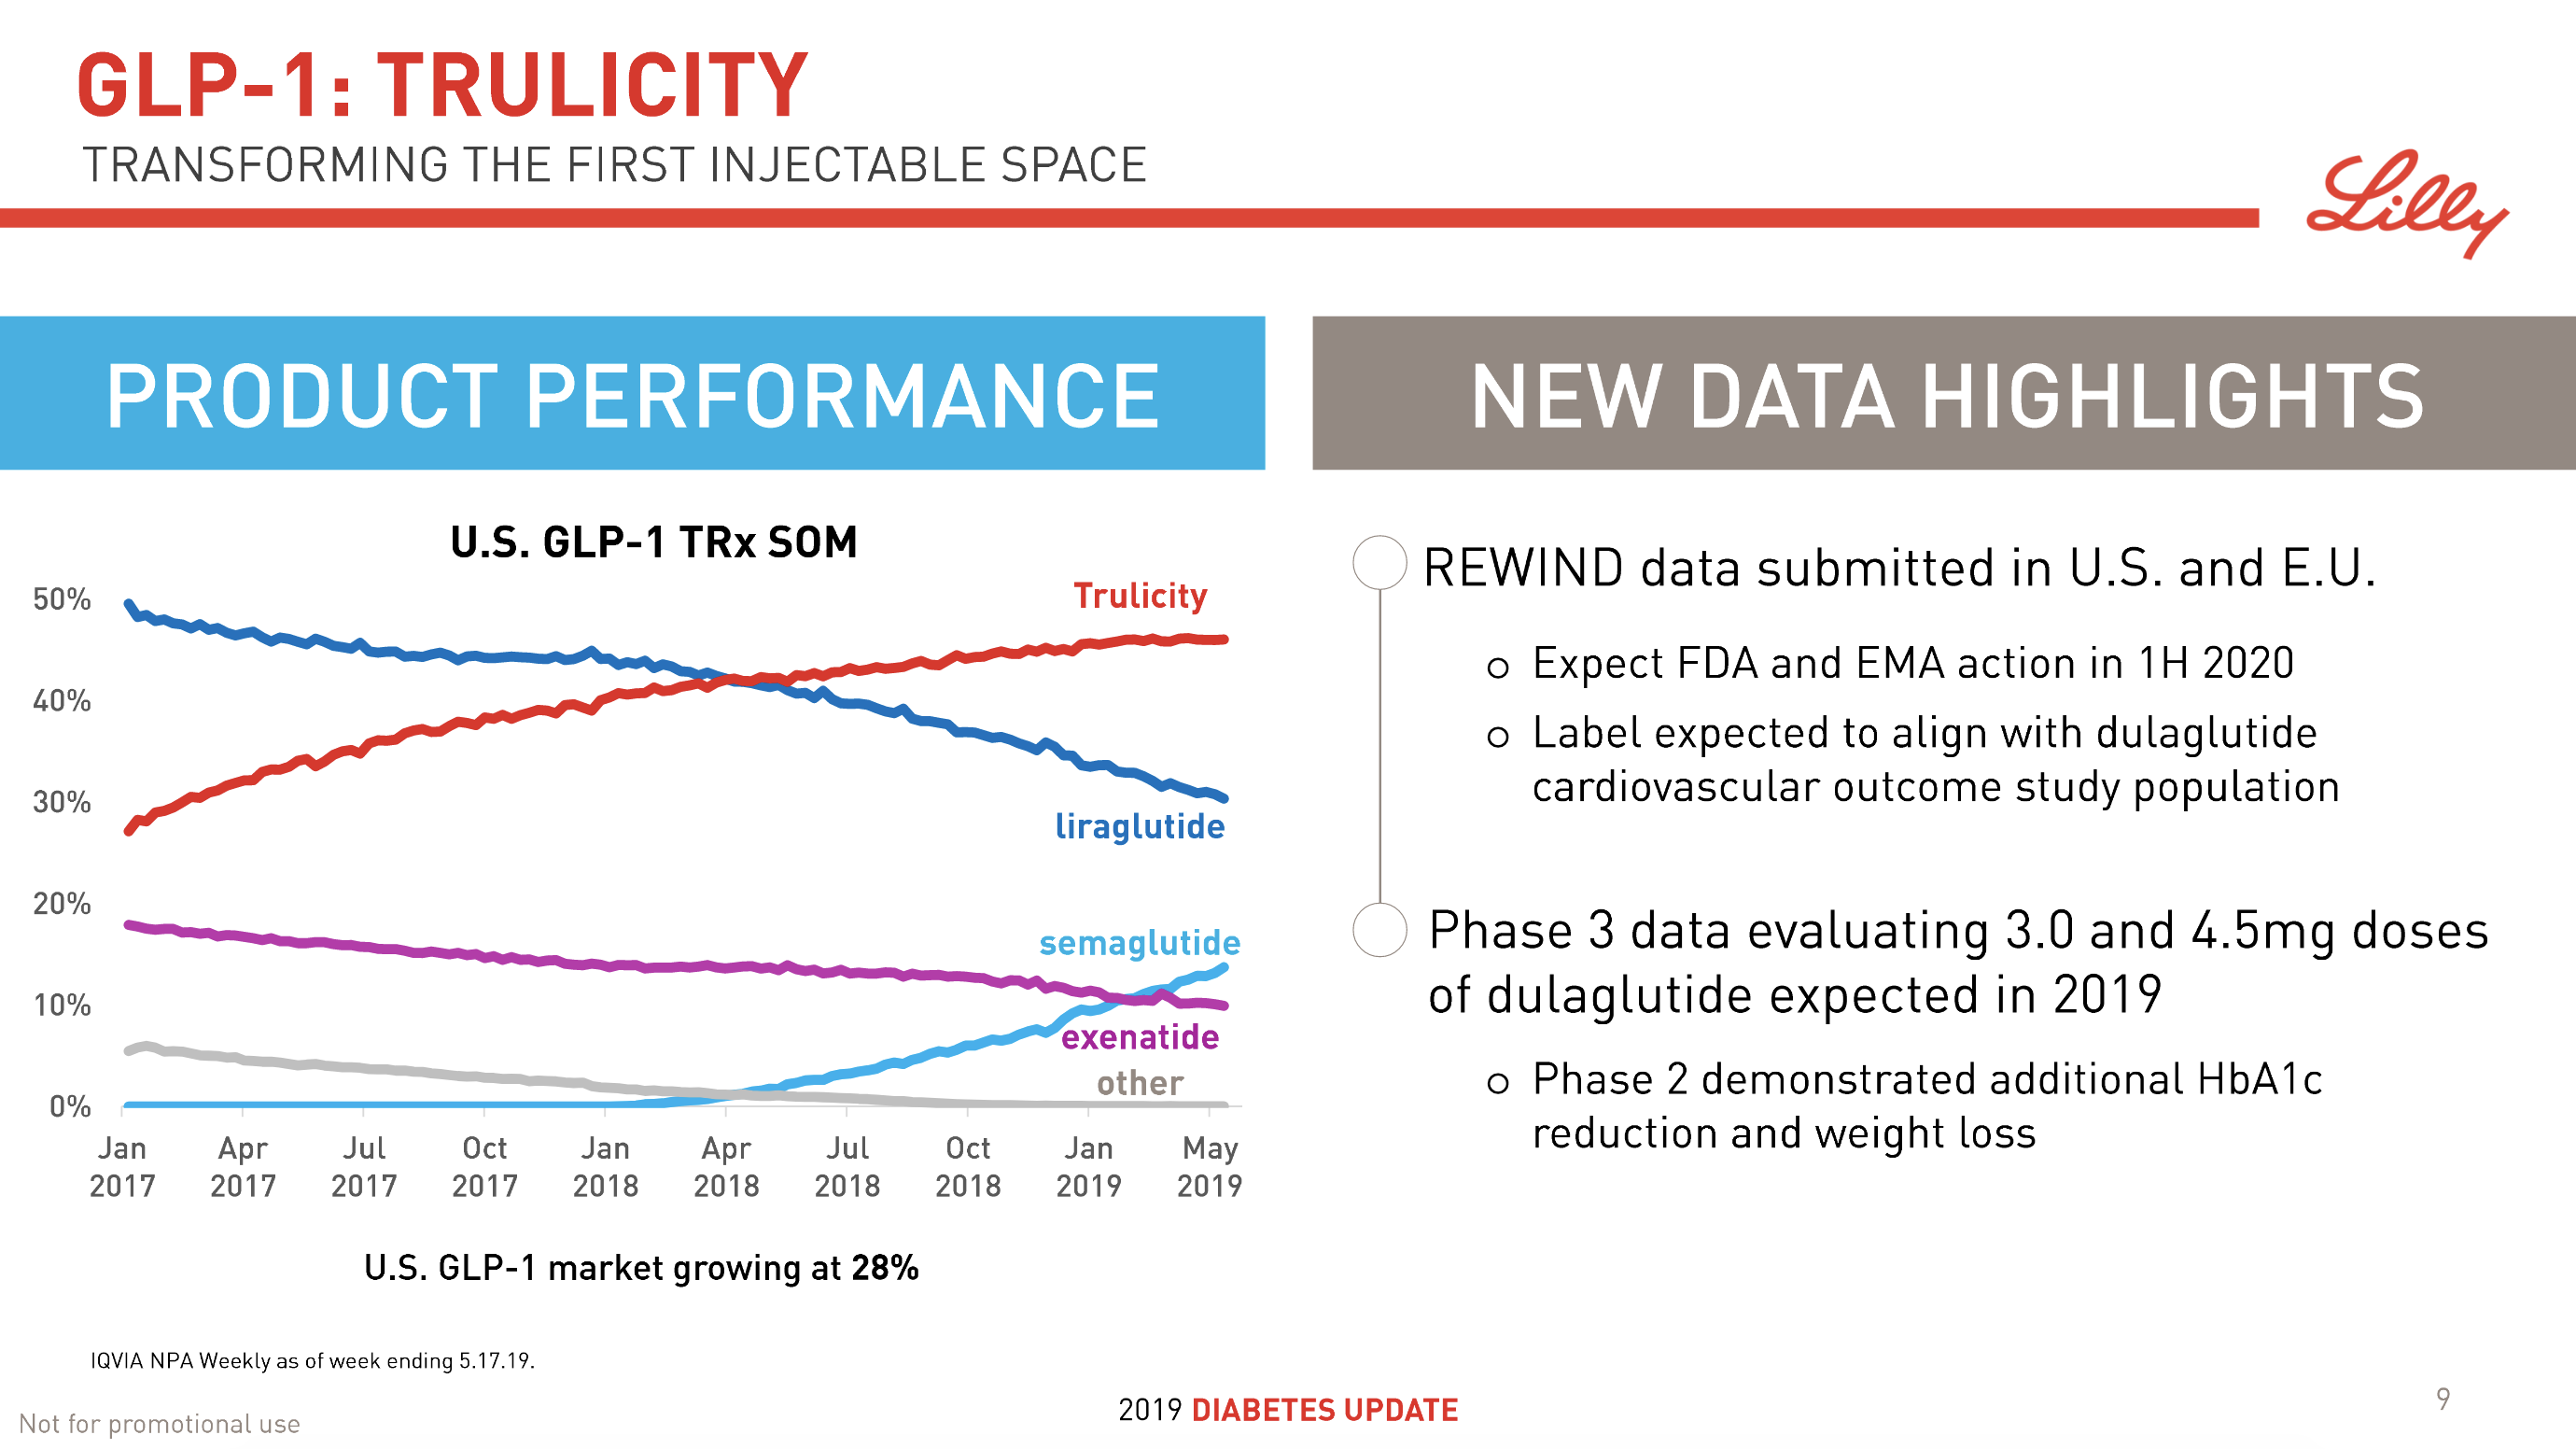
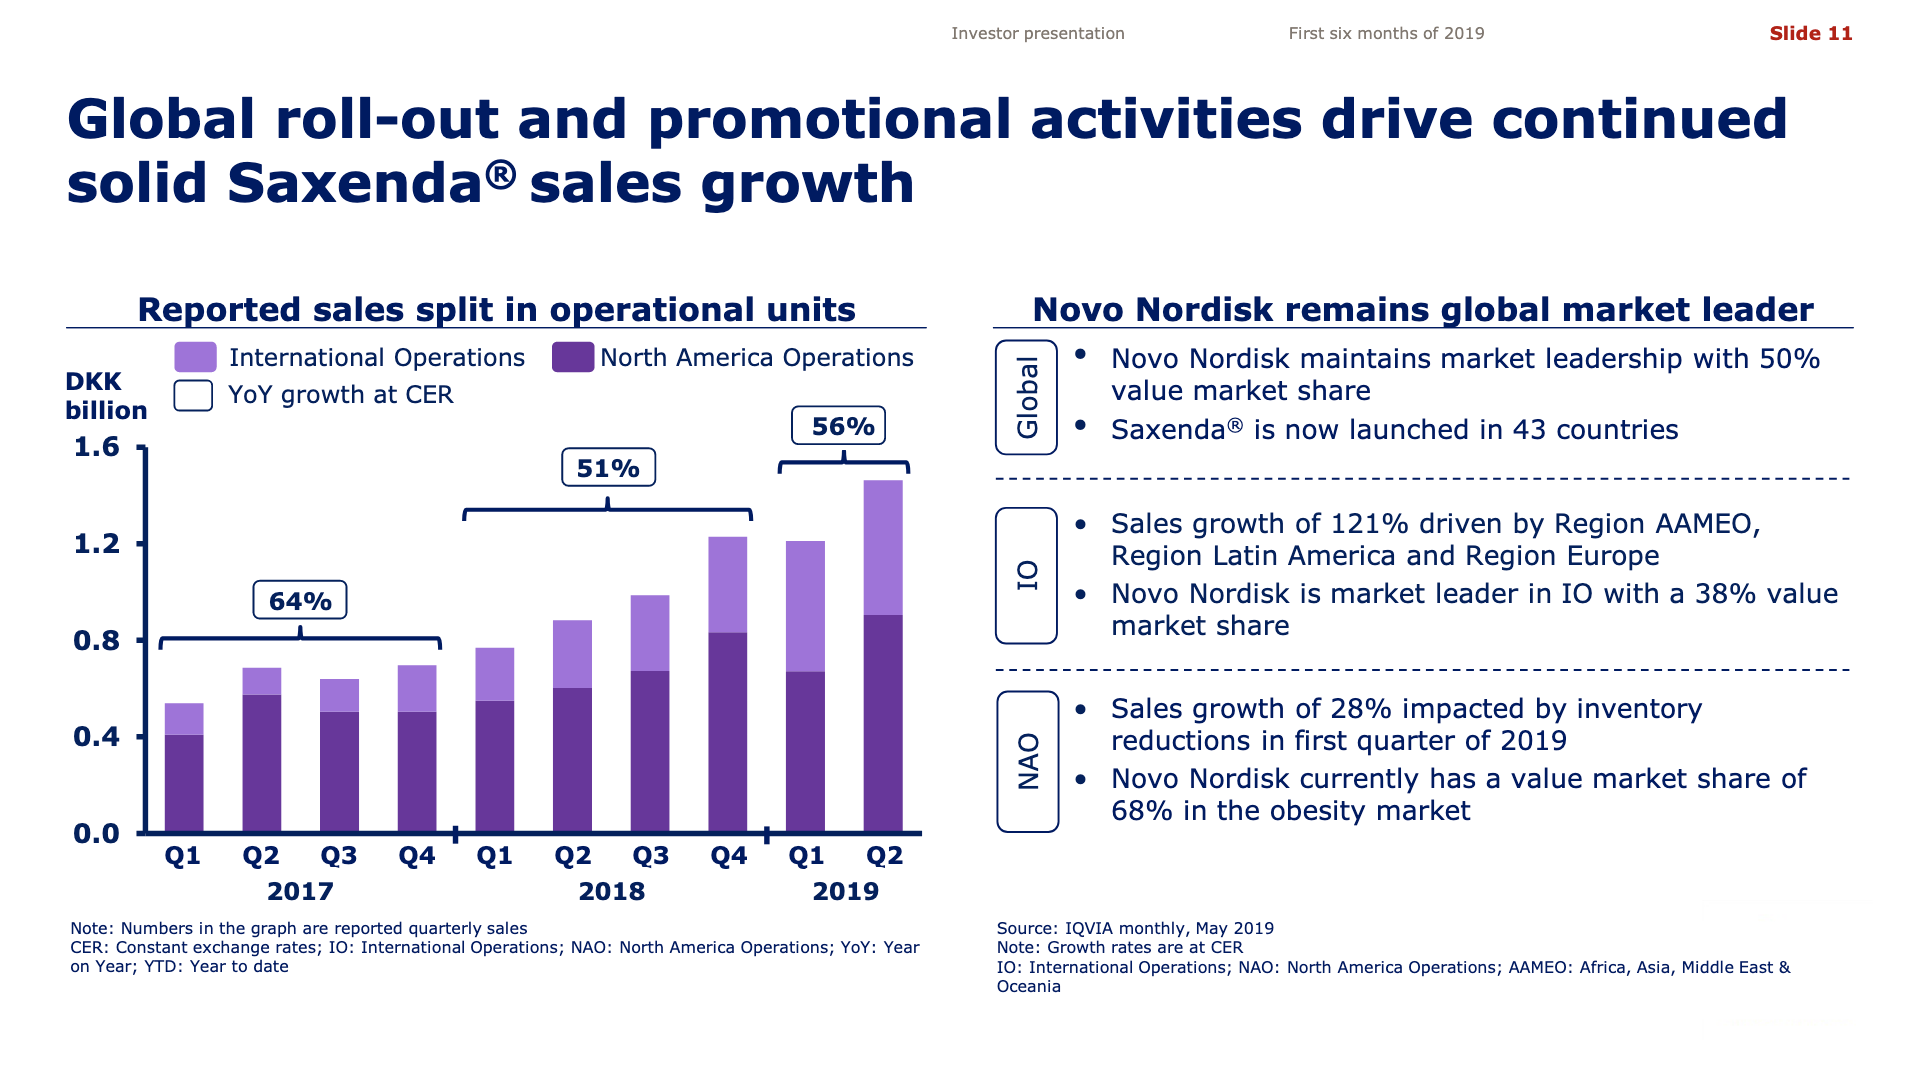
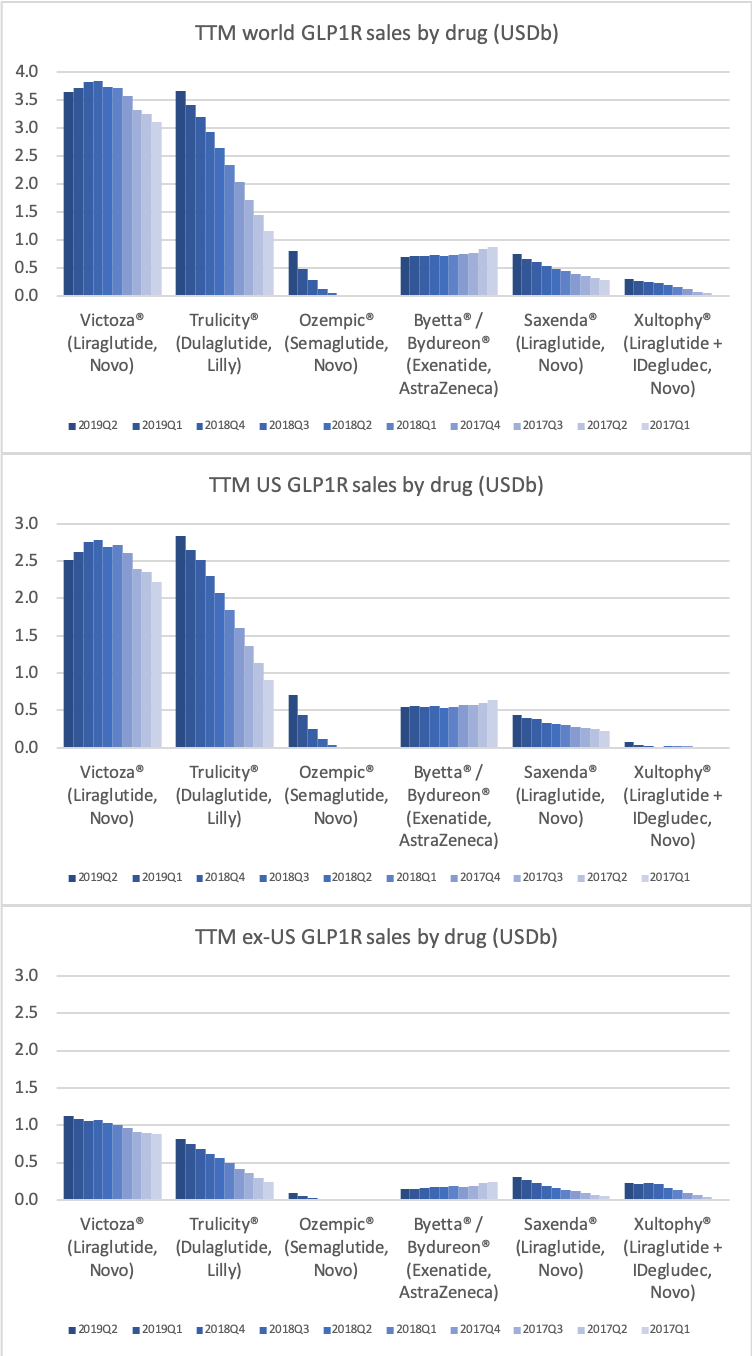
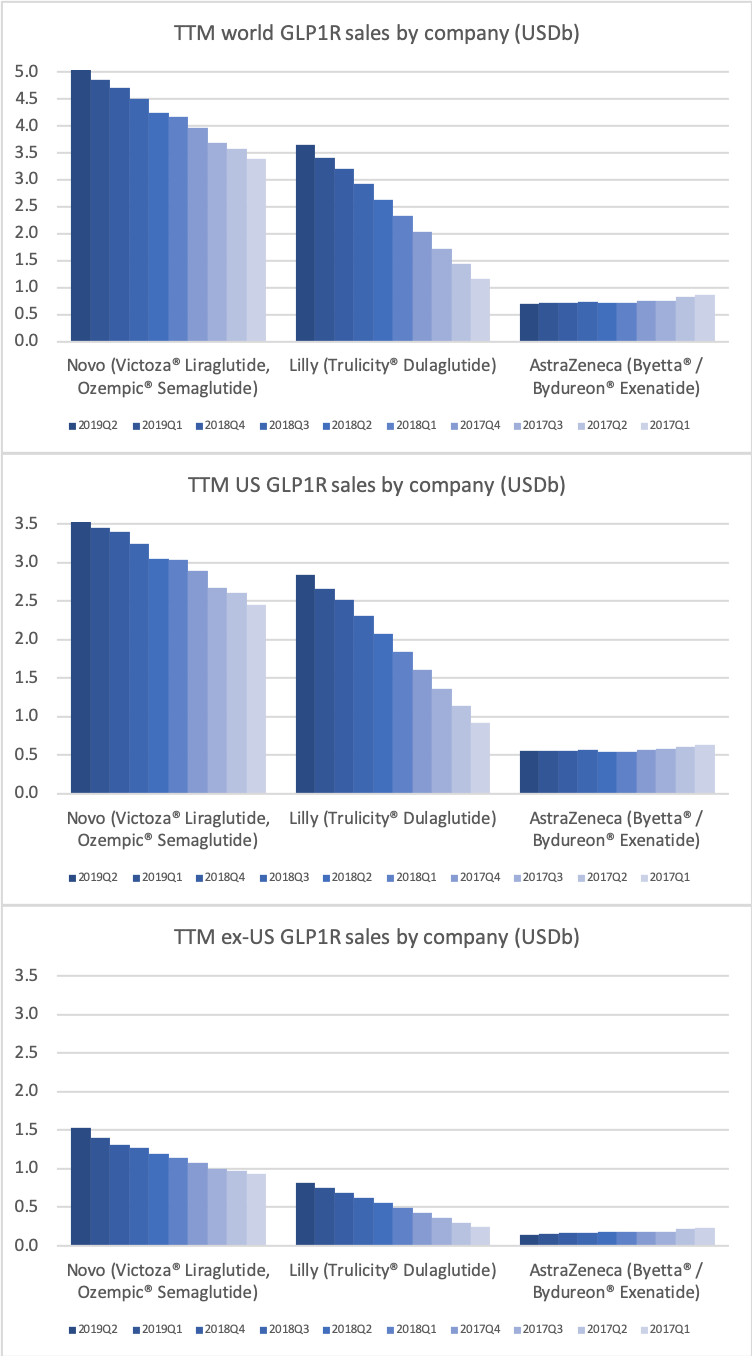
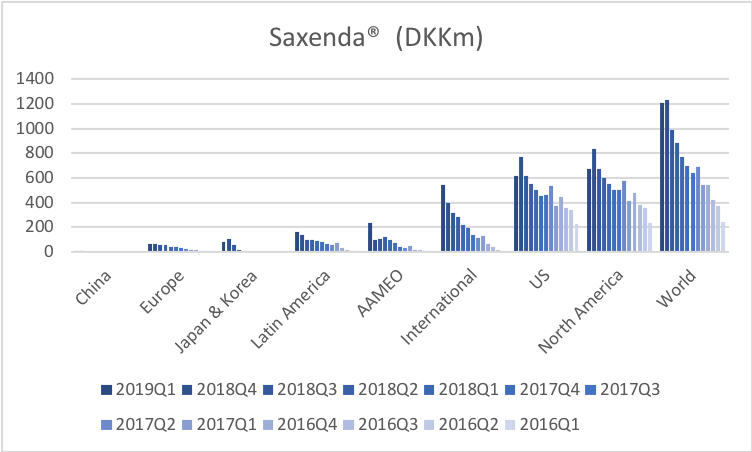
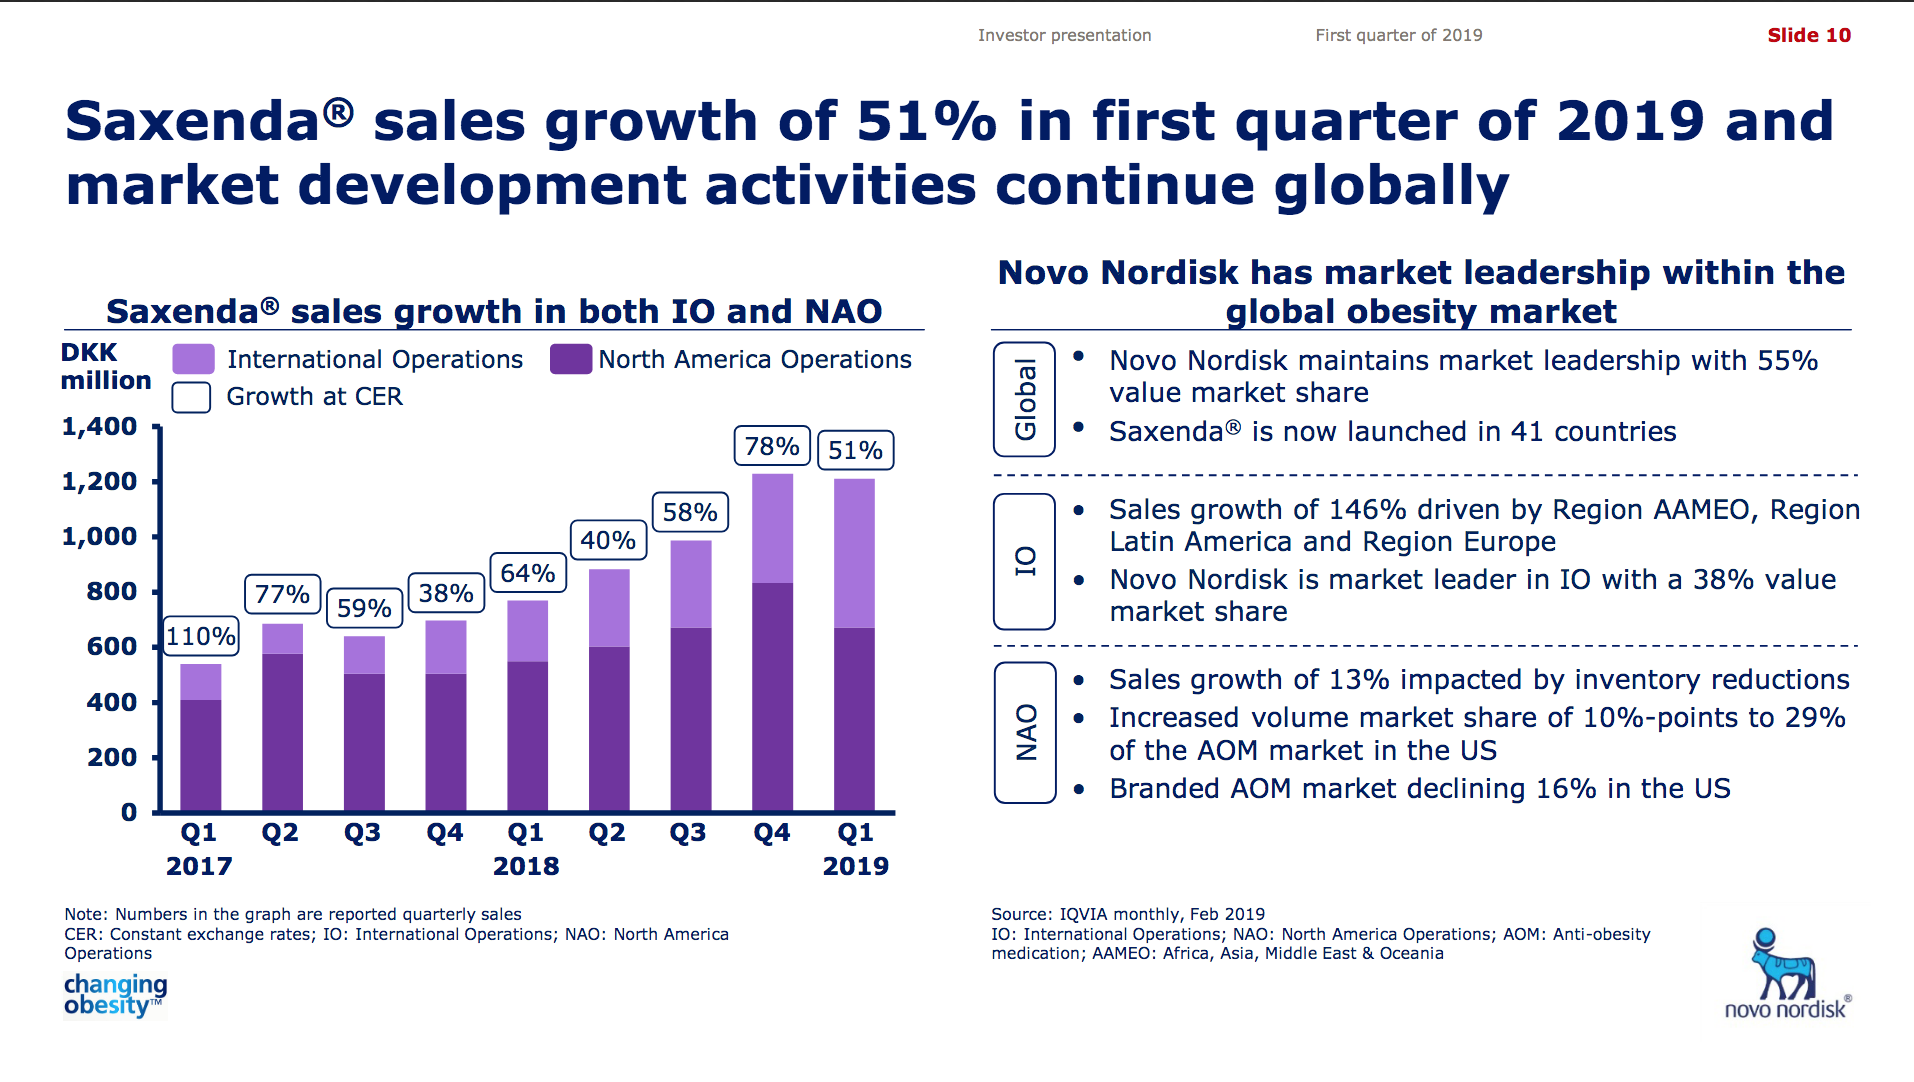
The previous GLP1 bestseller Victoza® is descending from its peak sales, whereas Trulicity® is now the best selling GLP1 drug and Ozempic® the fastest growing. Interestingly semaglutide against obesity (Saxenda®) is turning into a blockbuster drug for Novo Nordisk. The GLP1 sale at Novo Nordisk could further accelerate, if oral semaglutide is approved by the FDA on 20th of September. Other noteworthy GLP1 news are summarised below. One of them regarding benefits of the phase III dual agonist tirzepatide from Eli Lilly. Another regarding the filing of oral semaglutide for FDA approval six months ago.
26Jun Lilly’s AWARD-11 trial studying higher investigational doses of Trulicity® (dulaglutide) demonstrated superiority in A1C reduction in people with type 2 diabetes
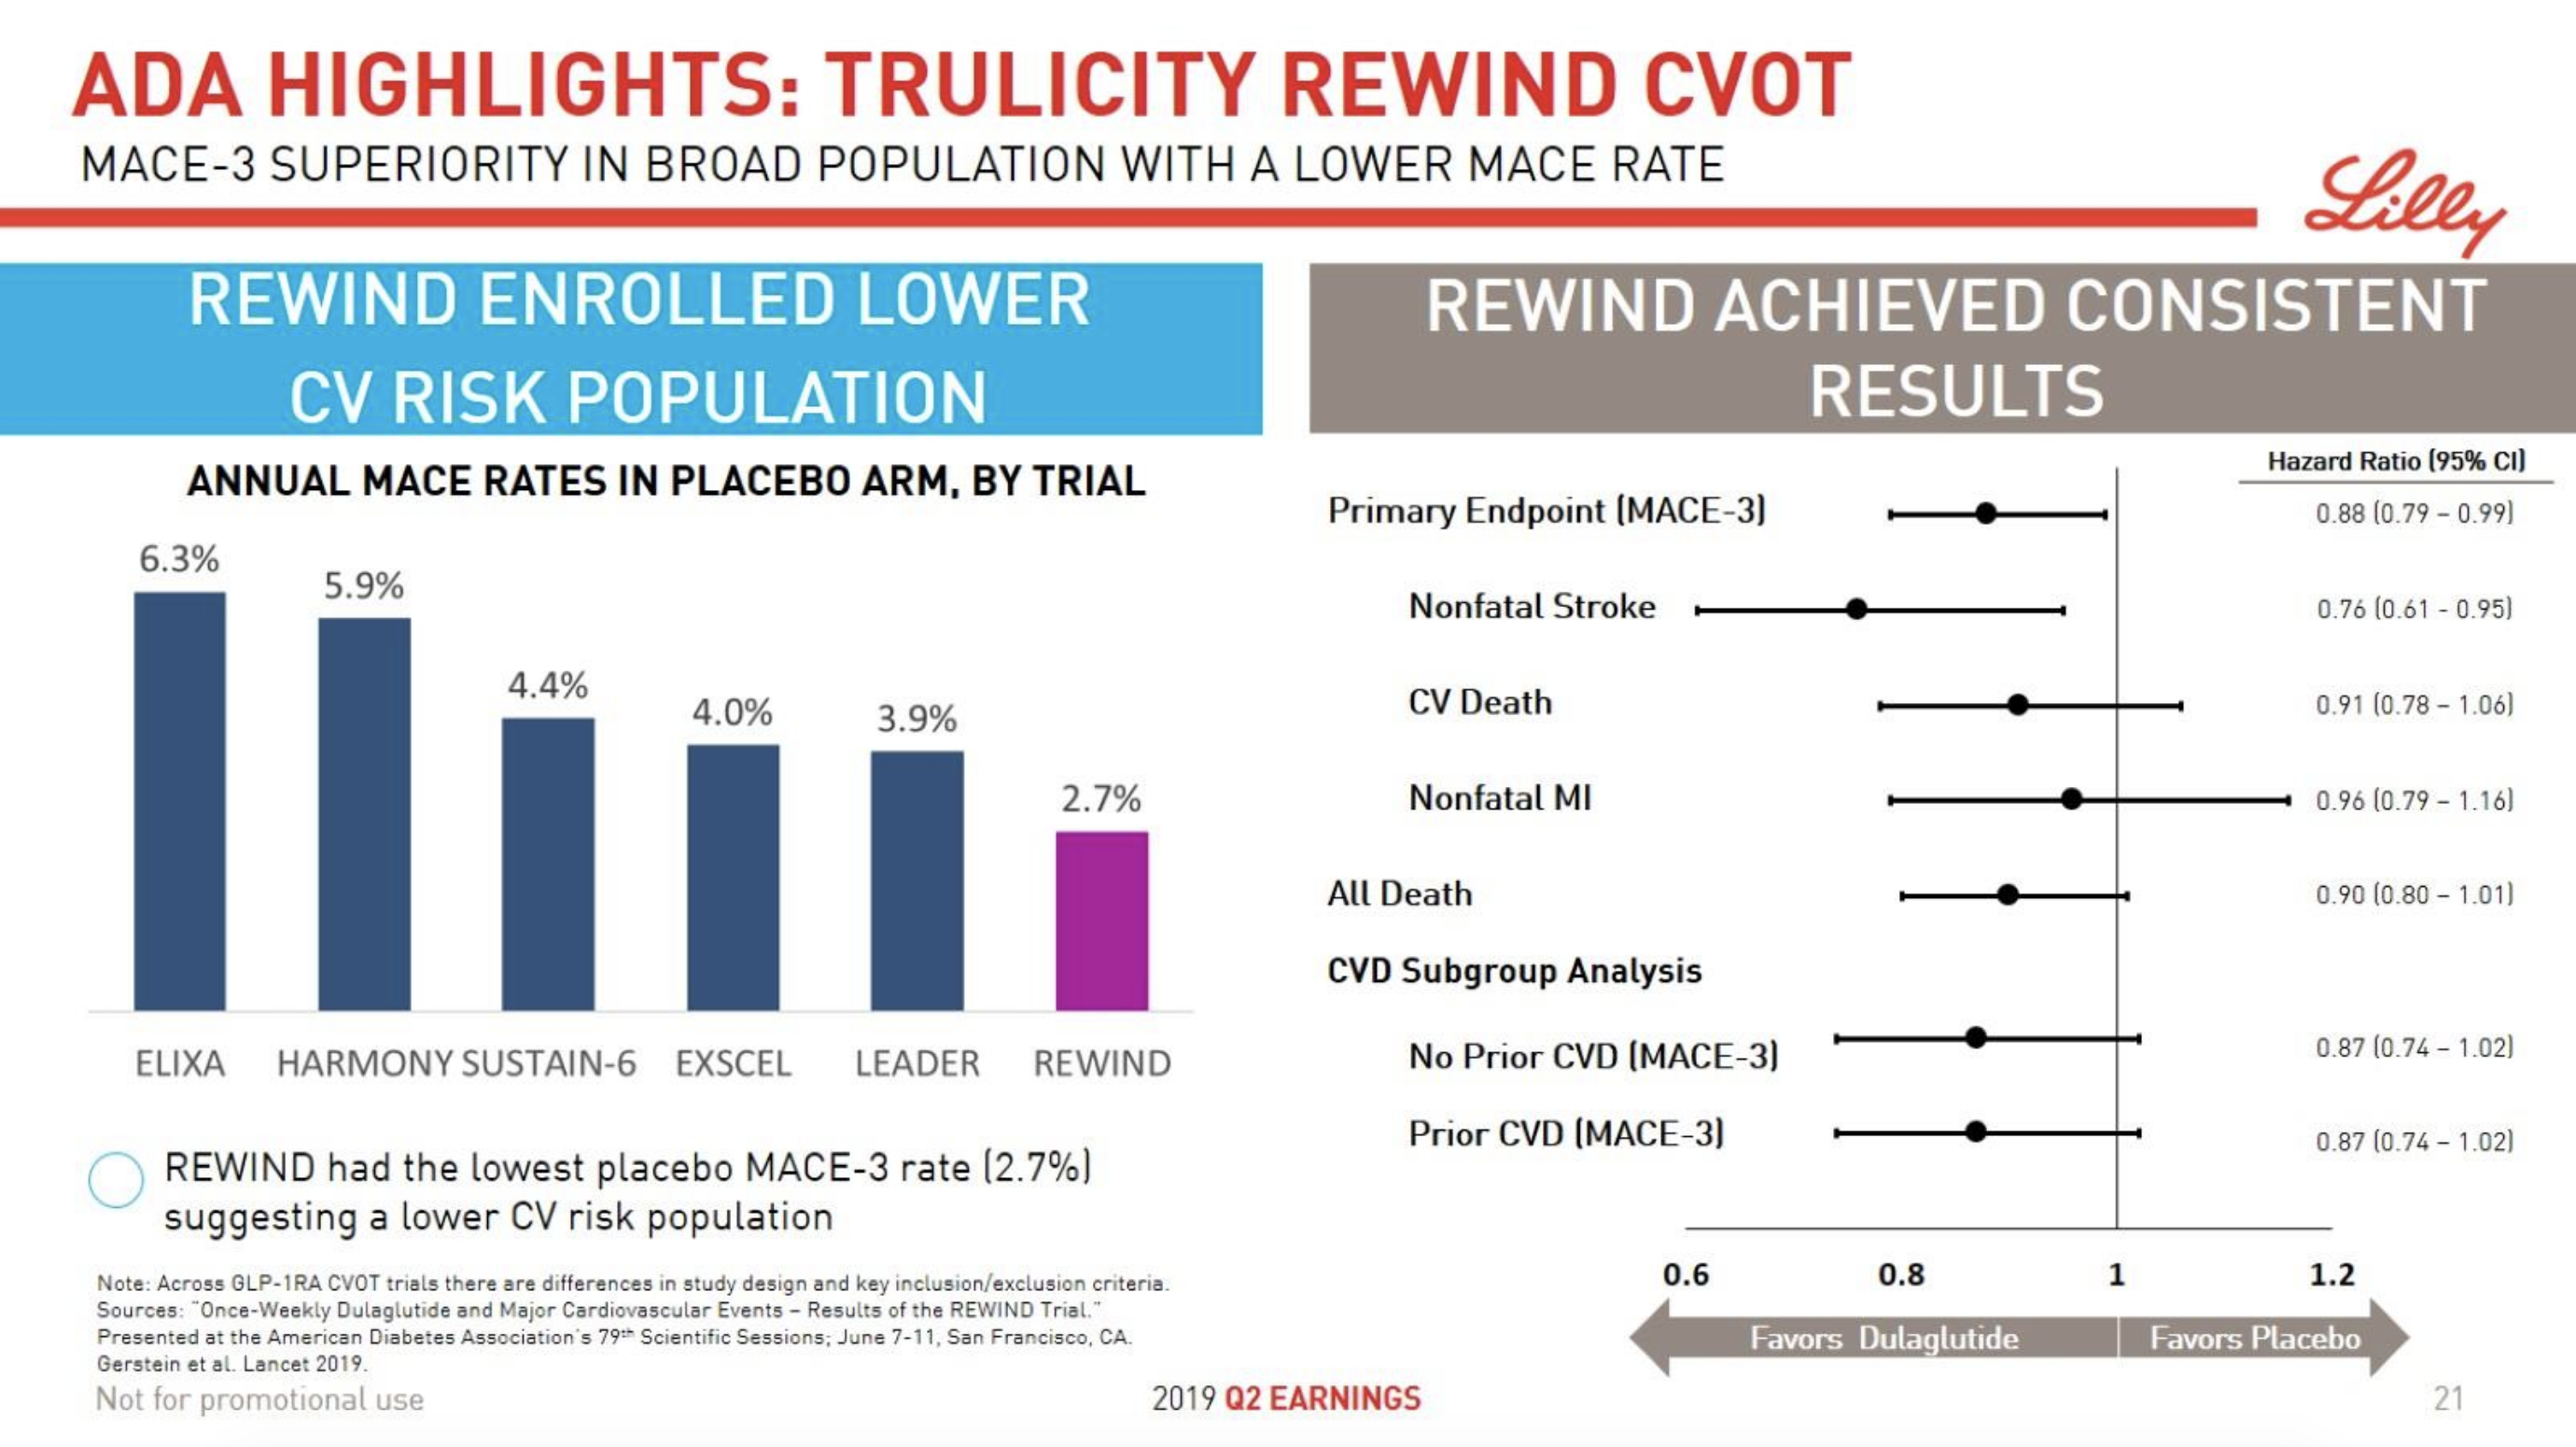
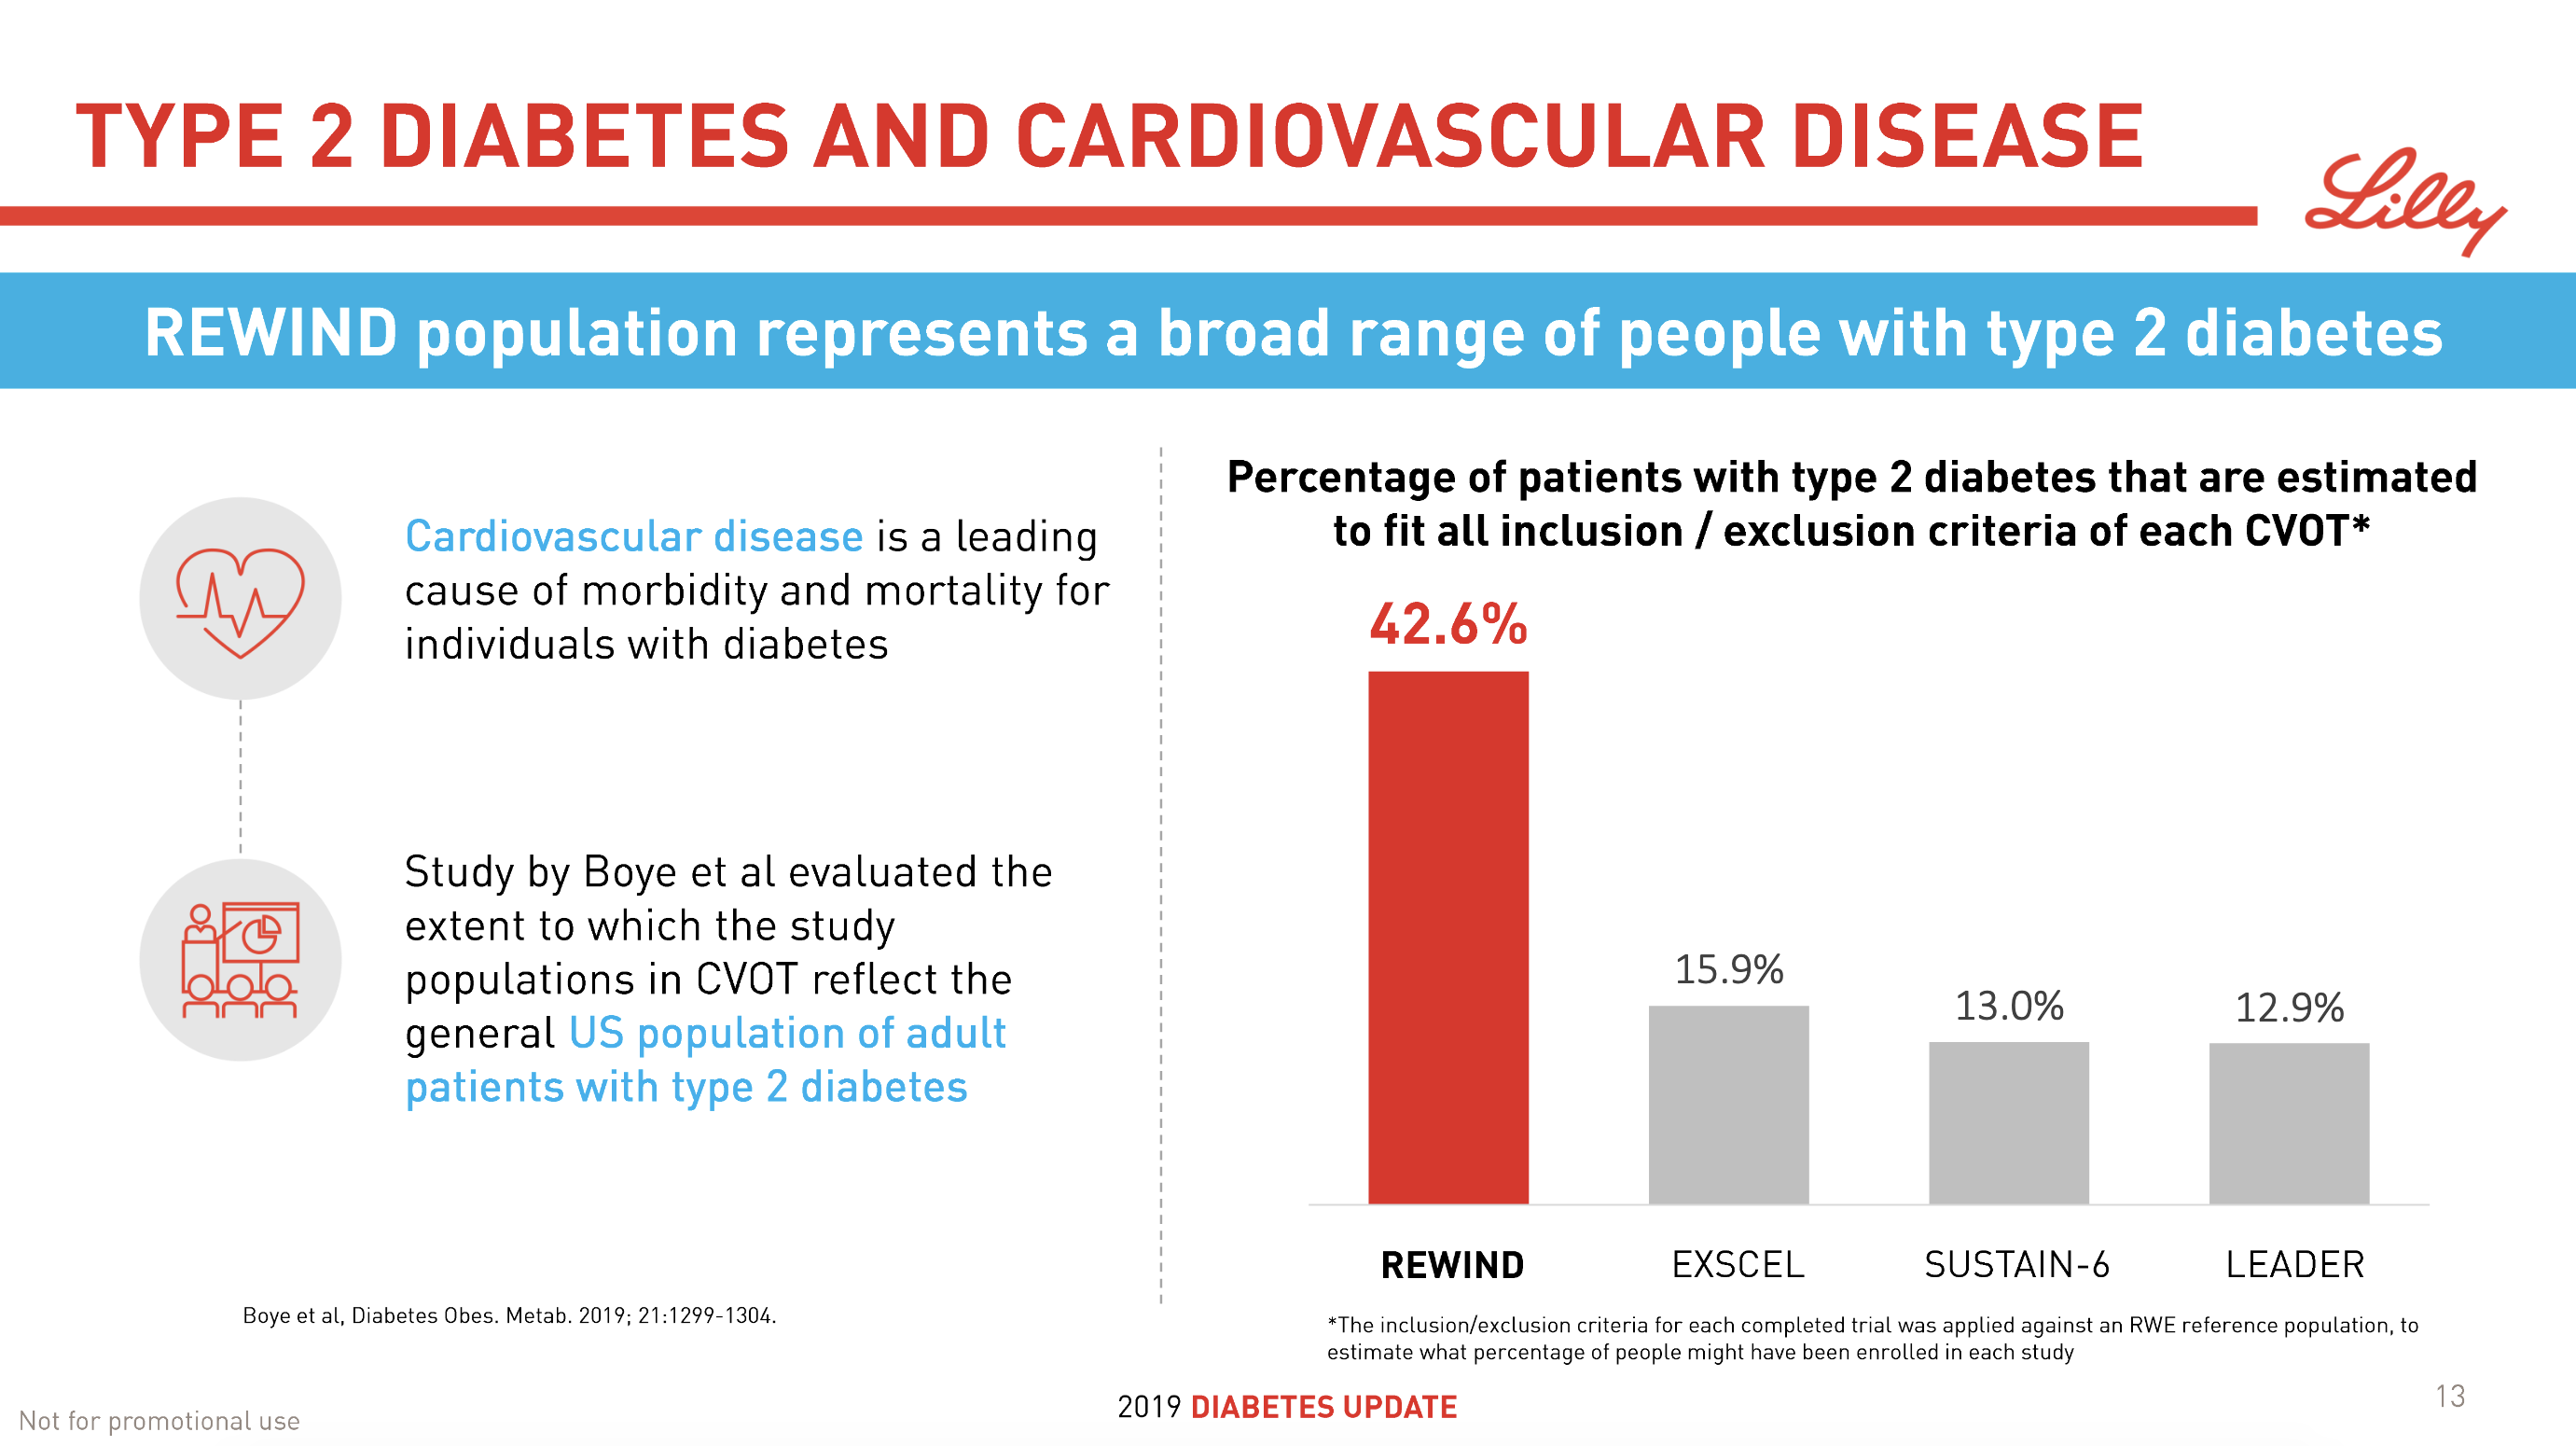
09JunTrulicity® (dulaglutide) significantly reduced major cardiovascular events for broad range of people with type 2 diabetes
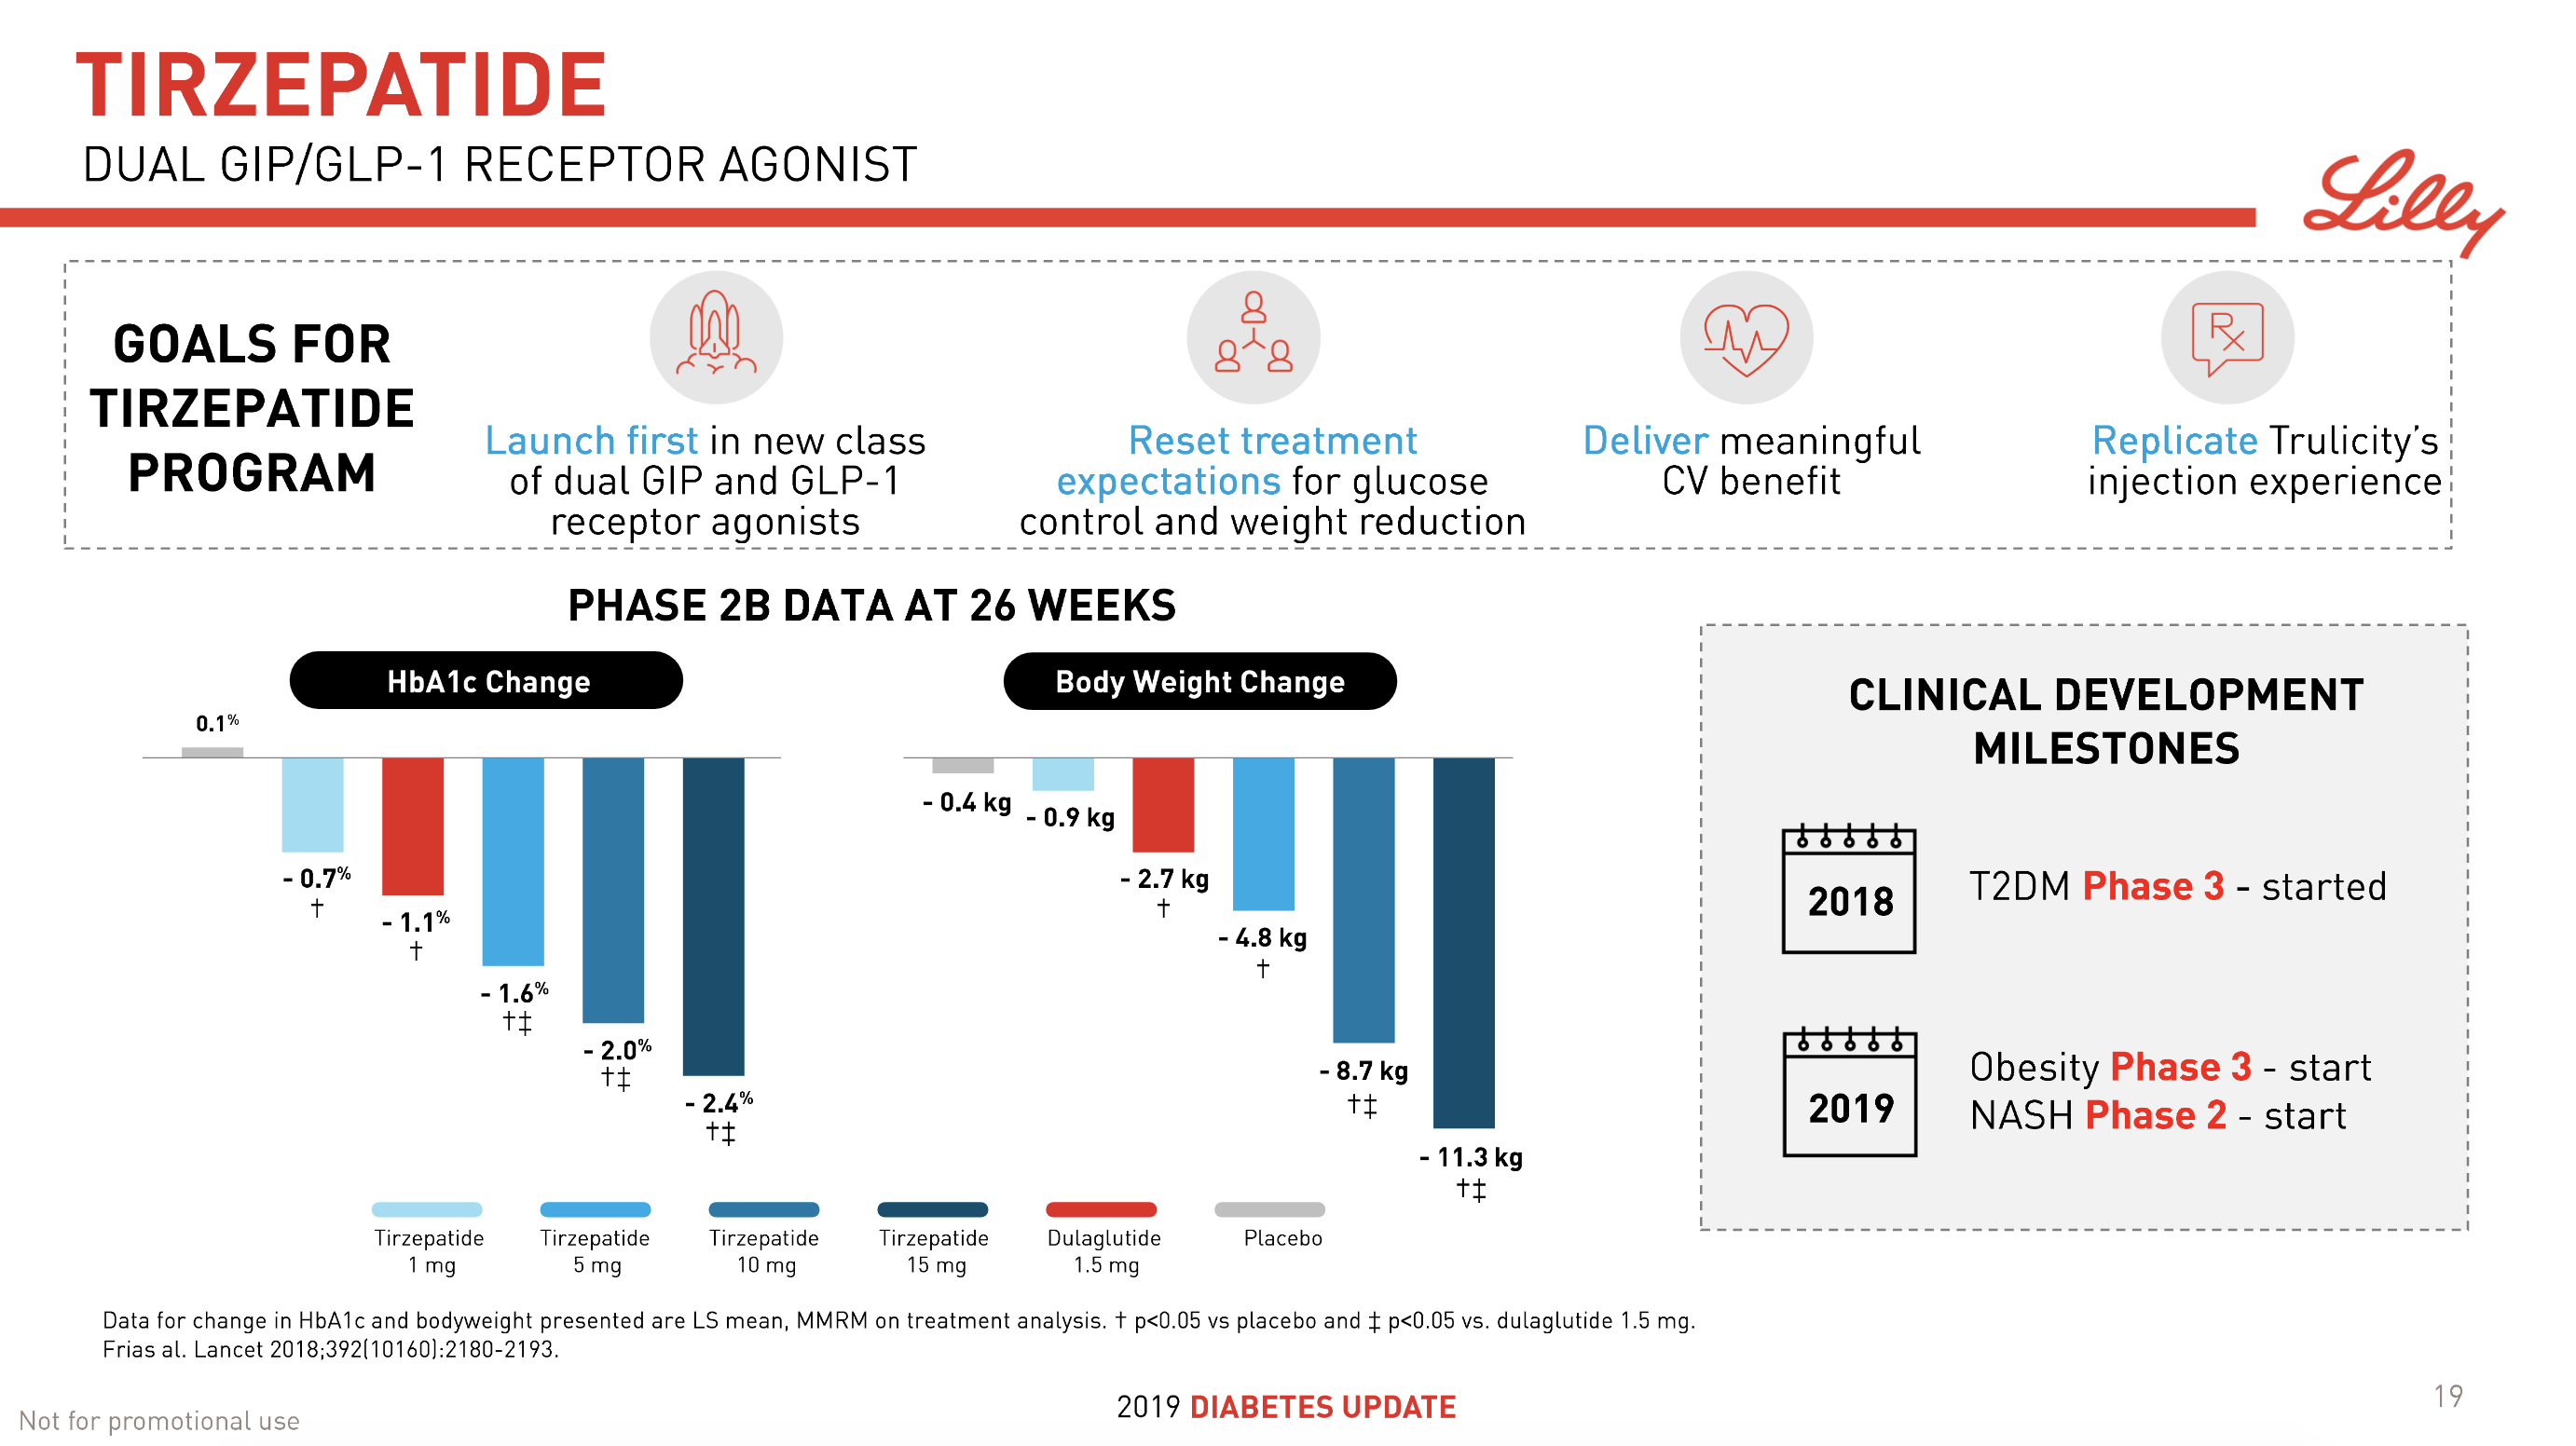
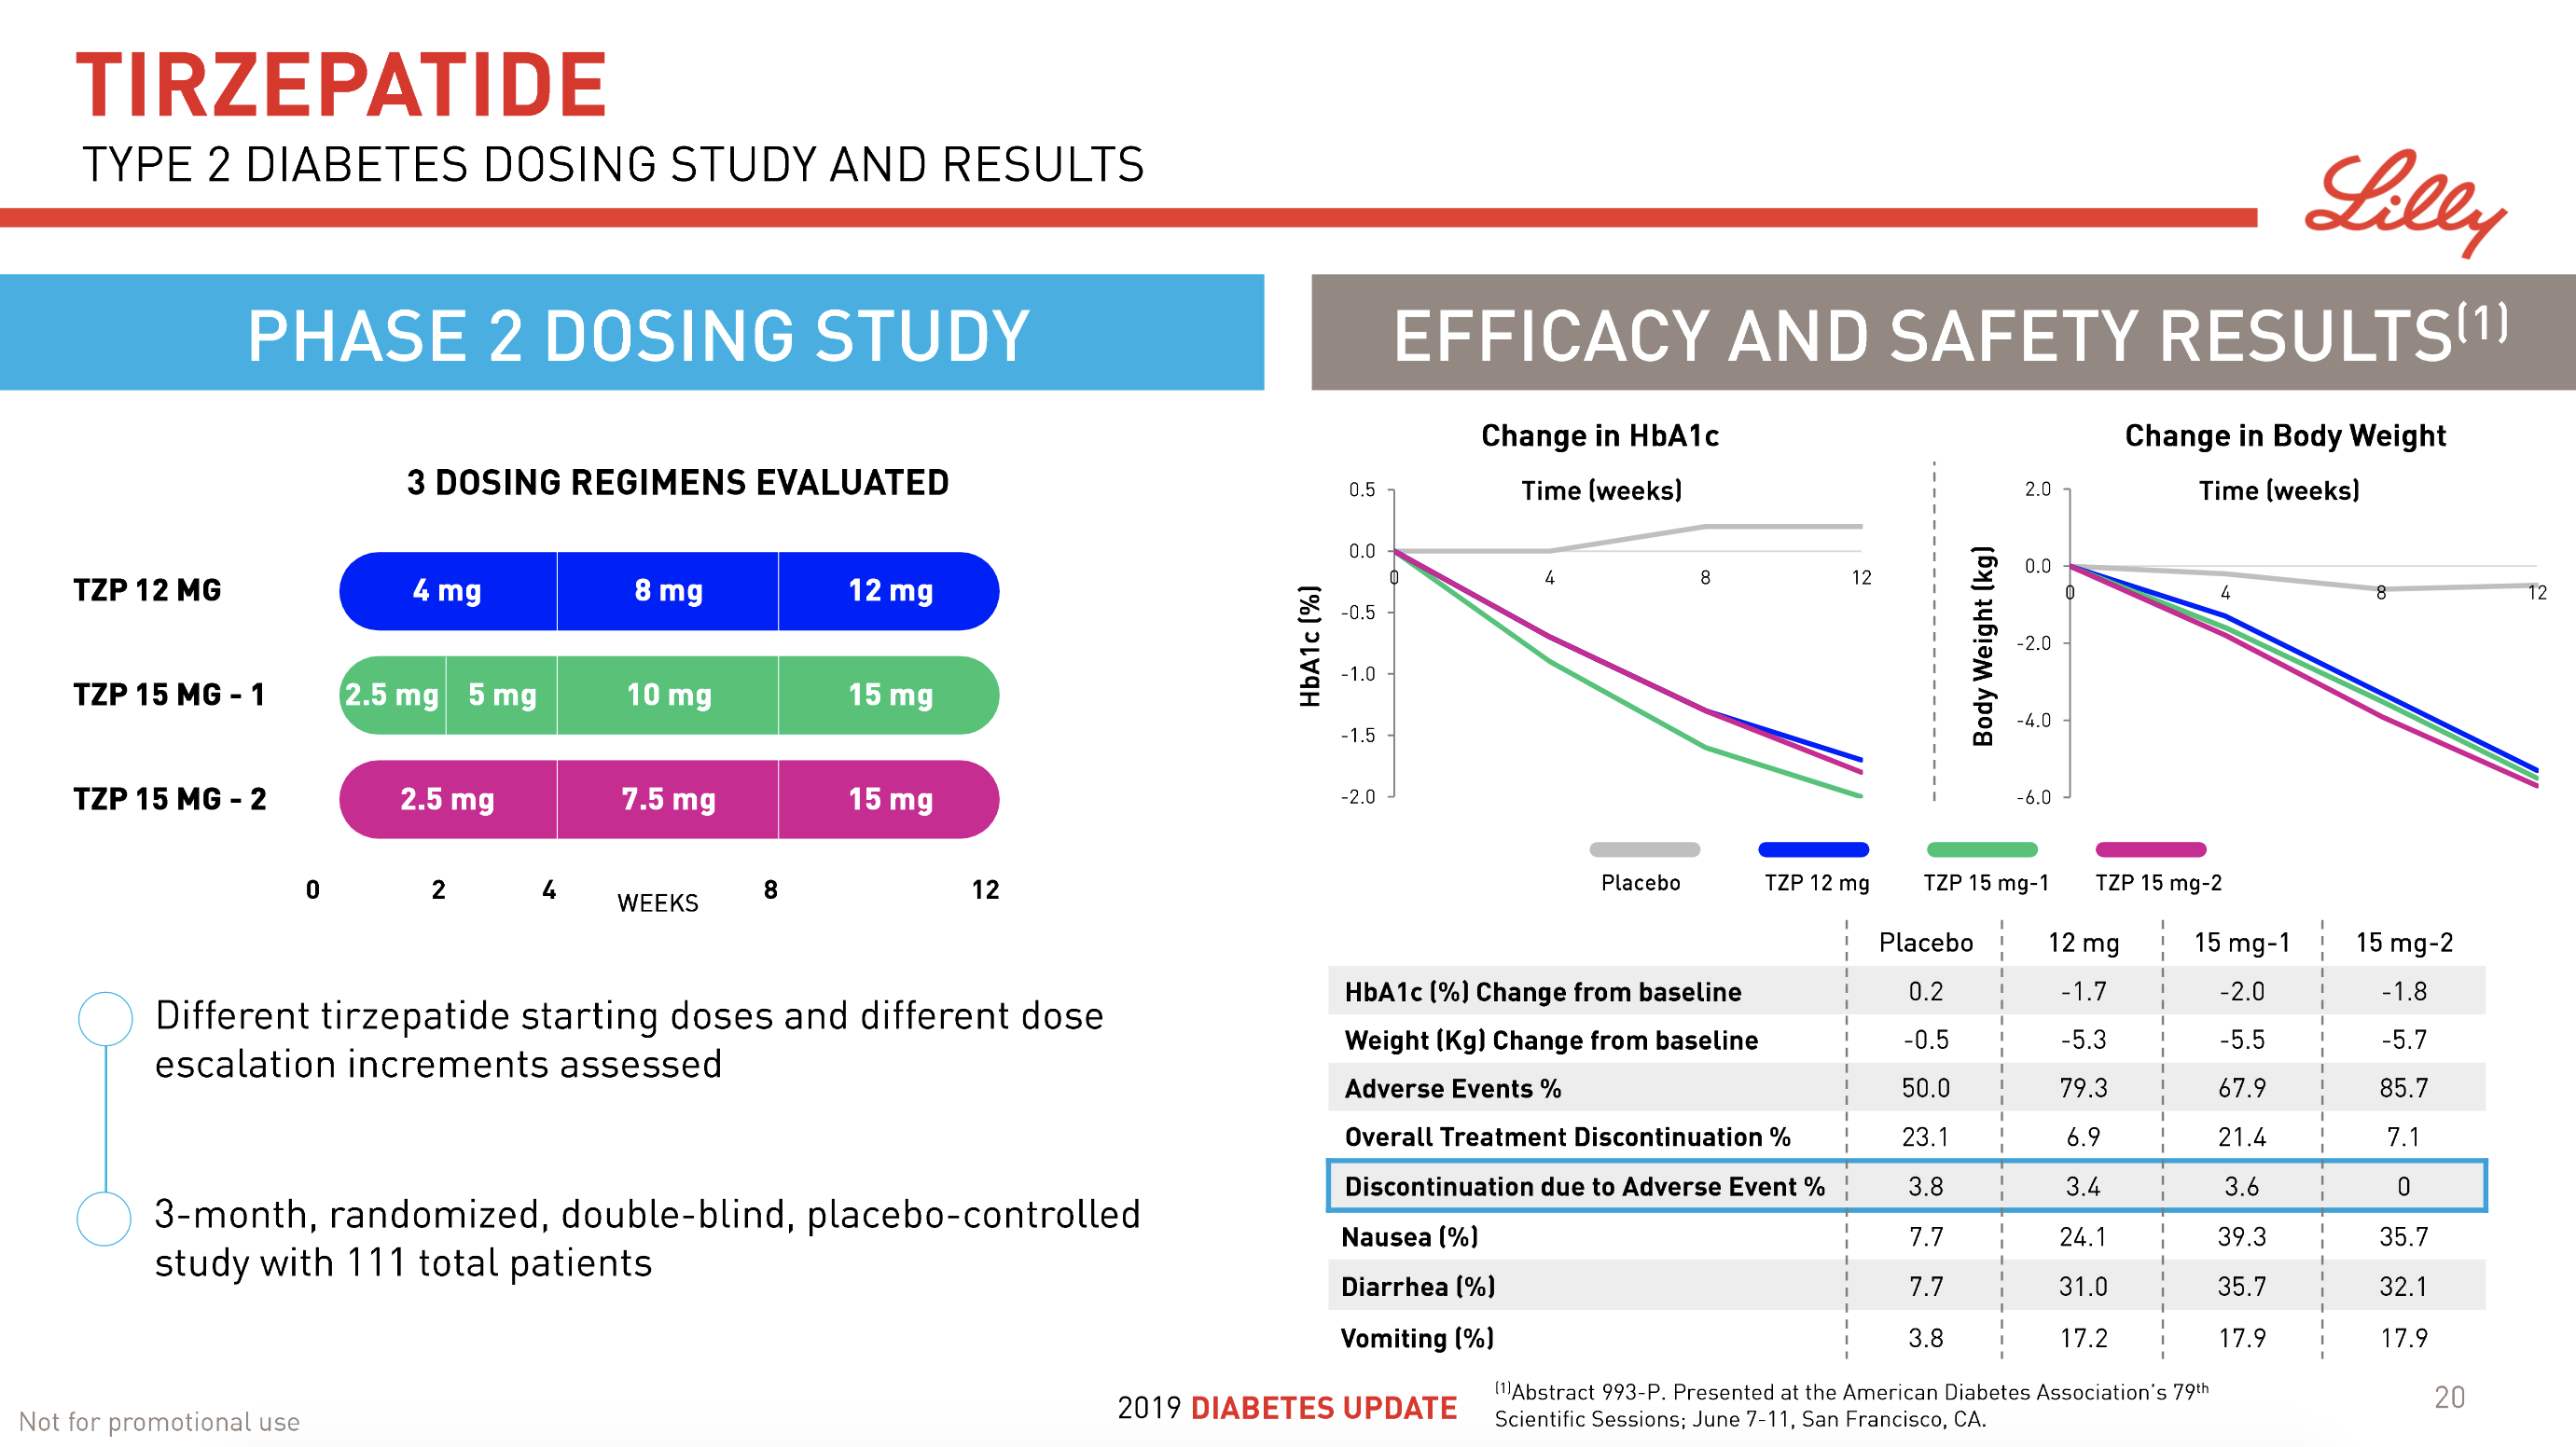
08Jun Lilly’s tirzepatide demonstrates benefits in data presented at the American Diabetes Association’s® 79ᵗʰ Scientific Sessions®
20Mar Novo Nordisk files oral semaglutide for US regulatory approval of glycaemic control, as well as for CV risk reduction for oral semaglutide and Ozempic®
Insulin
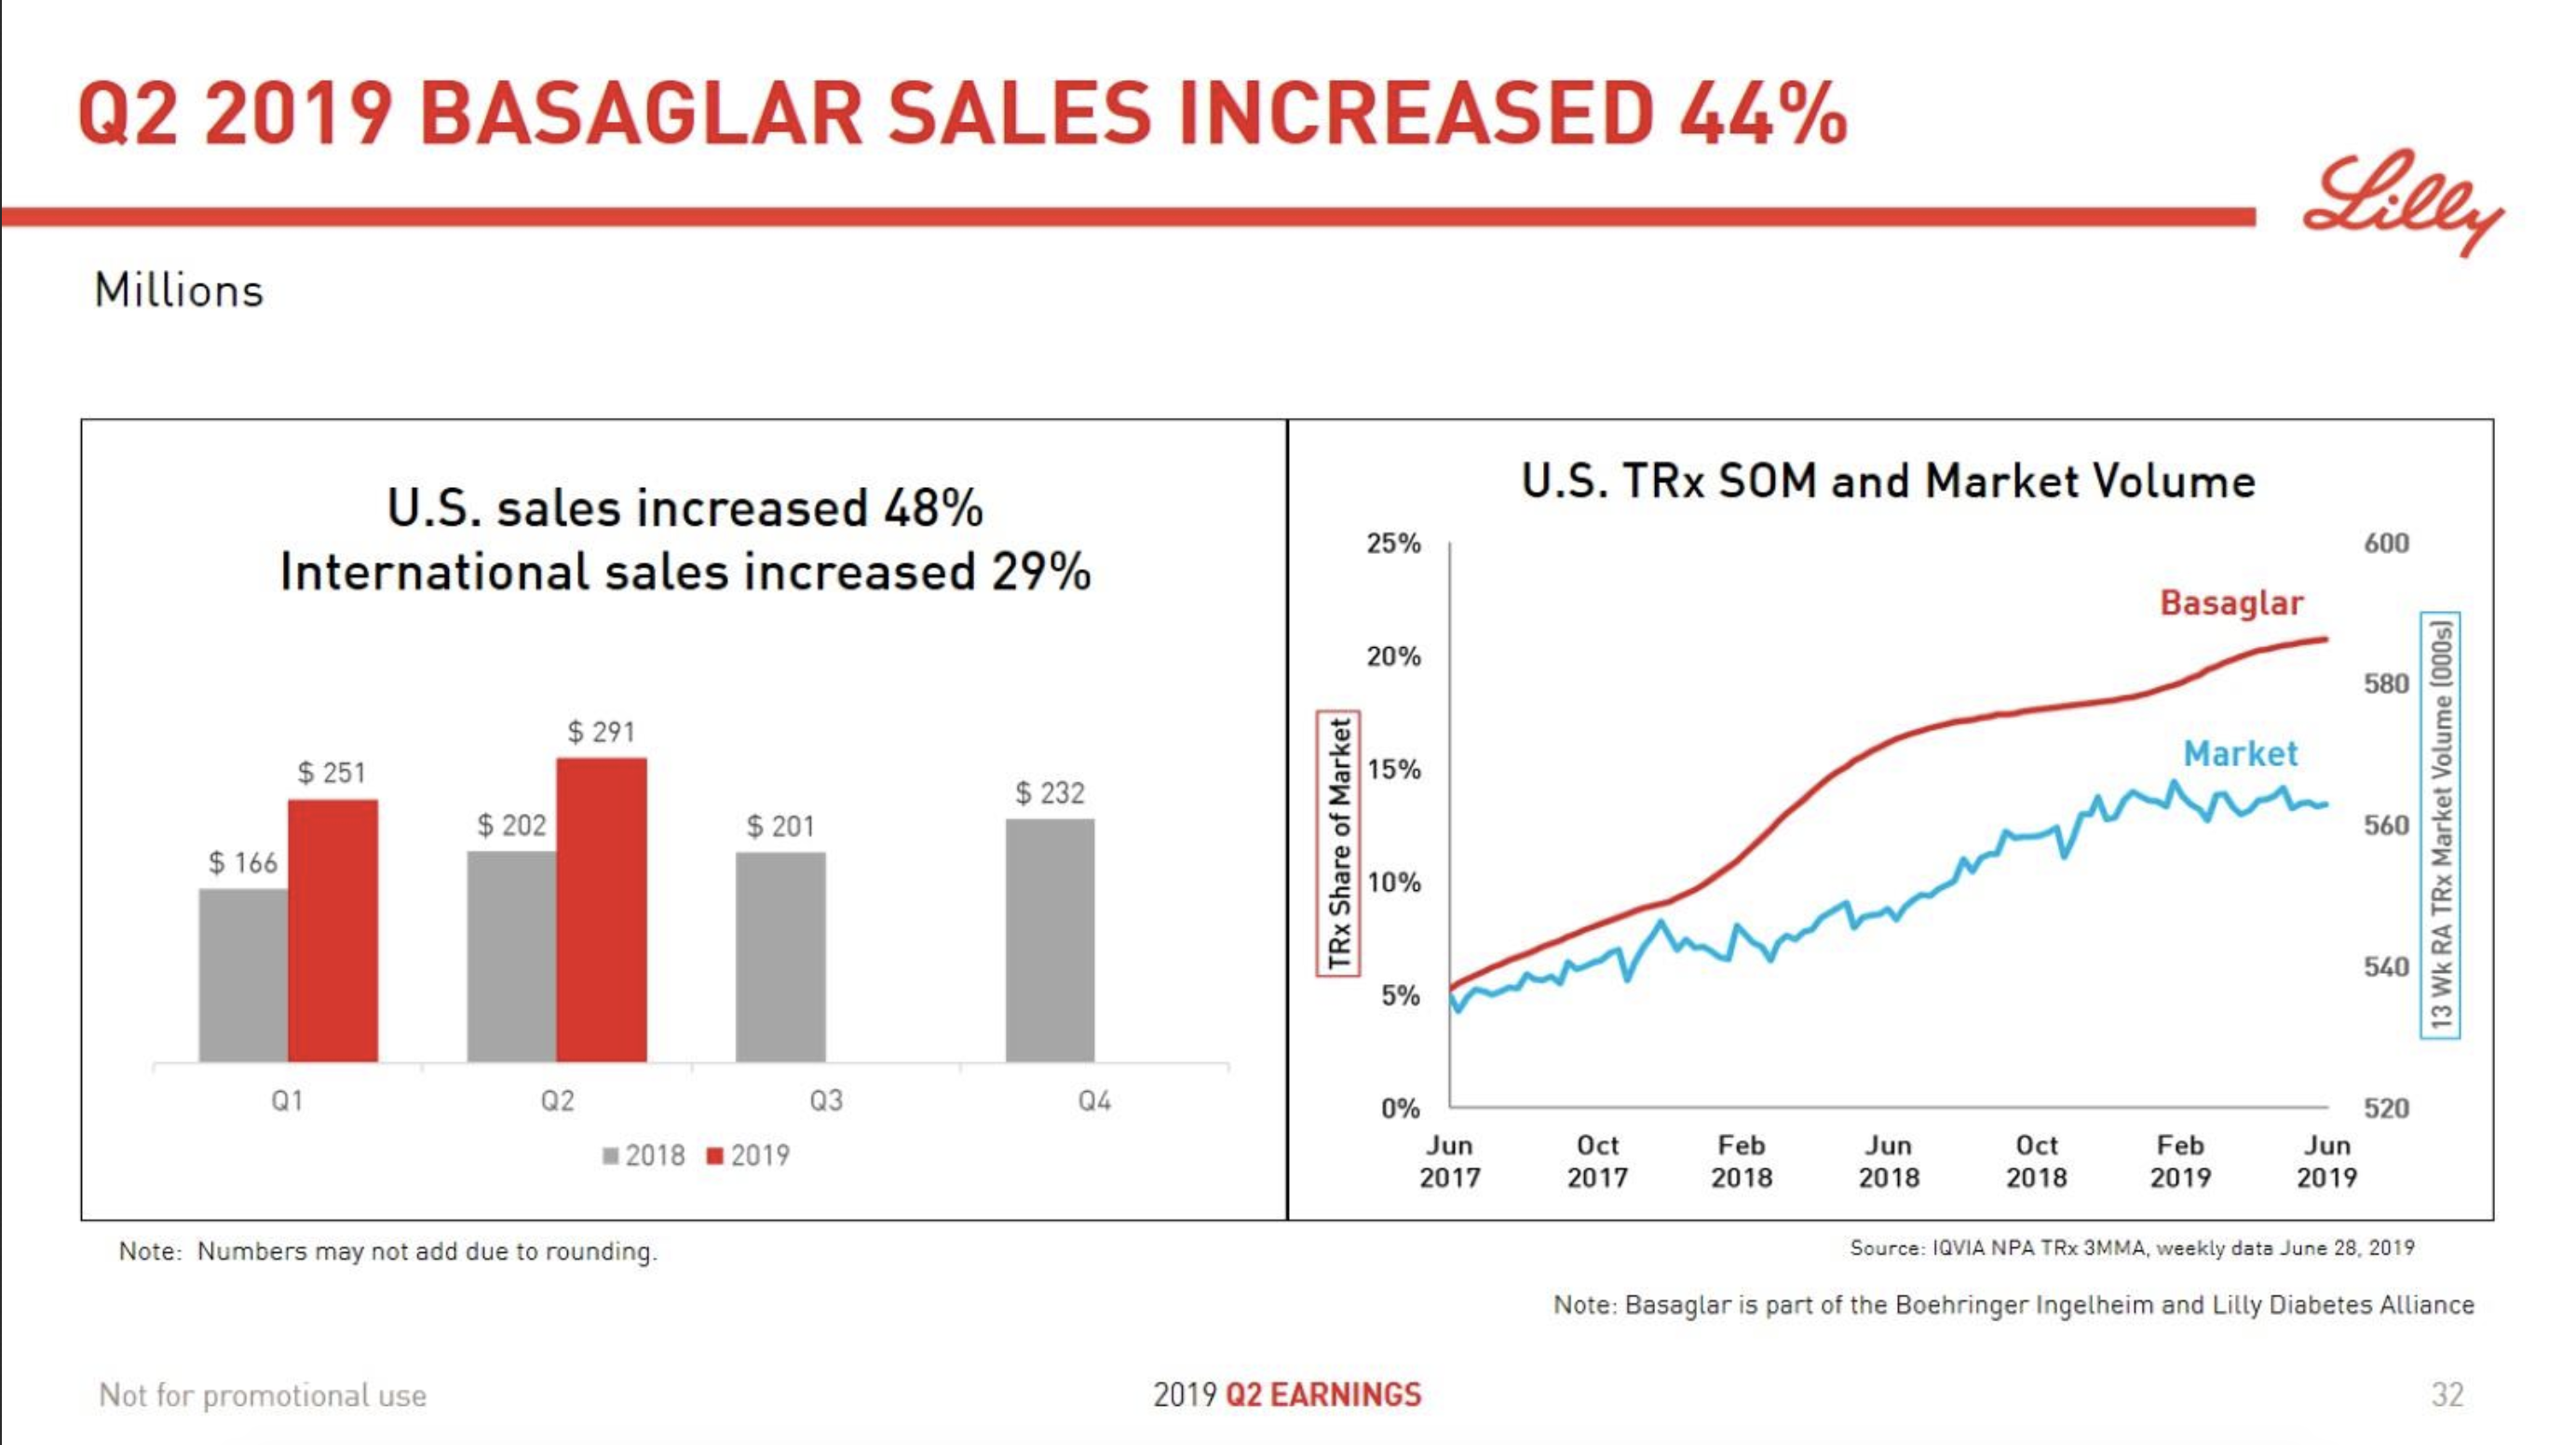
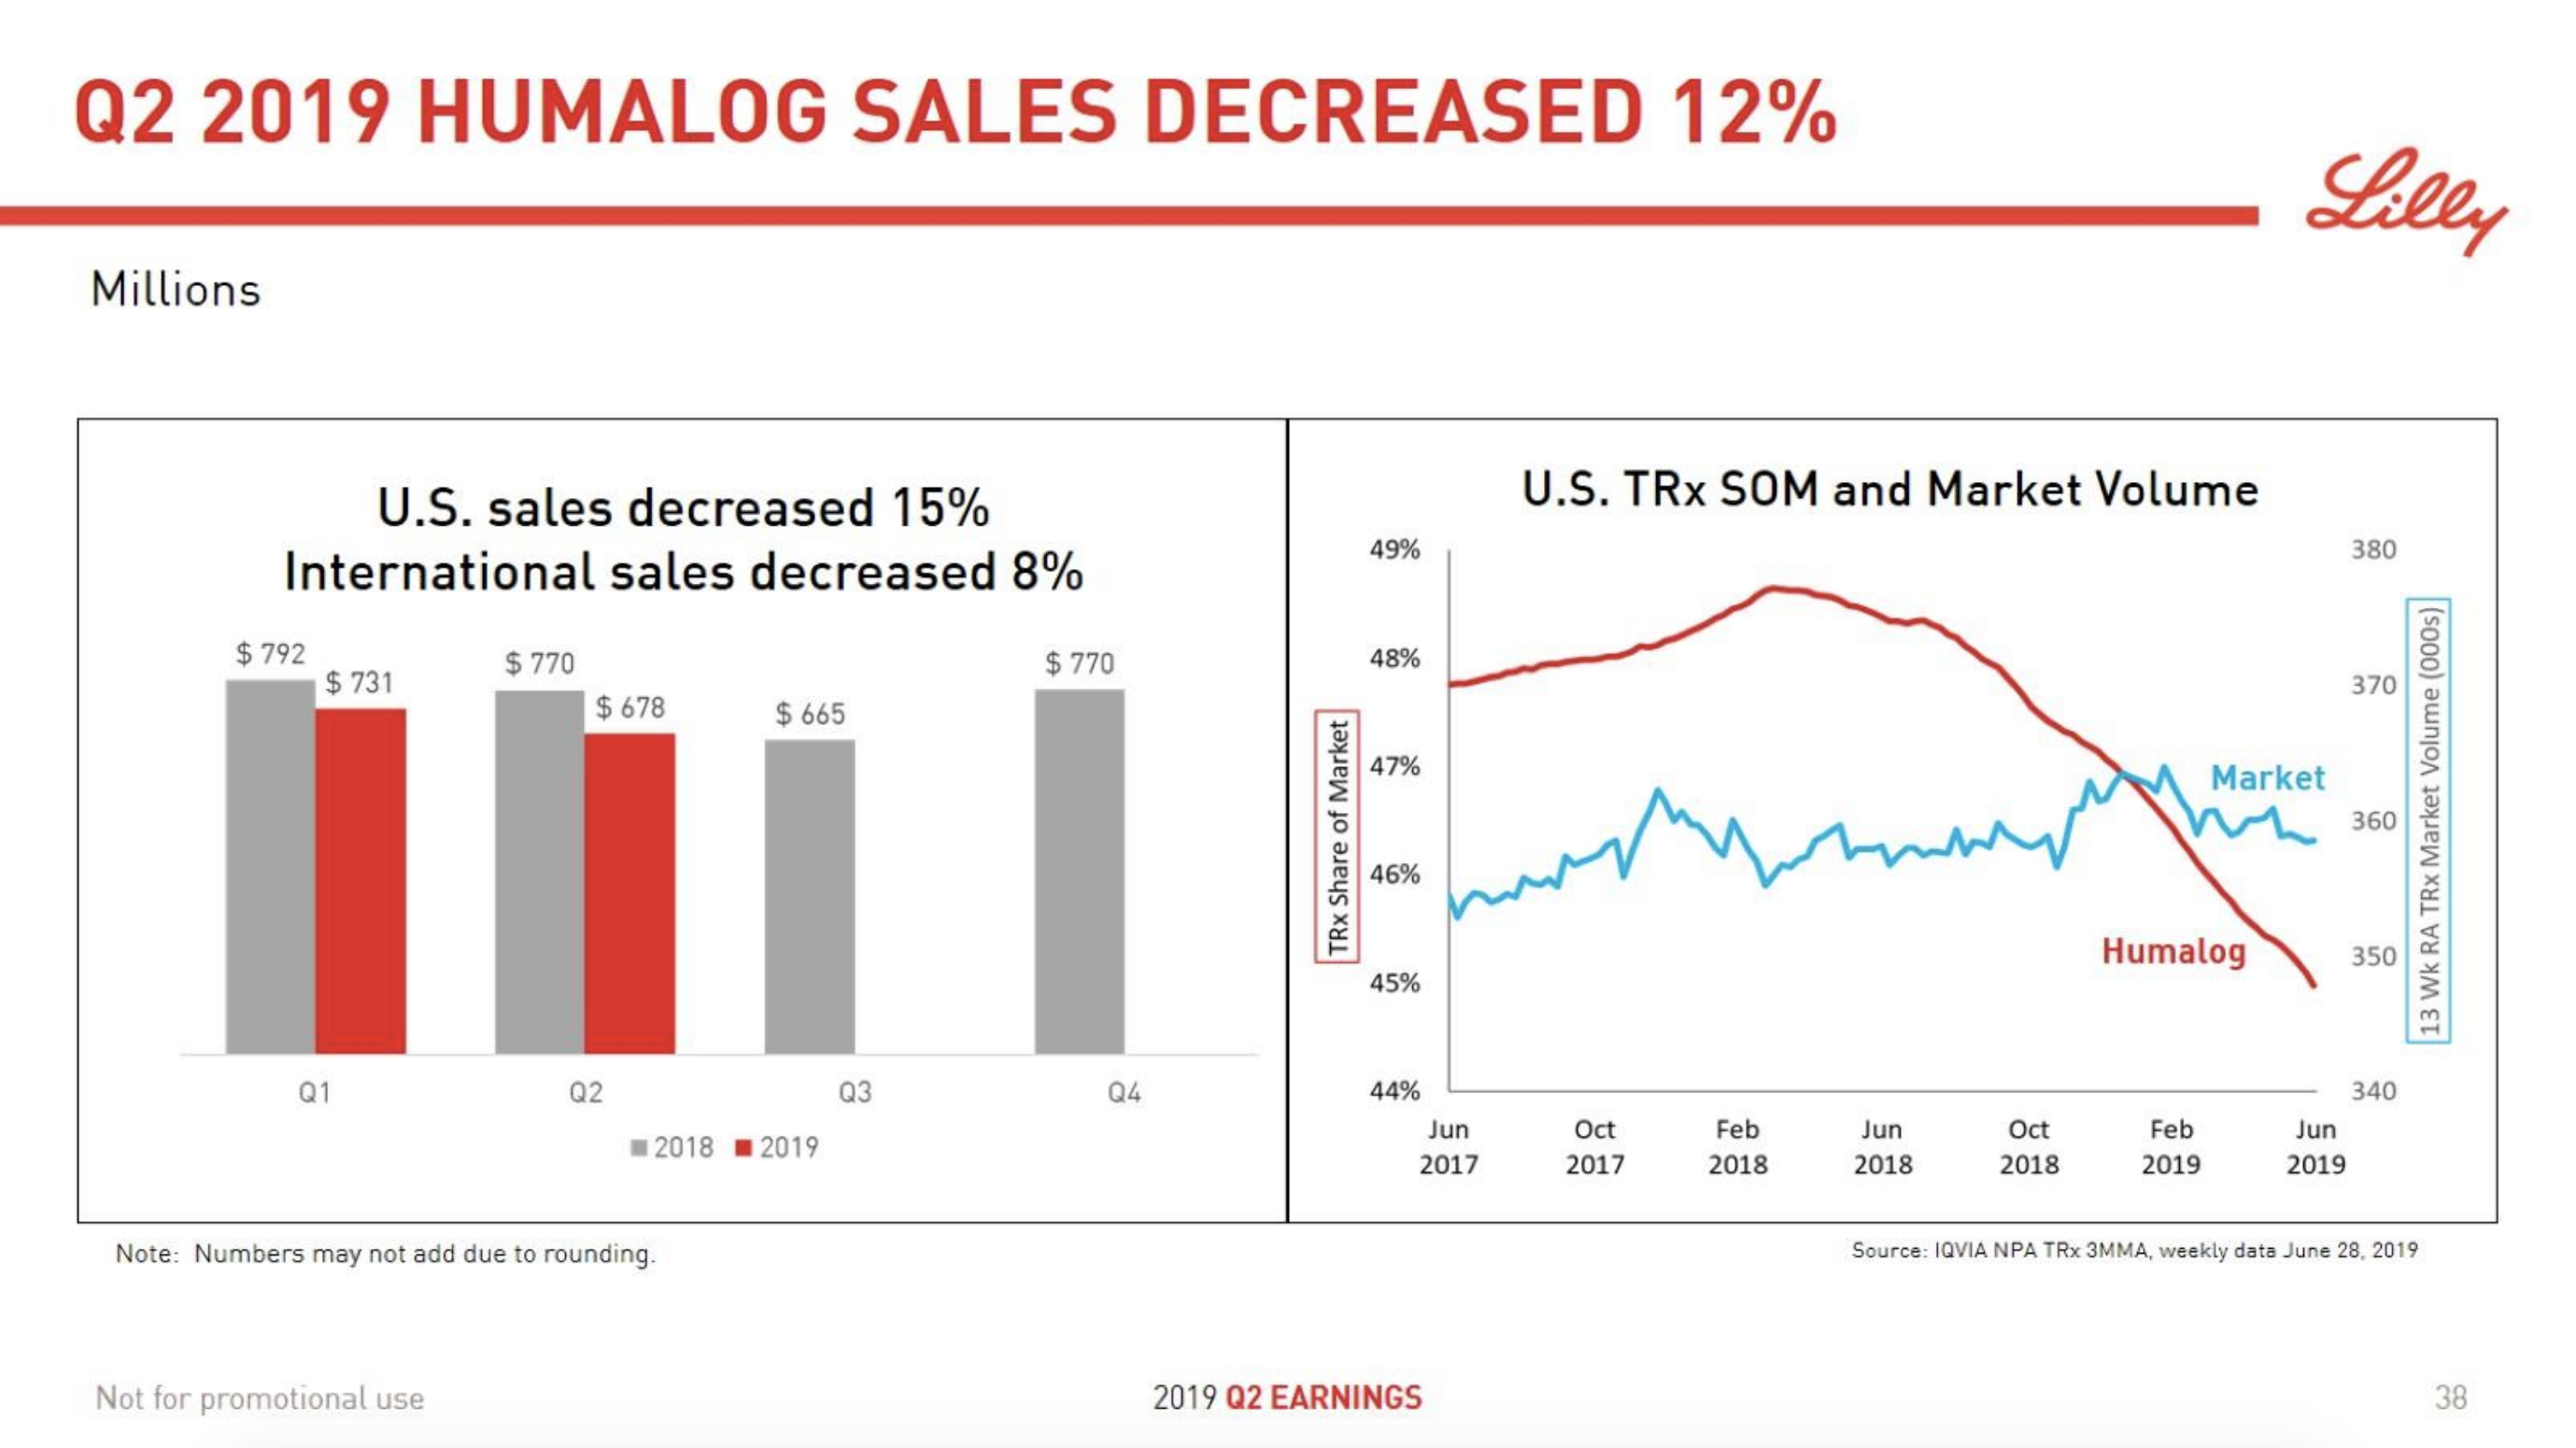
In terms of insulin, Lantus® from Sanofi is slowly bleeding to death in the US caused by the patent expiration and the launch of the analog Basaglar® by Eli Lilly. Levemir® from Novo Nordisk is also deteriorating in the US and this is not offset by growing sales of the newer Tresiba®. Similarly Humalog® from Eli Lilly will suffer in the coming quarters from the launch of a generic insulin Lispro by Eli Lilly itself and the analog Admelog® by Sanofi. Today and tomorrow belongs to the GLP1 class of drugs and not to insulin.
Jun09 Lilly’s ultra rapid lispro provided similar A1C reductions compared to Humalog® (insulin lispro), with superior post-meal blood glucose reductions
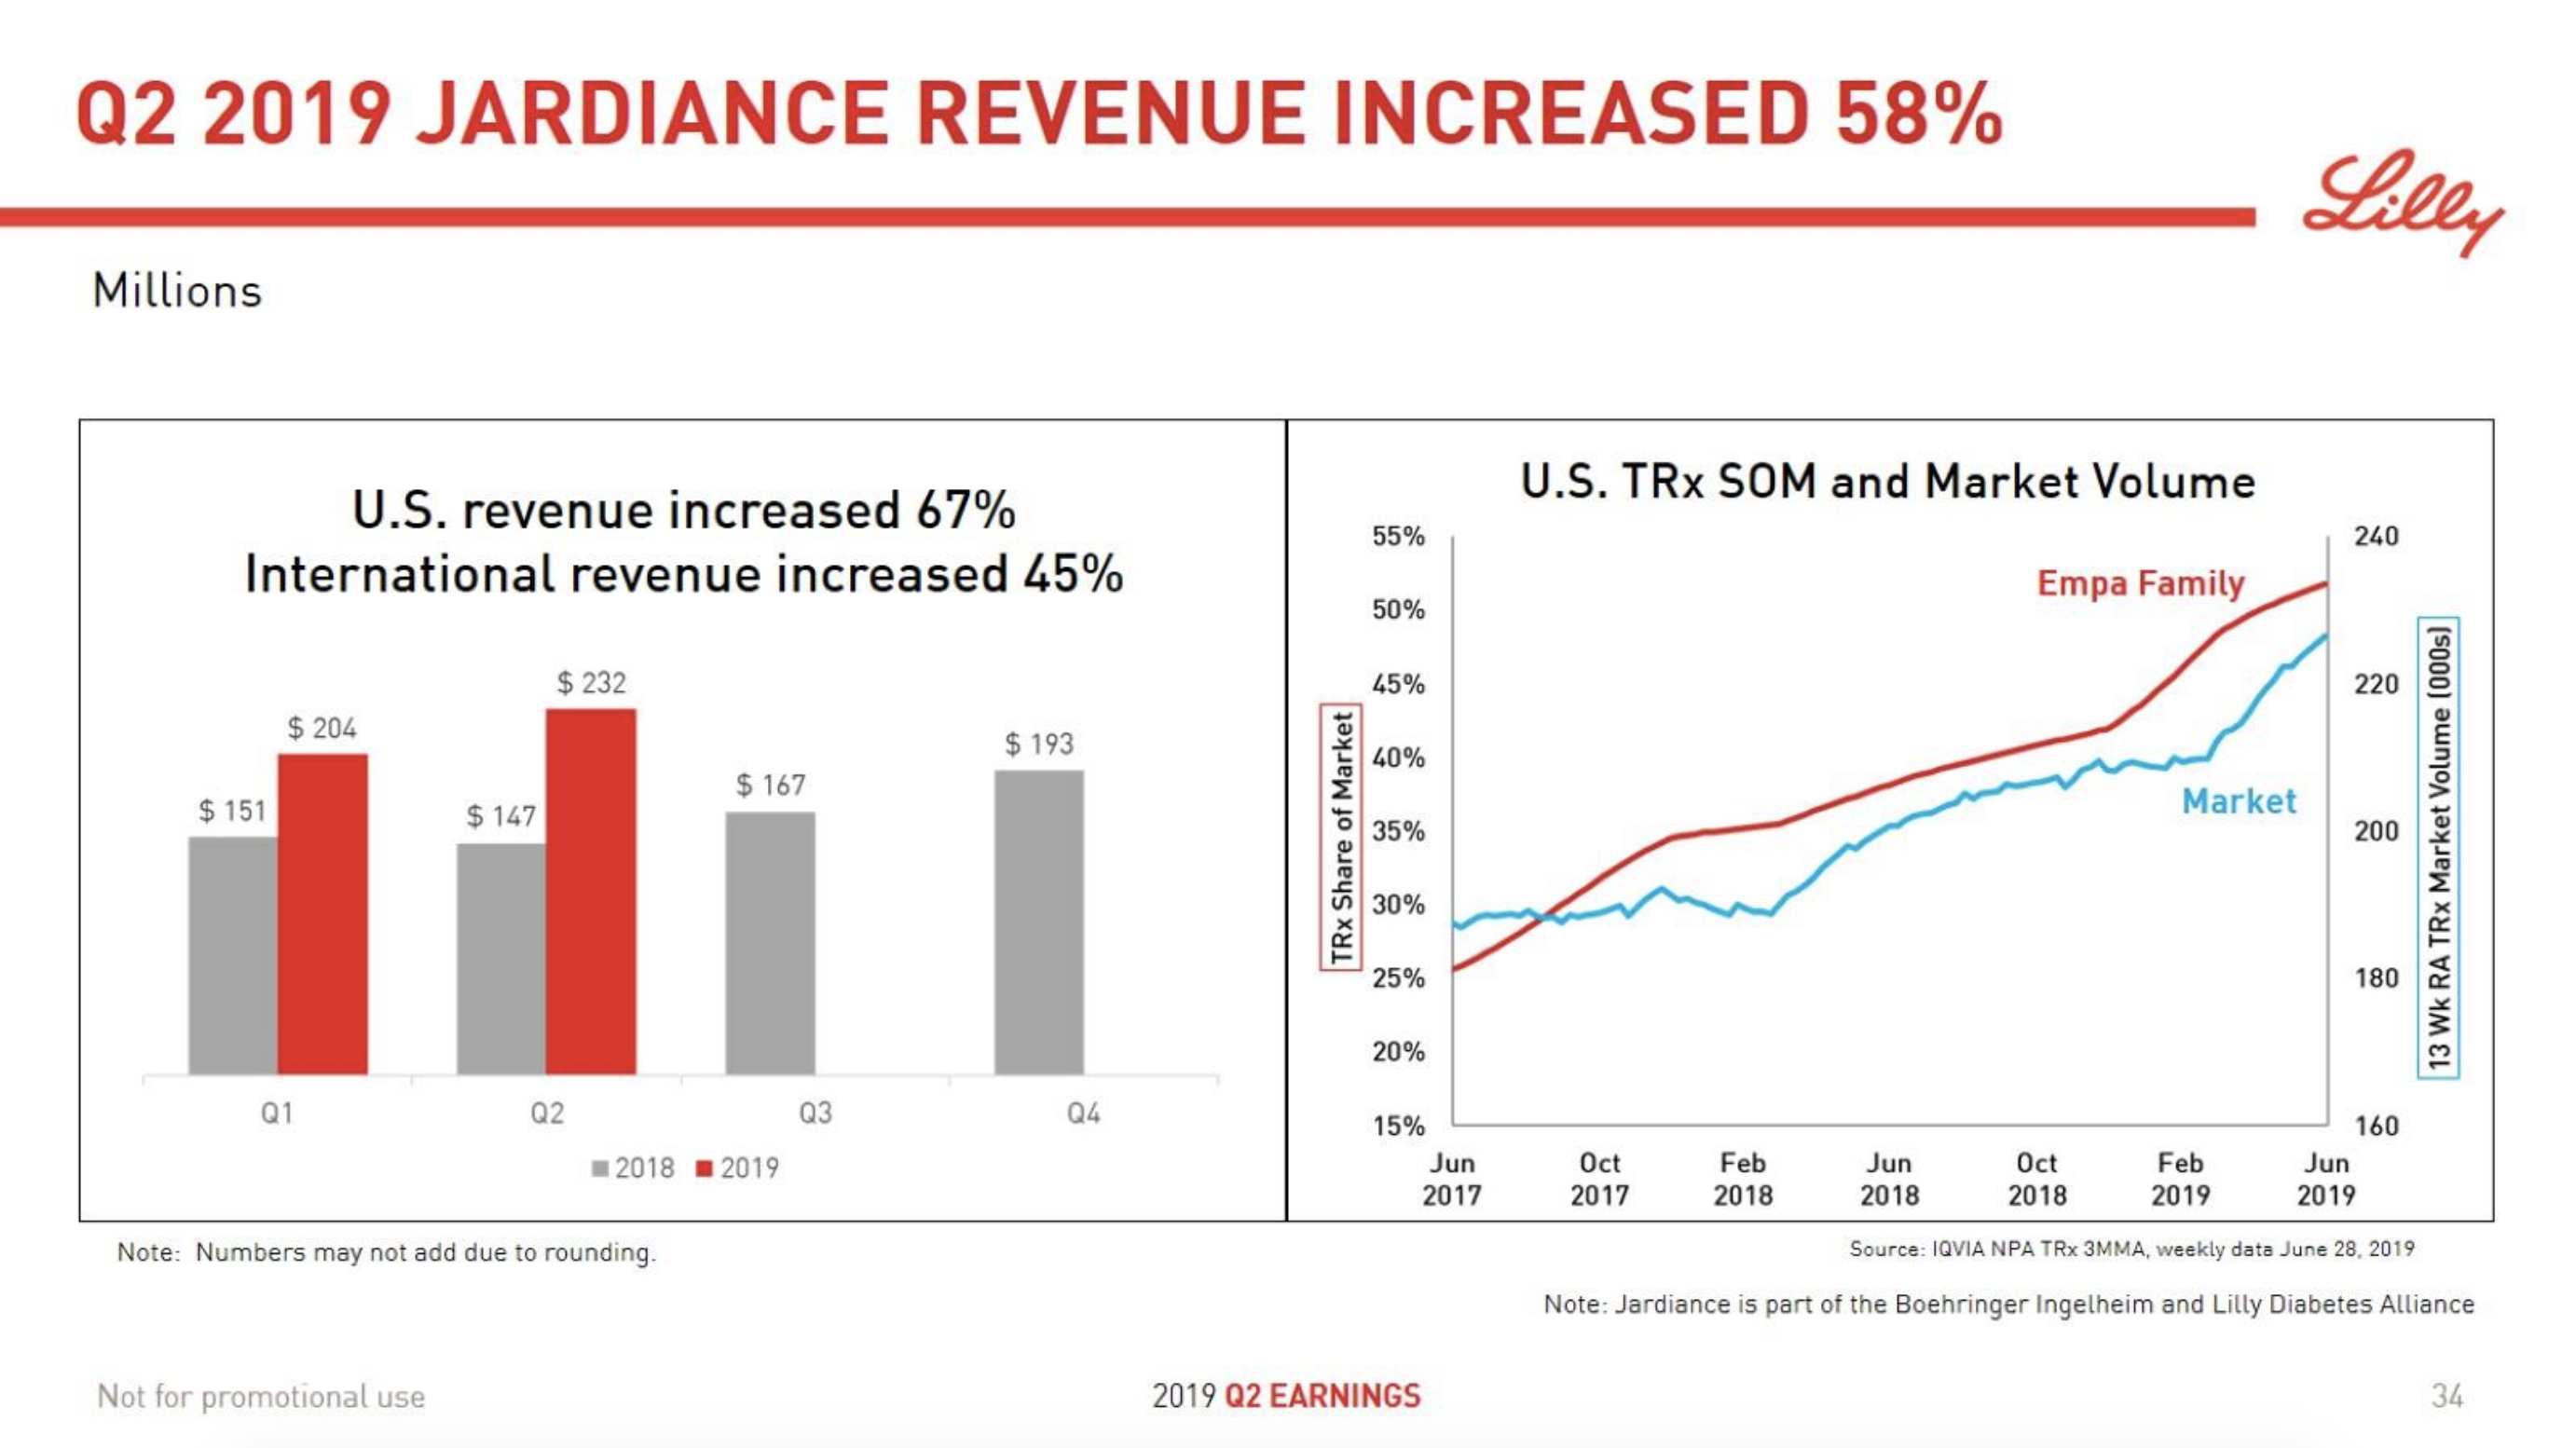
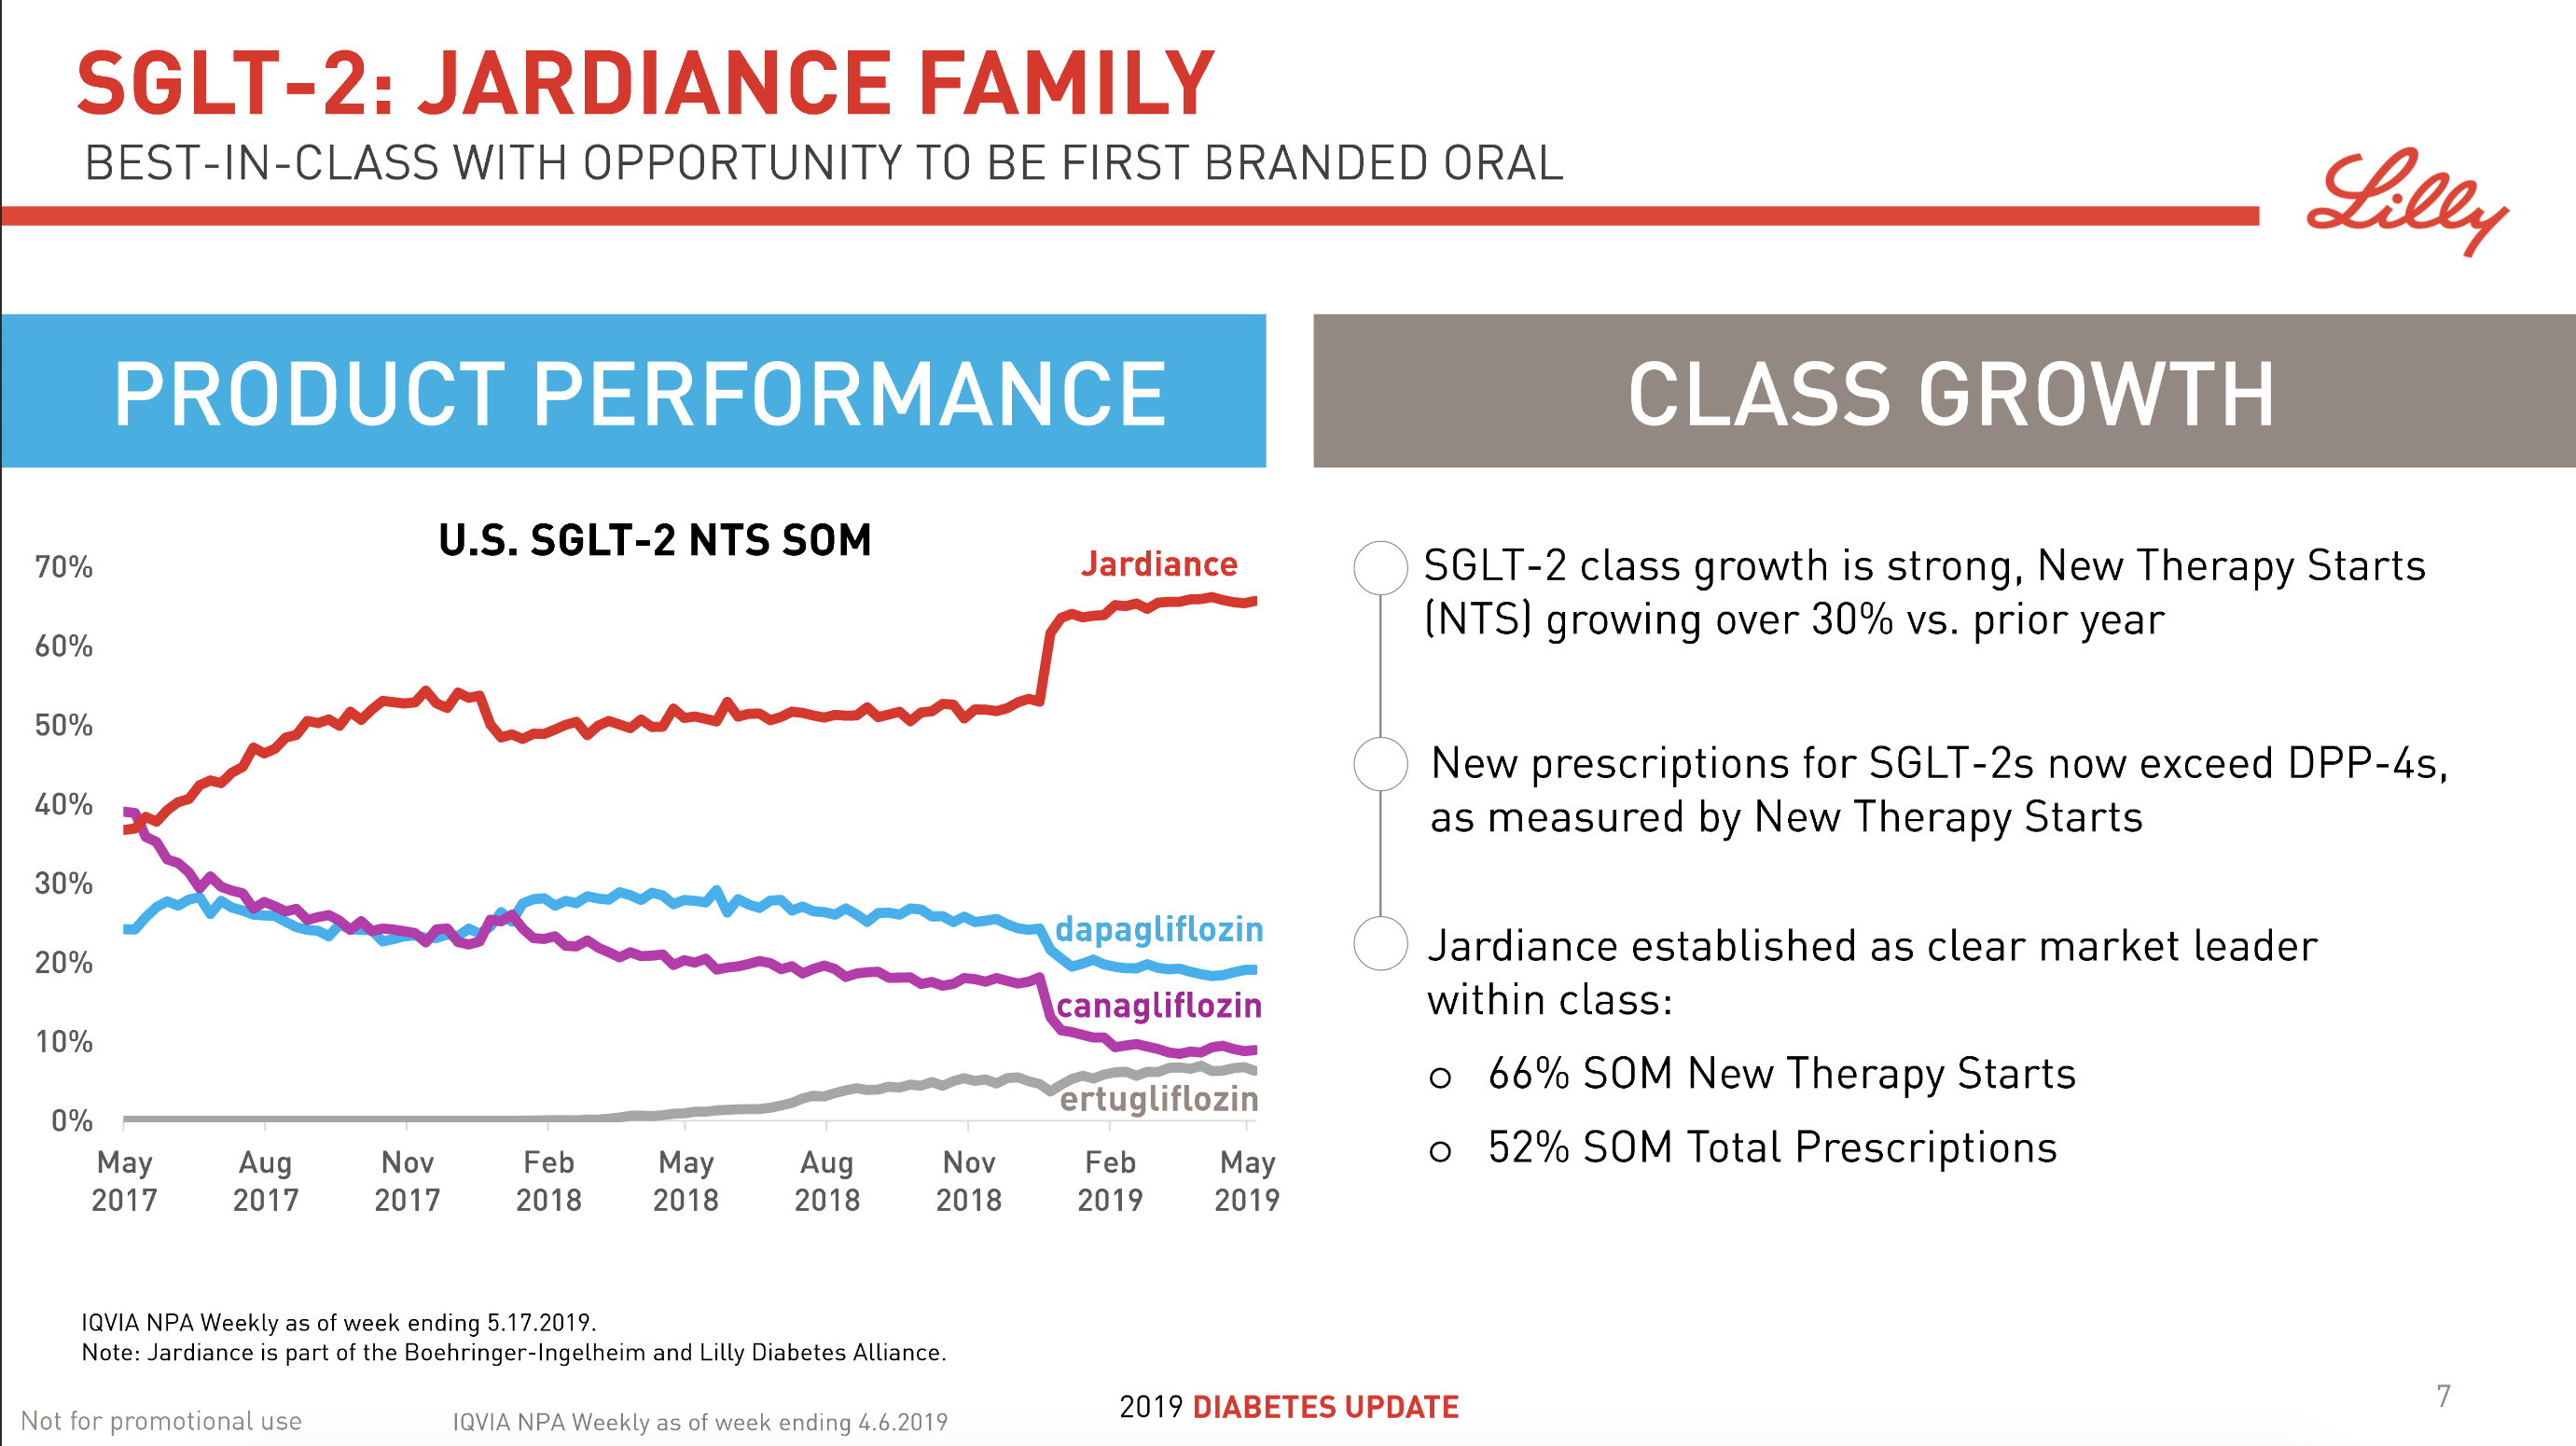
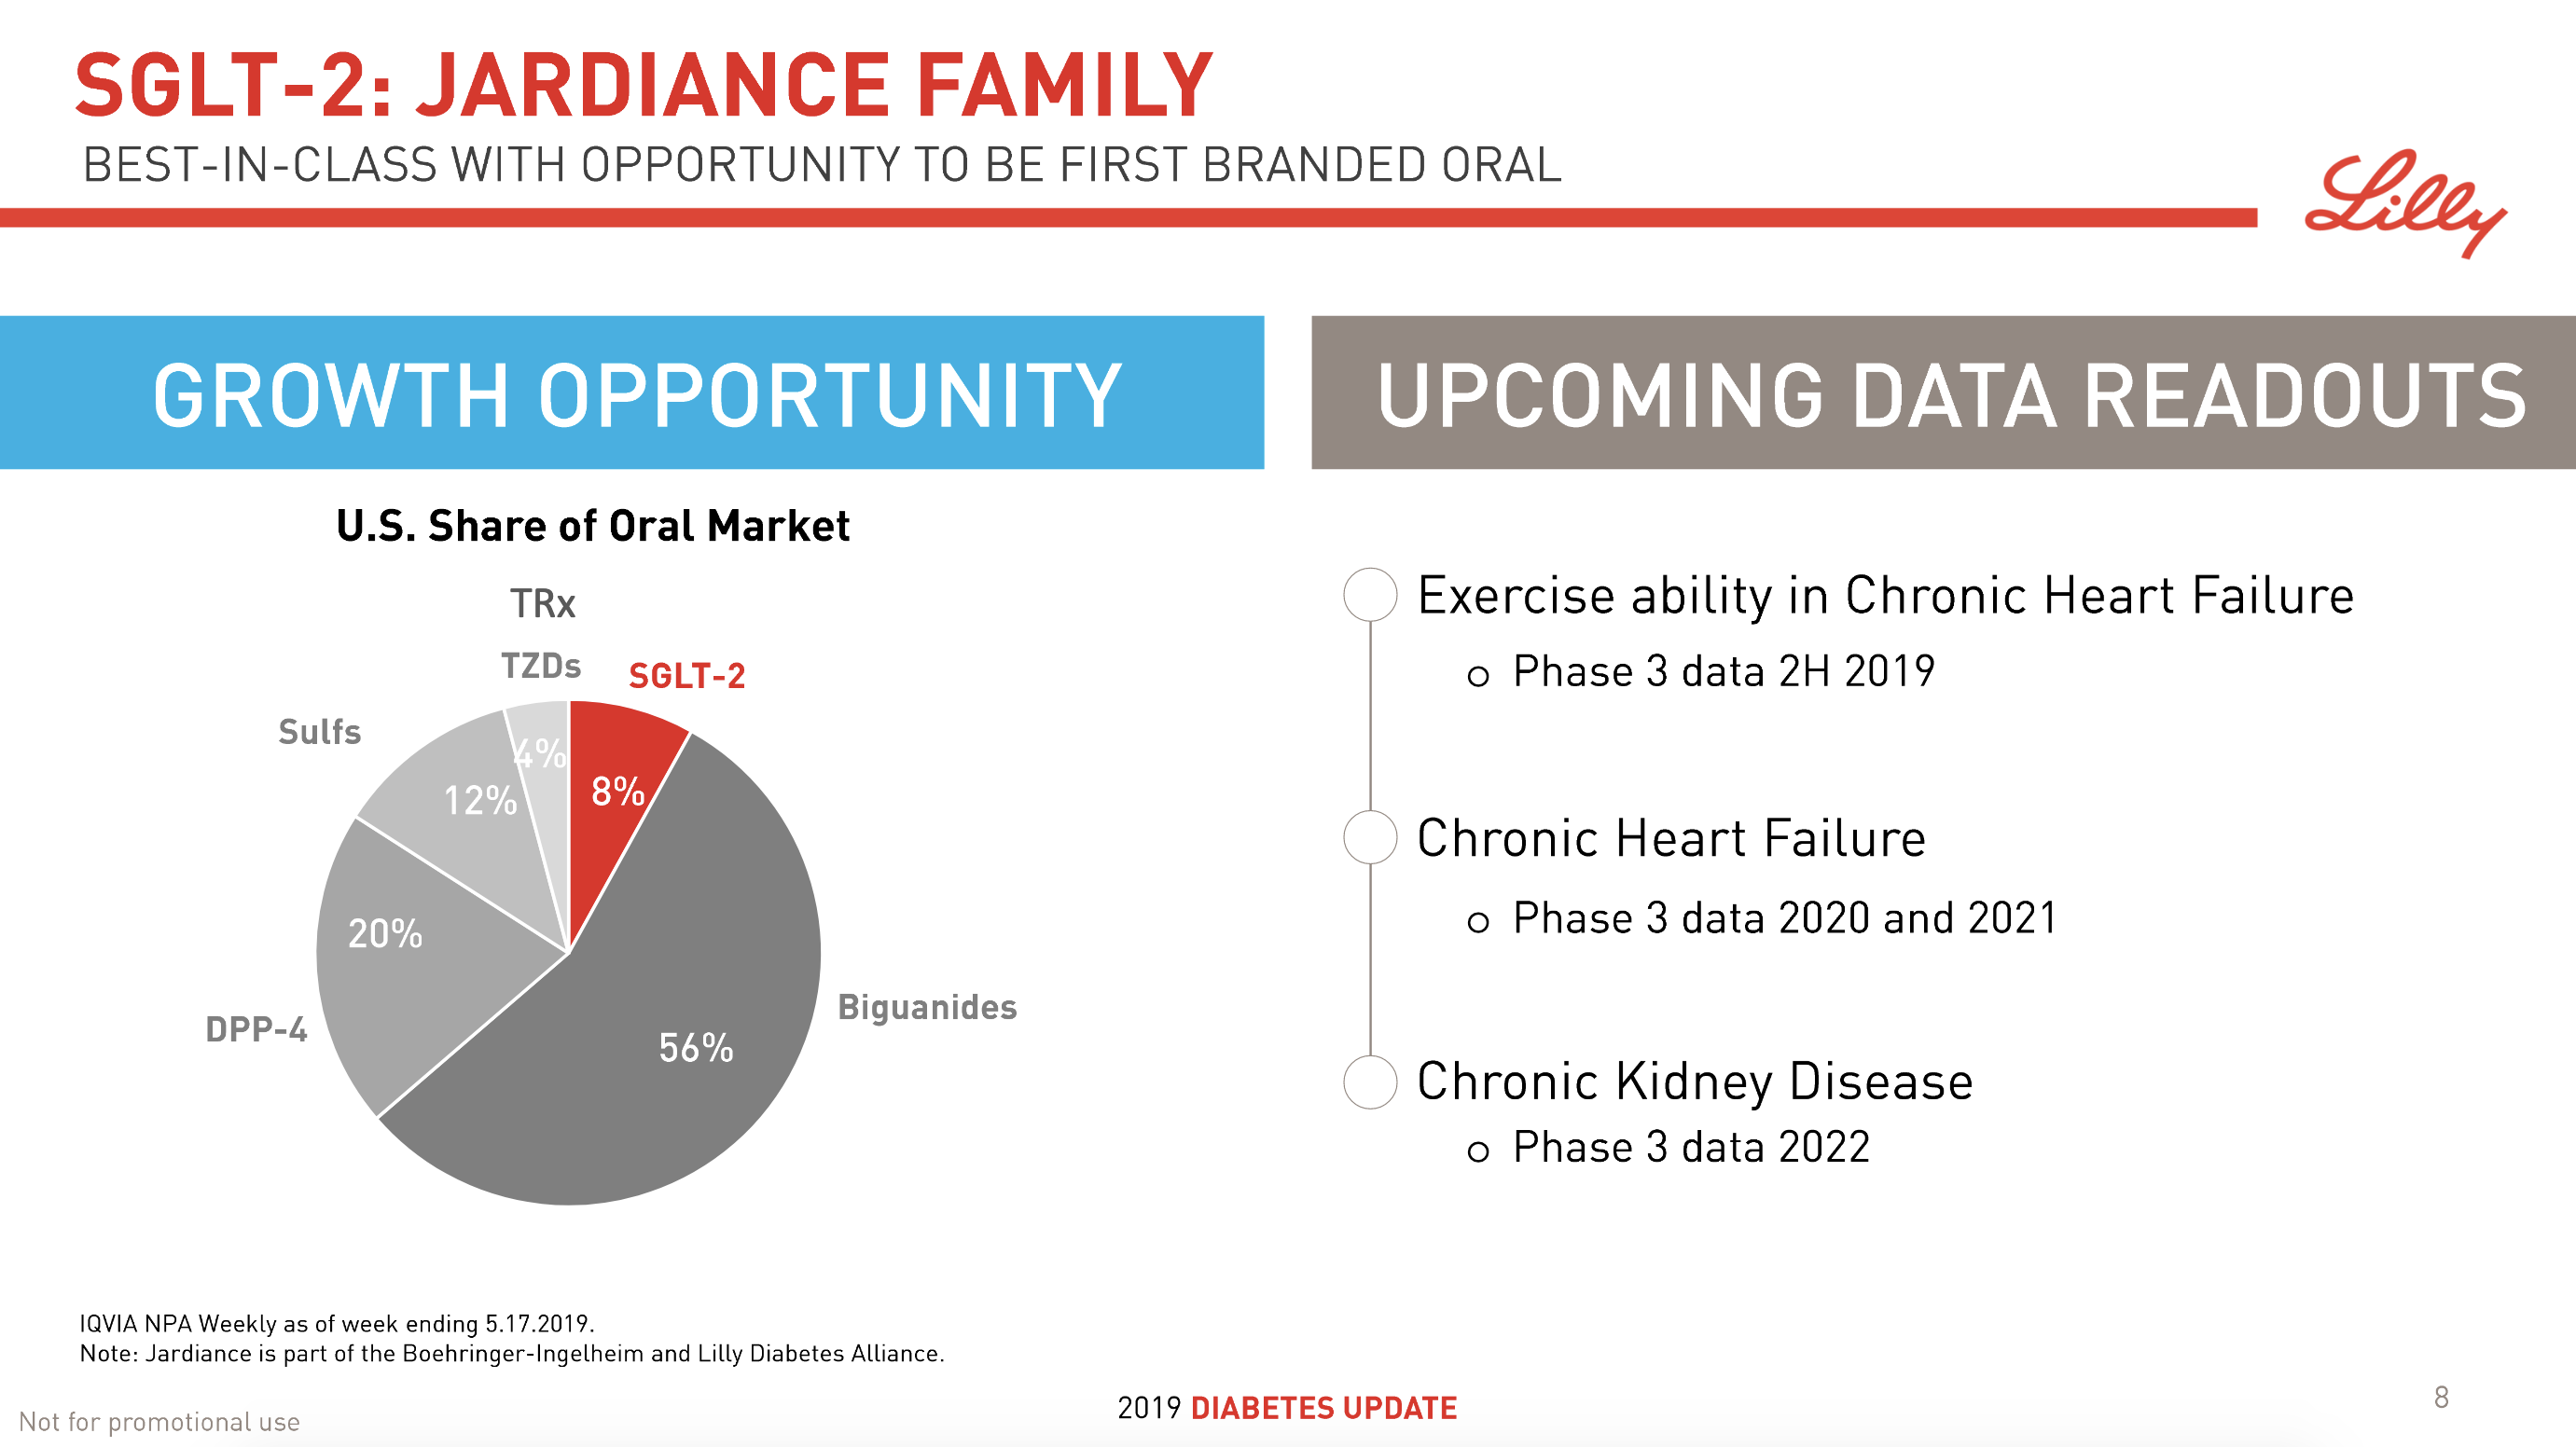
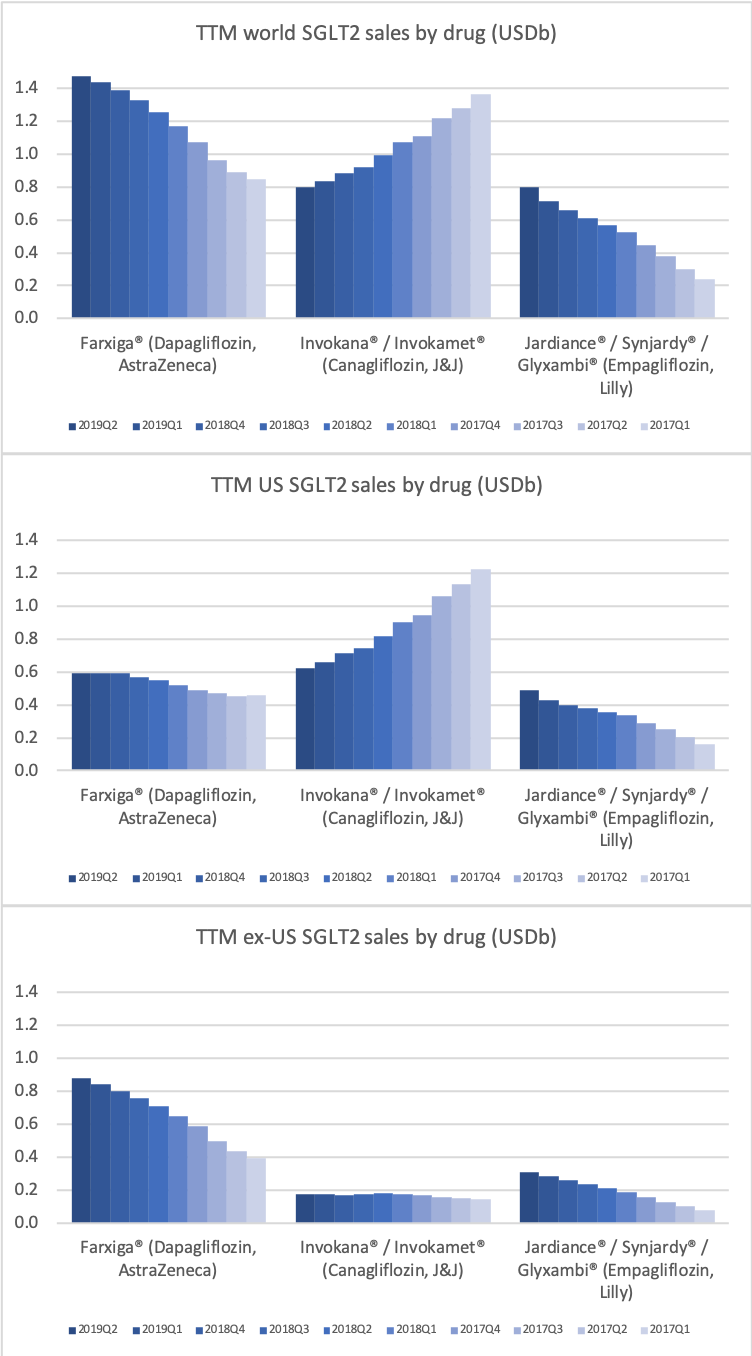
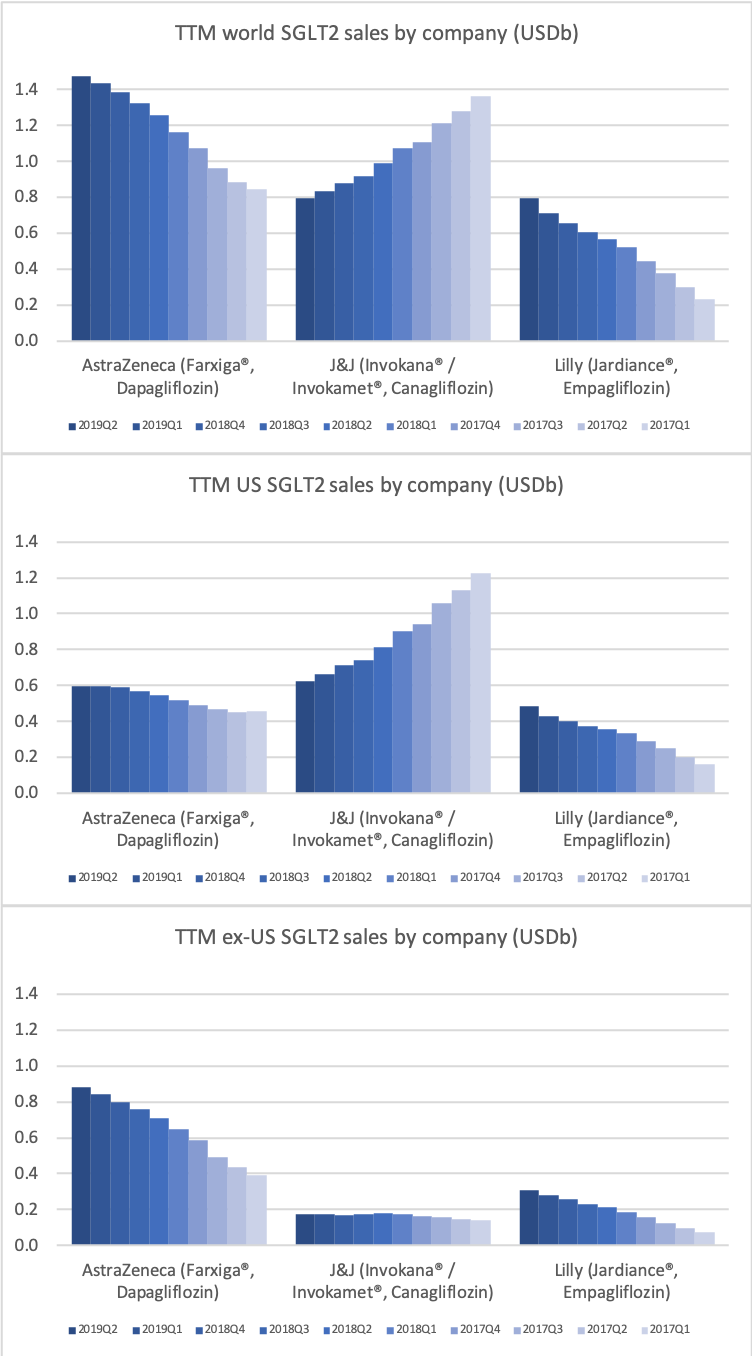
The SGLT2 drugs Farxiga® from AstraZeneca and Jardiance® from Eli Lilly continue to show positive growth in the US, whereas Invokana® from Merck displays negative growth. In the case of AstraZeneca SGLT2 is their fastest growing antidiabetic drug class. Recent news regarding the SGLT2 class of drugs are mentioned below.
Sep01 Detailed results from Phase III DAPA-HF trial showed Farxiga significantly reduced both the incidence of cardiovascular death and the worsening of heart failure
Aug20Farxiga met primary endpoint in landmark Phase III DAPA-HF trial for the treatment of patients with heart failure
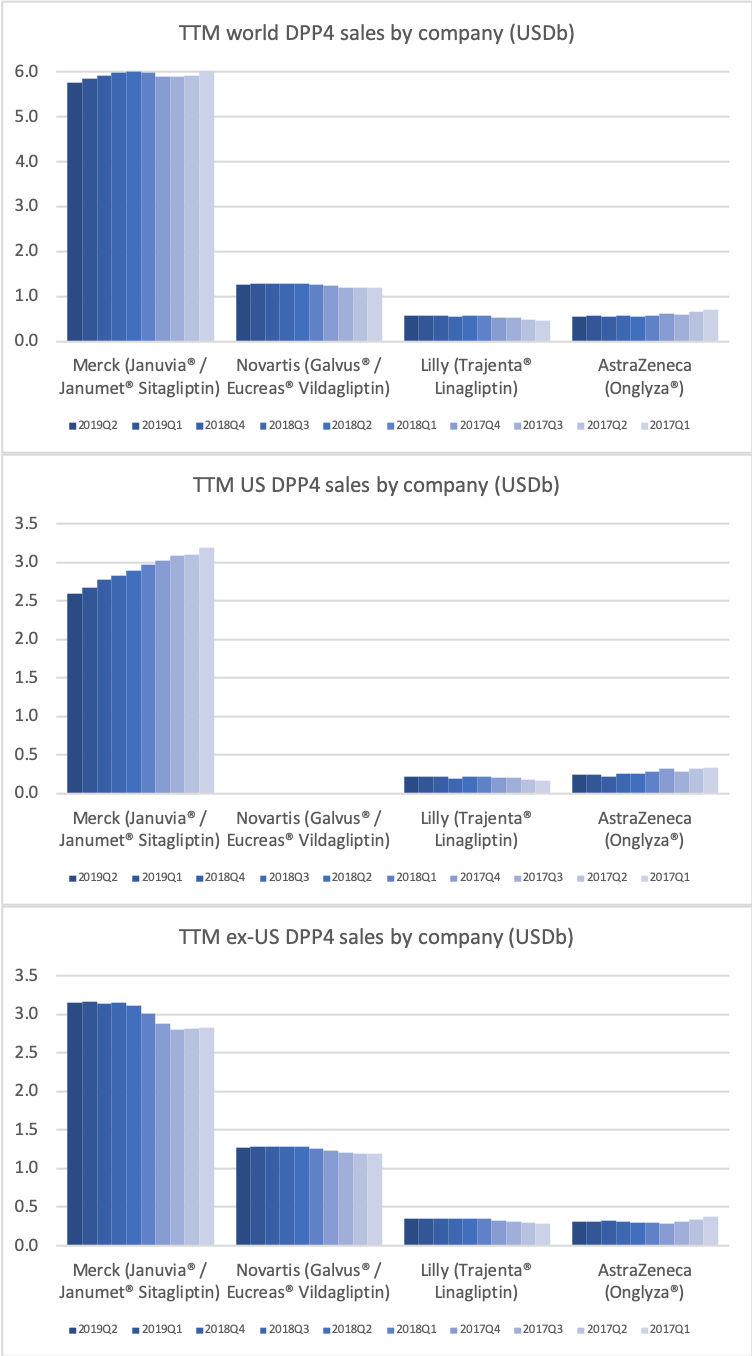
DPP4
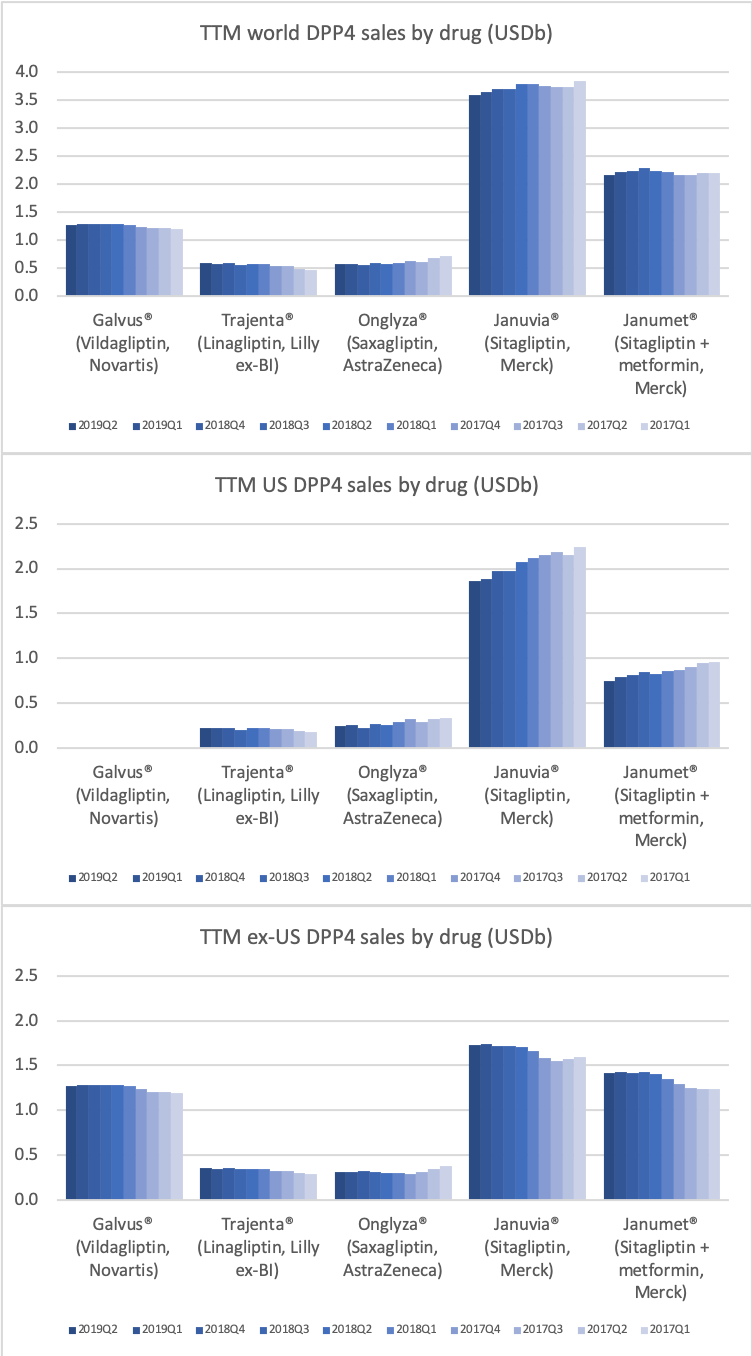
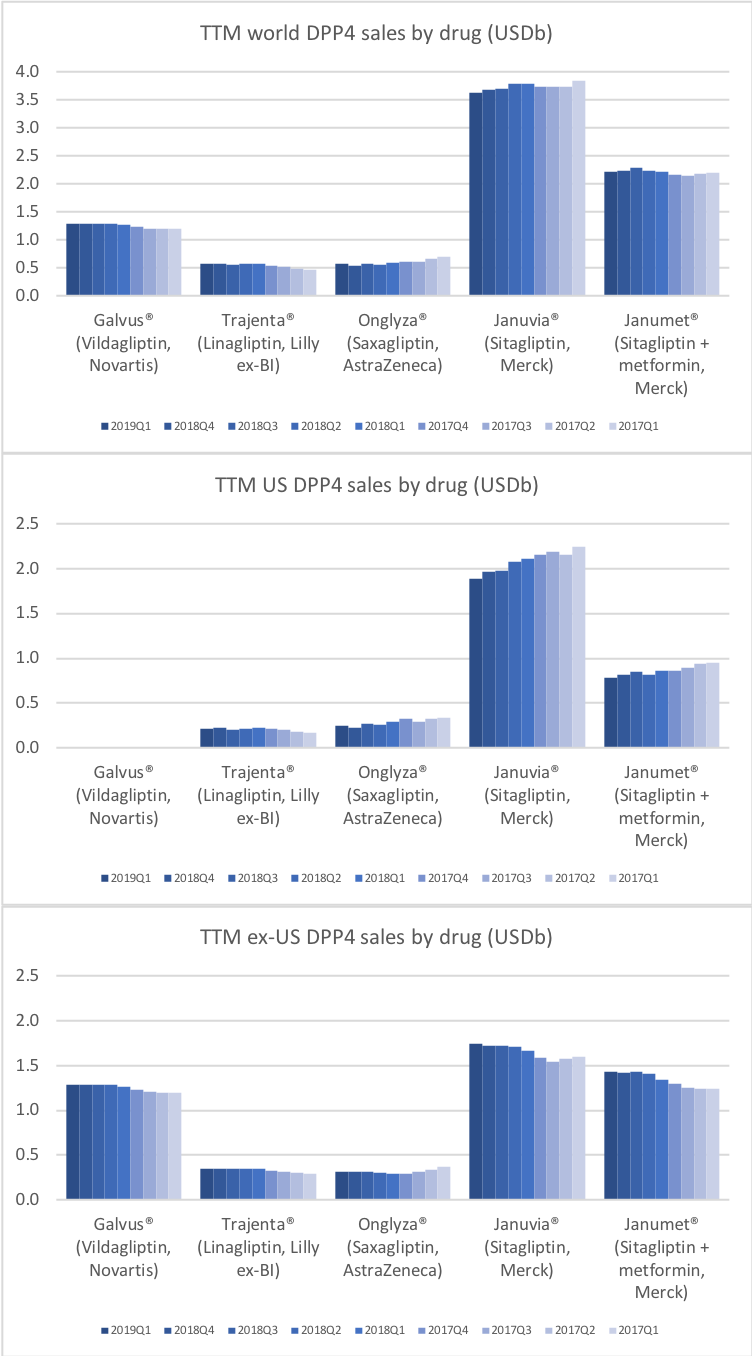
Along with insulin the DPP4 class of drugs will probably be a loser going forward. Oral semaglutide, injected GLP1 and SGLT2 will continue to take market share from DPP4 going forward. The big loser will continue to be Januvia®/Janumet® from Merck, which is currently the best selling antidiabetic drug in the world with combined TTM sales just shy of USD 6B. Eli Lilly is planning to launch a combined SGLT2/DPP4 tablet according to the June press release below.
04jun U.S. FDA Accepts New Drug Application for Triple Combination Tablet for Adults with Type 2 Diabetes
Novo Nordisk and Eli Lilly
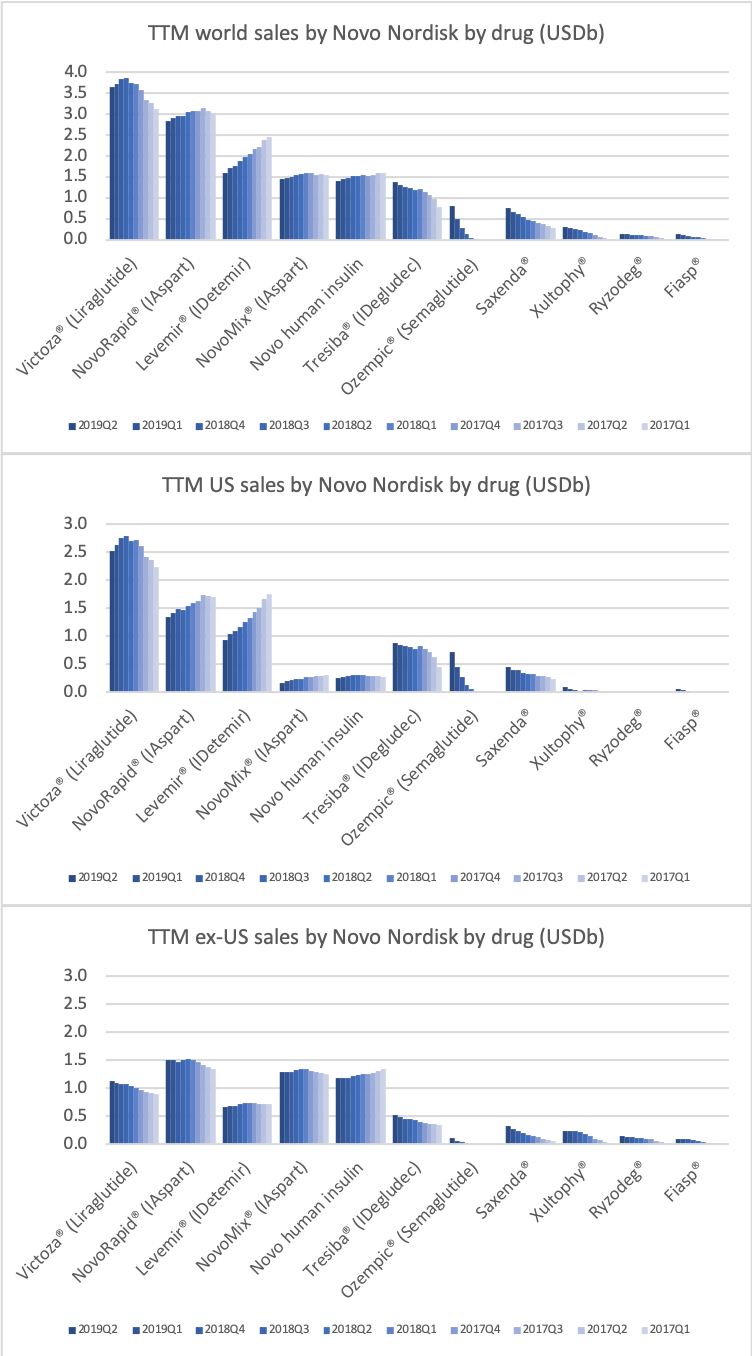
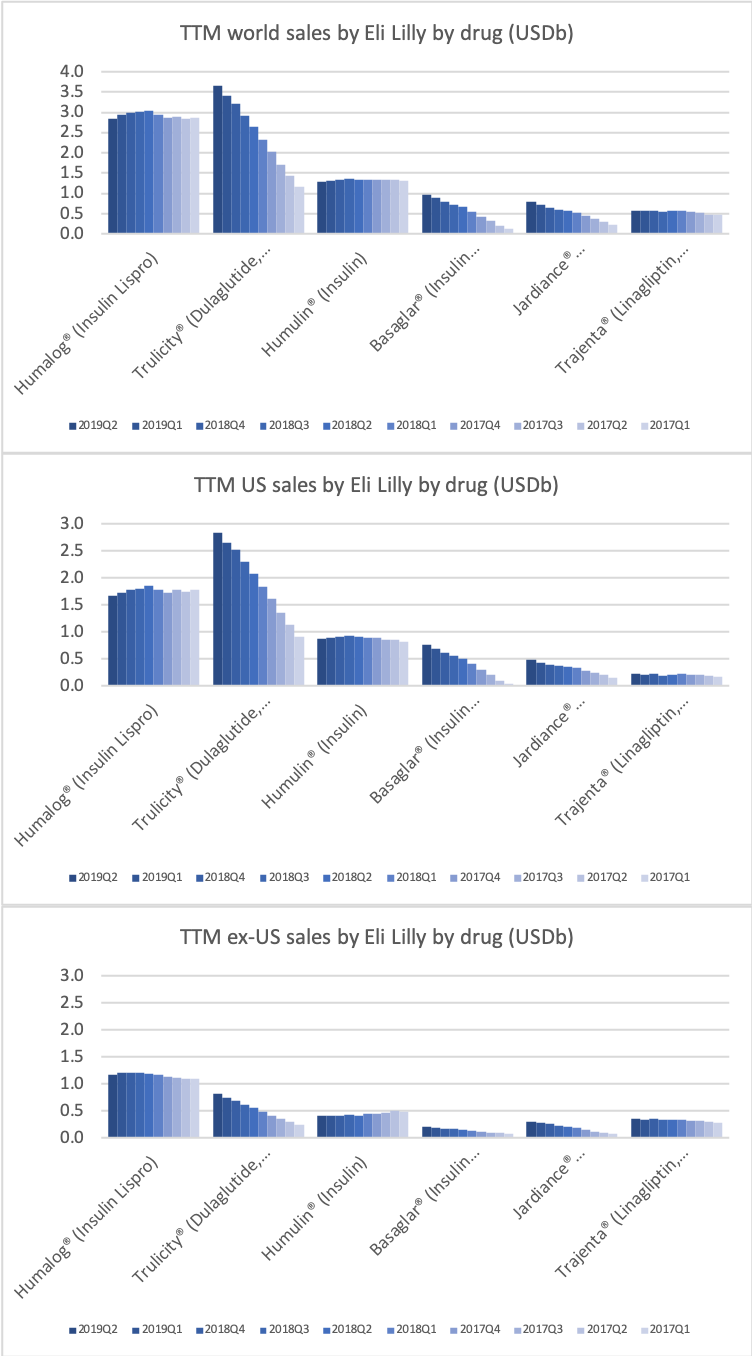
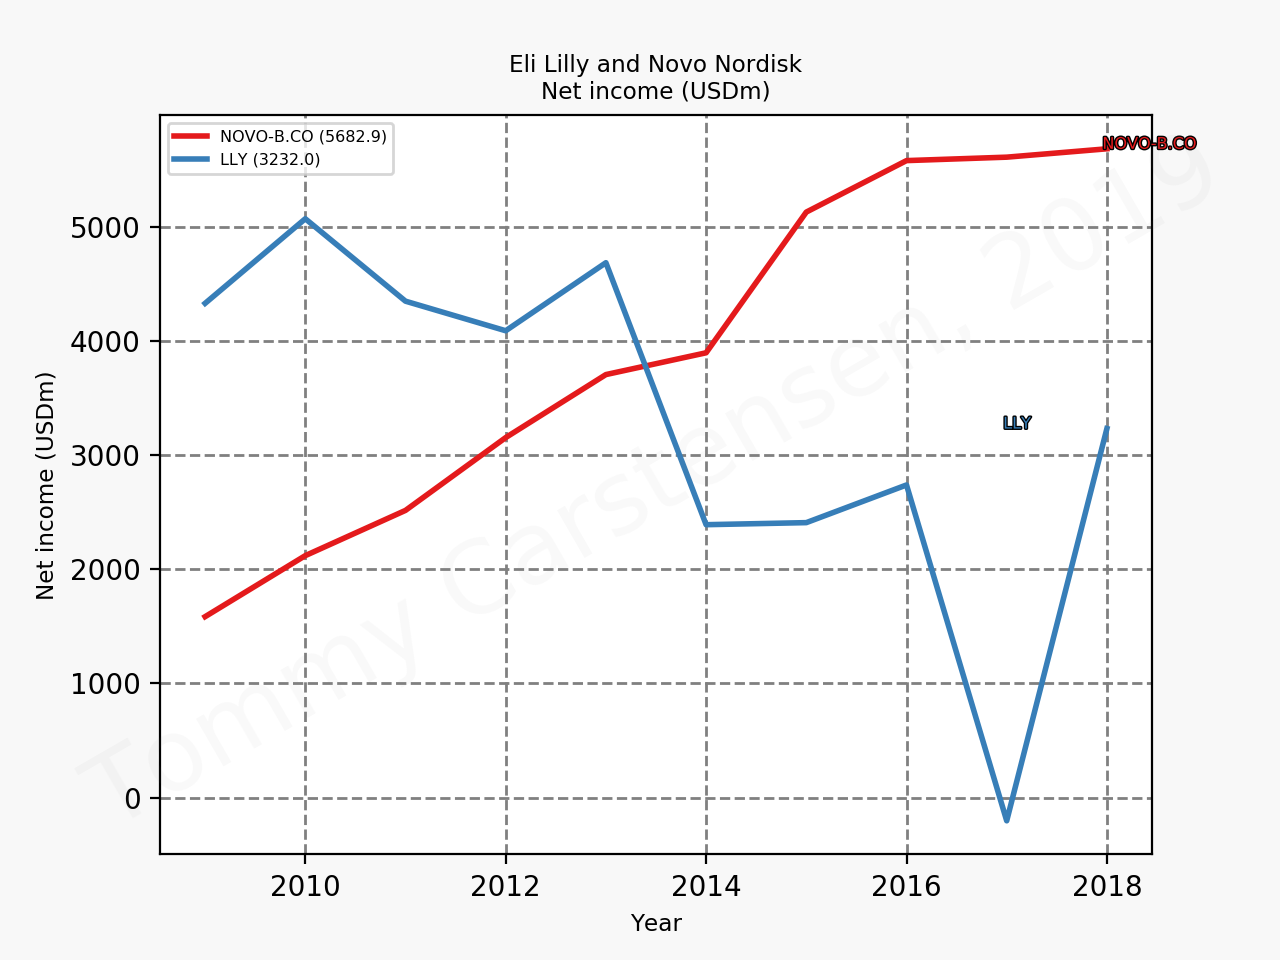
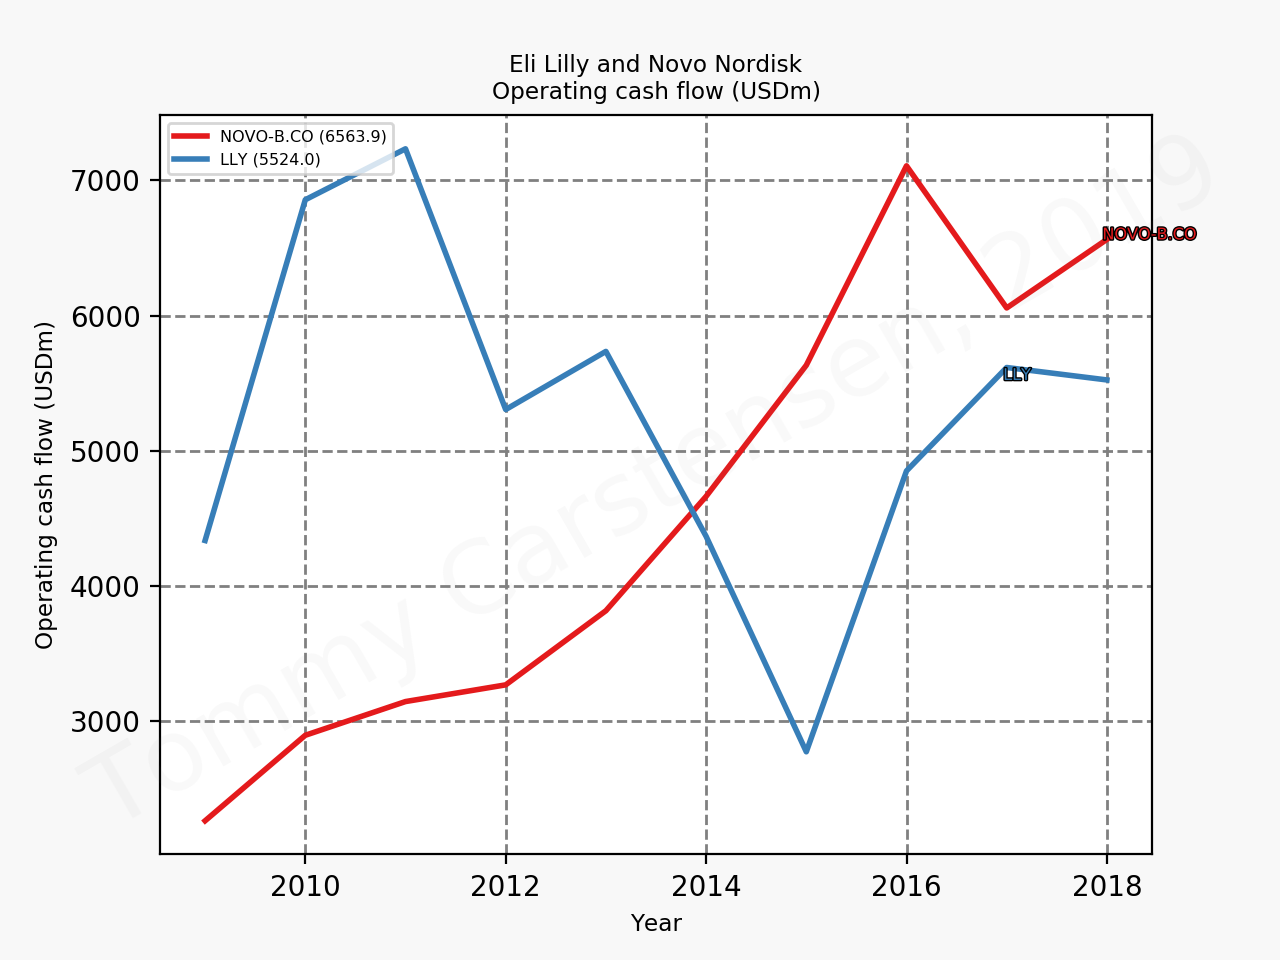
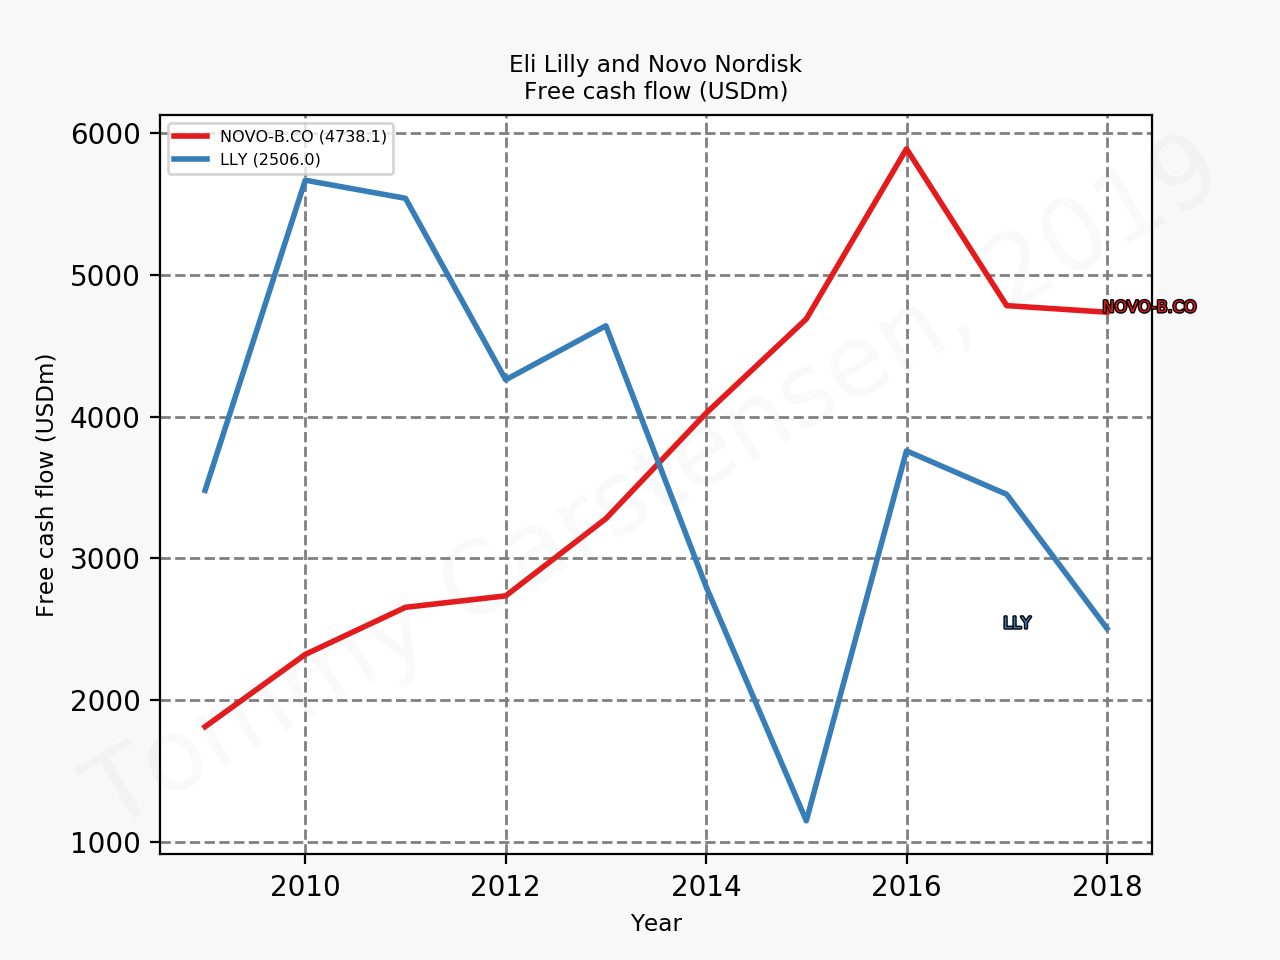
The figures below summarise the sales for Novo Nordisk and Eli Lilly for individual drugs. For Novo Nordisk the losers are Levemir® and Victoza® and the future and current winner is oral and injected semaglutide (Ozempic®), respectively. Tresiba® is only partially offsetting the revenue loss by Levemir®. The big winner for Eli Lilly is Trulicity®. A future winner might be their phase III dual agonist, which is discussed elsewhere in this article. The insulin Basaglar® is cannibalising Lantus® and the SGLT2 drug Jardiance® is also doing well within and outside the US.
Novo Nordisk sales in 2019Q2 and 2018Q2 of antidiabetic and antiobesity drugs (DKKm).Eli Lilly sales in 2019Q2 and 2018Q2 of antidiabetic drugs (USDm).
Studies
The table below summarises some of the ongoing or recently finished GLP1 studies from Sanofi, Eli Lilly and Novo Nordisk.
Eli Lilly is more than just Trulicity® and diabetes (e.g. Taltz®), but it is very richly valued despite terzepatide and other interesting drugs in the pipeline. Levemir® will continue to deteriorate for Novo Nordisk and Ozempic® will continue to cannibalise Victoza®, but a positive catalyst is the expected approval of oral semaglutide on September 20th; oral semaglutide could take market share from injected GLP1 (USD9B), SGLT2 (USD3B), DPP4 (USD8B) and insulin (USD18B). There is a lot of potential upside. Neither company is particularly attractive at current prices.
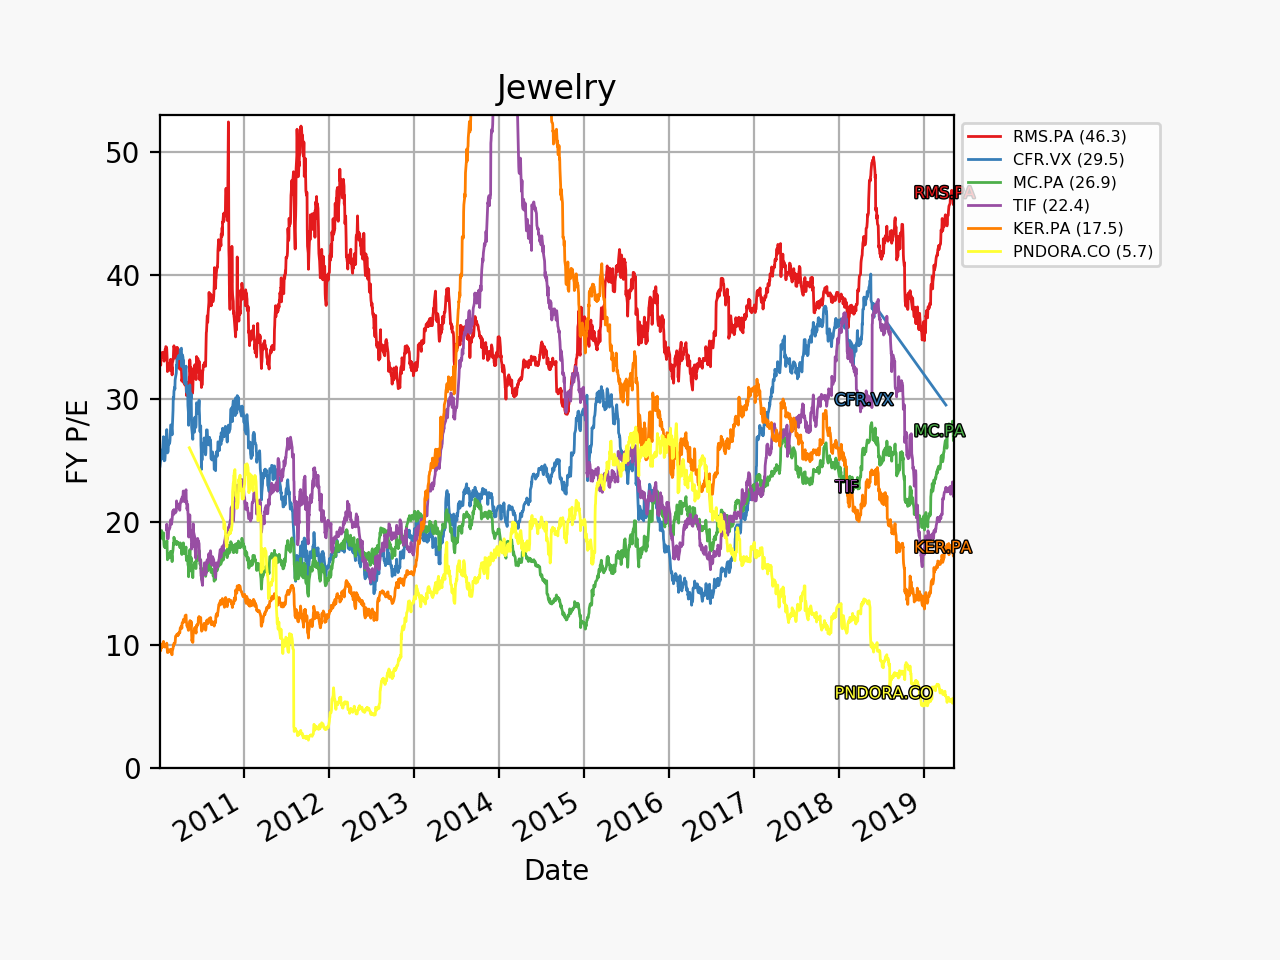
P/S time series for manufacturers of anti-diabetic drugs.
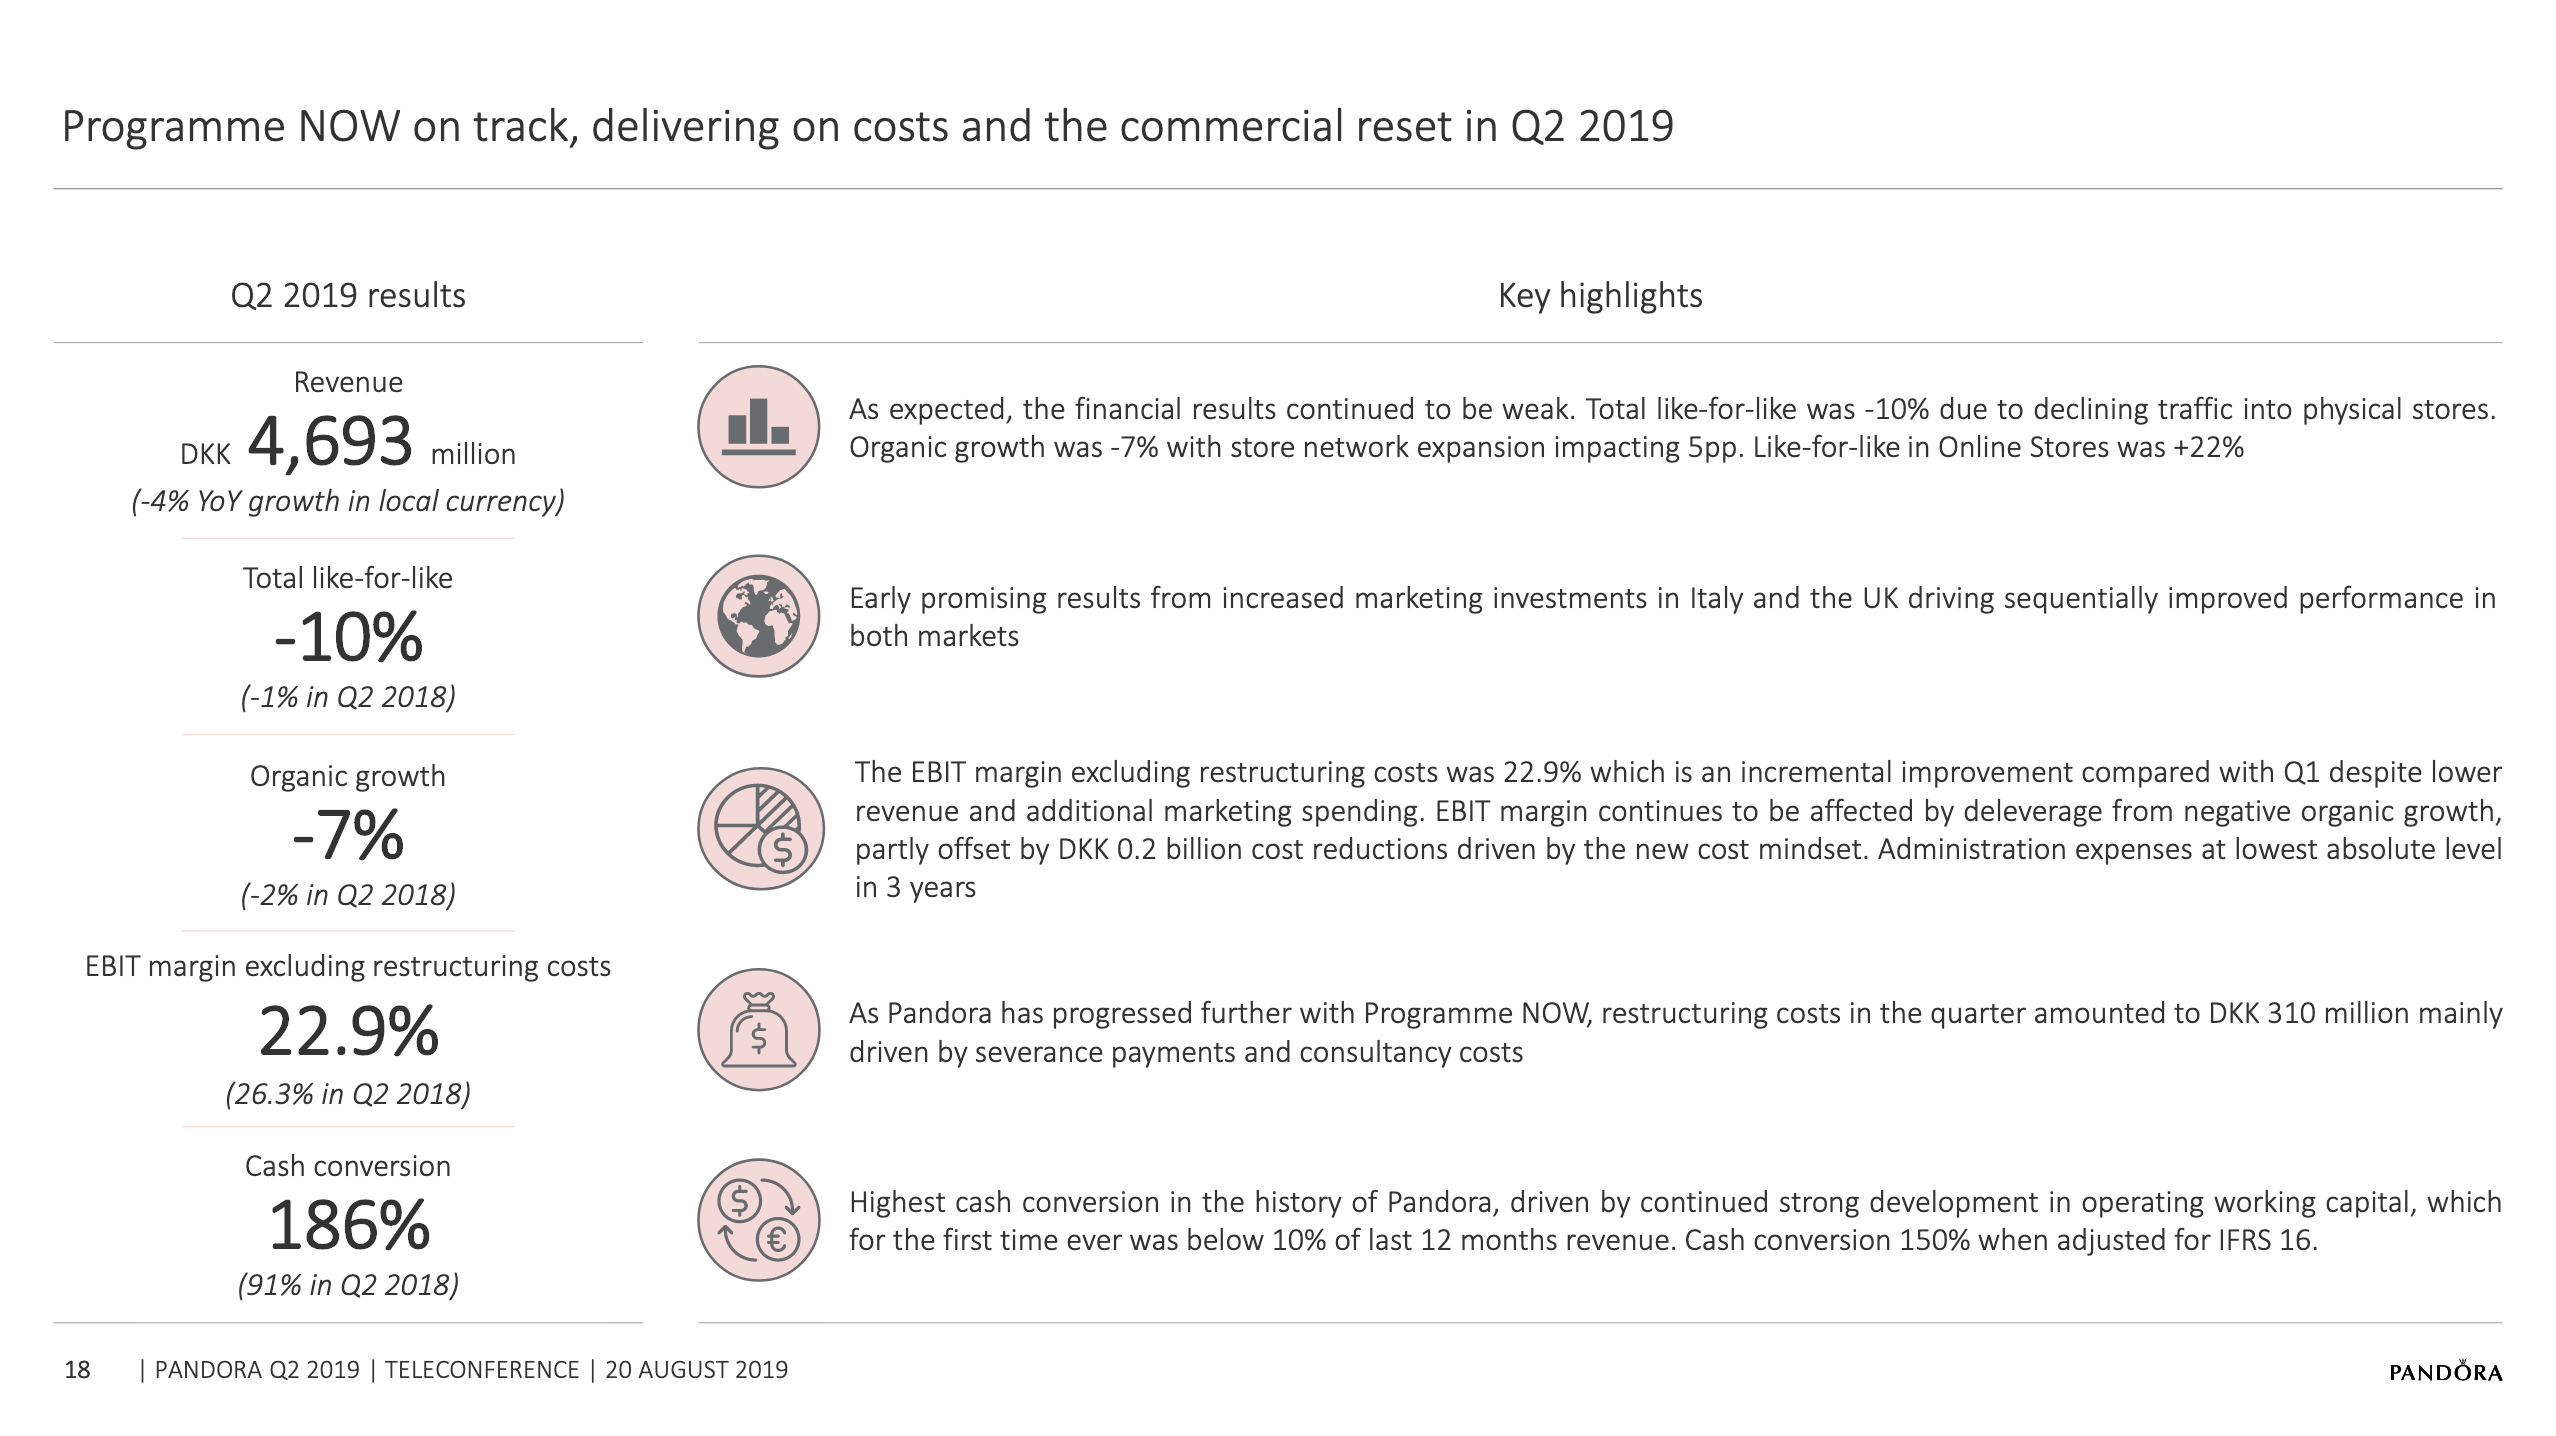
On August 20th Pandora issued a press release regarding Q2 earnings. The share price subsequently surged; especially following purchases by the CEO and CFO. It seems the absence of bad news is good news in the case of Pandora at the current point of the restructuring plan and at current price levels. Below some important slides from the earnings call and bullet points from the press release.
The 2019 financial guidance for organic growth and EBIT margin excluding restructuring costs is unchanged.
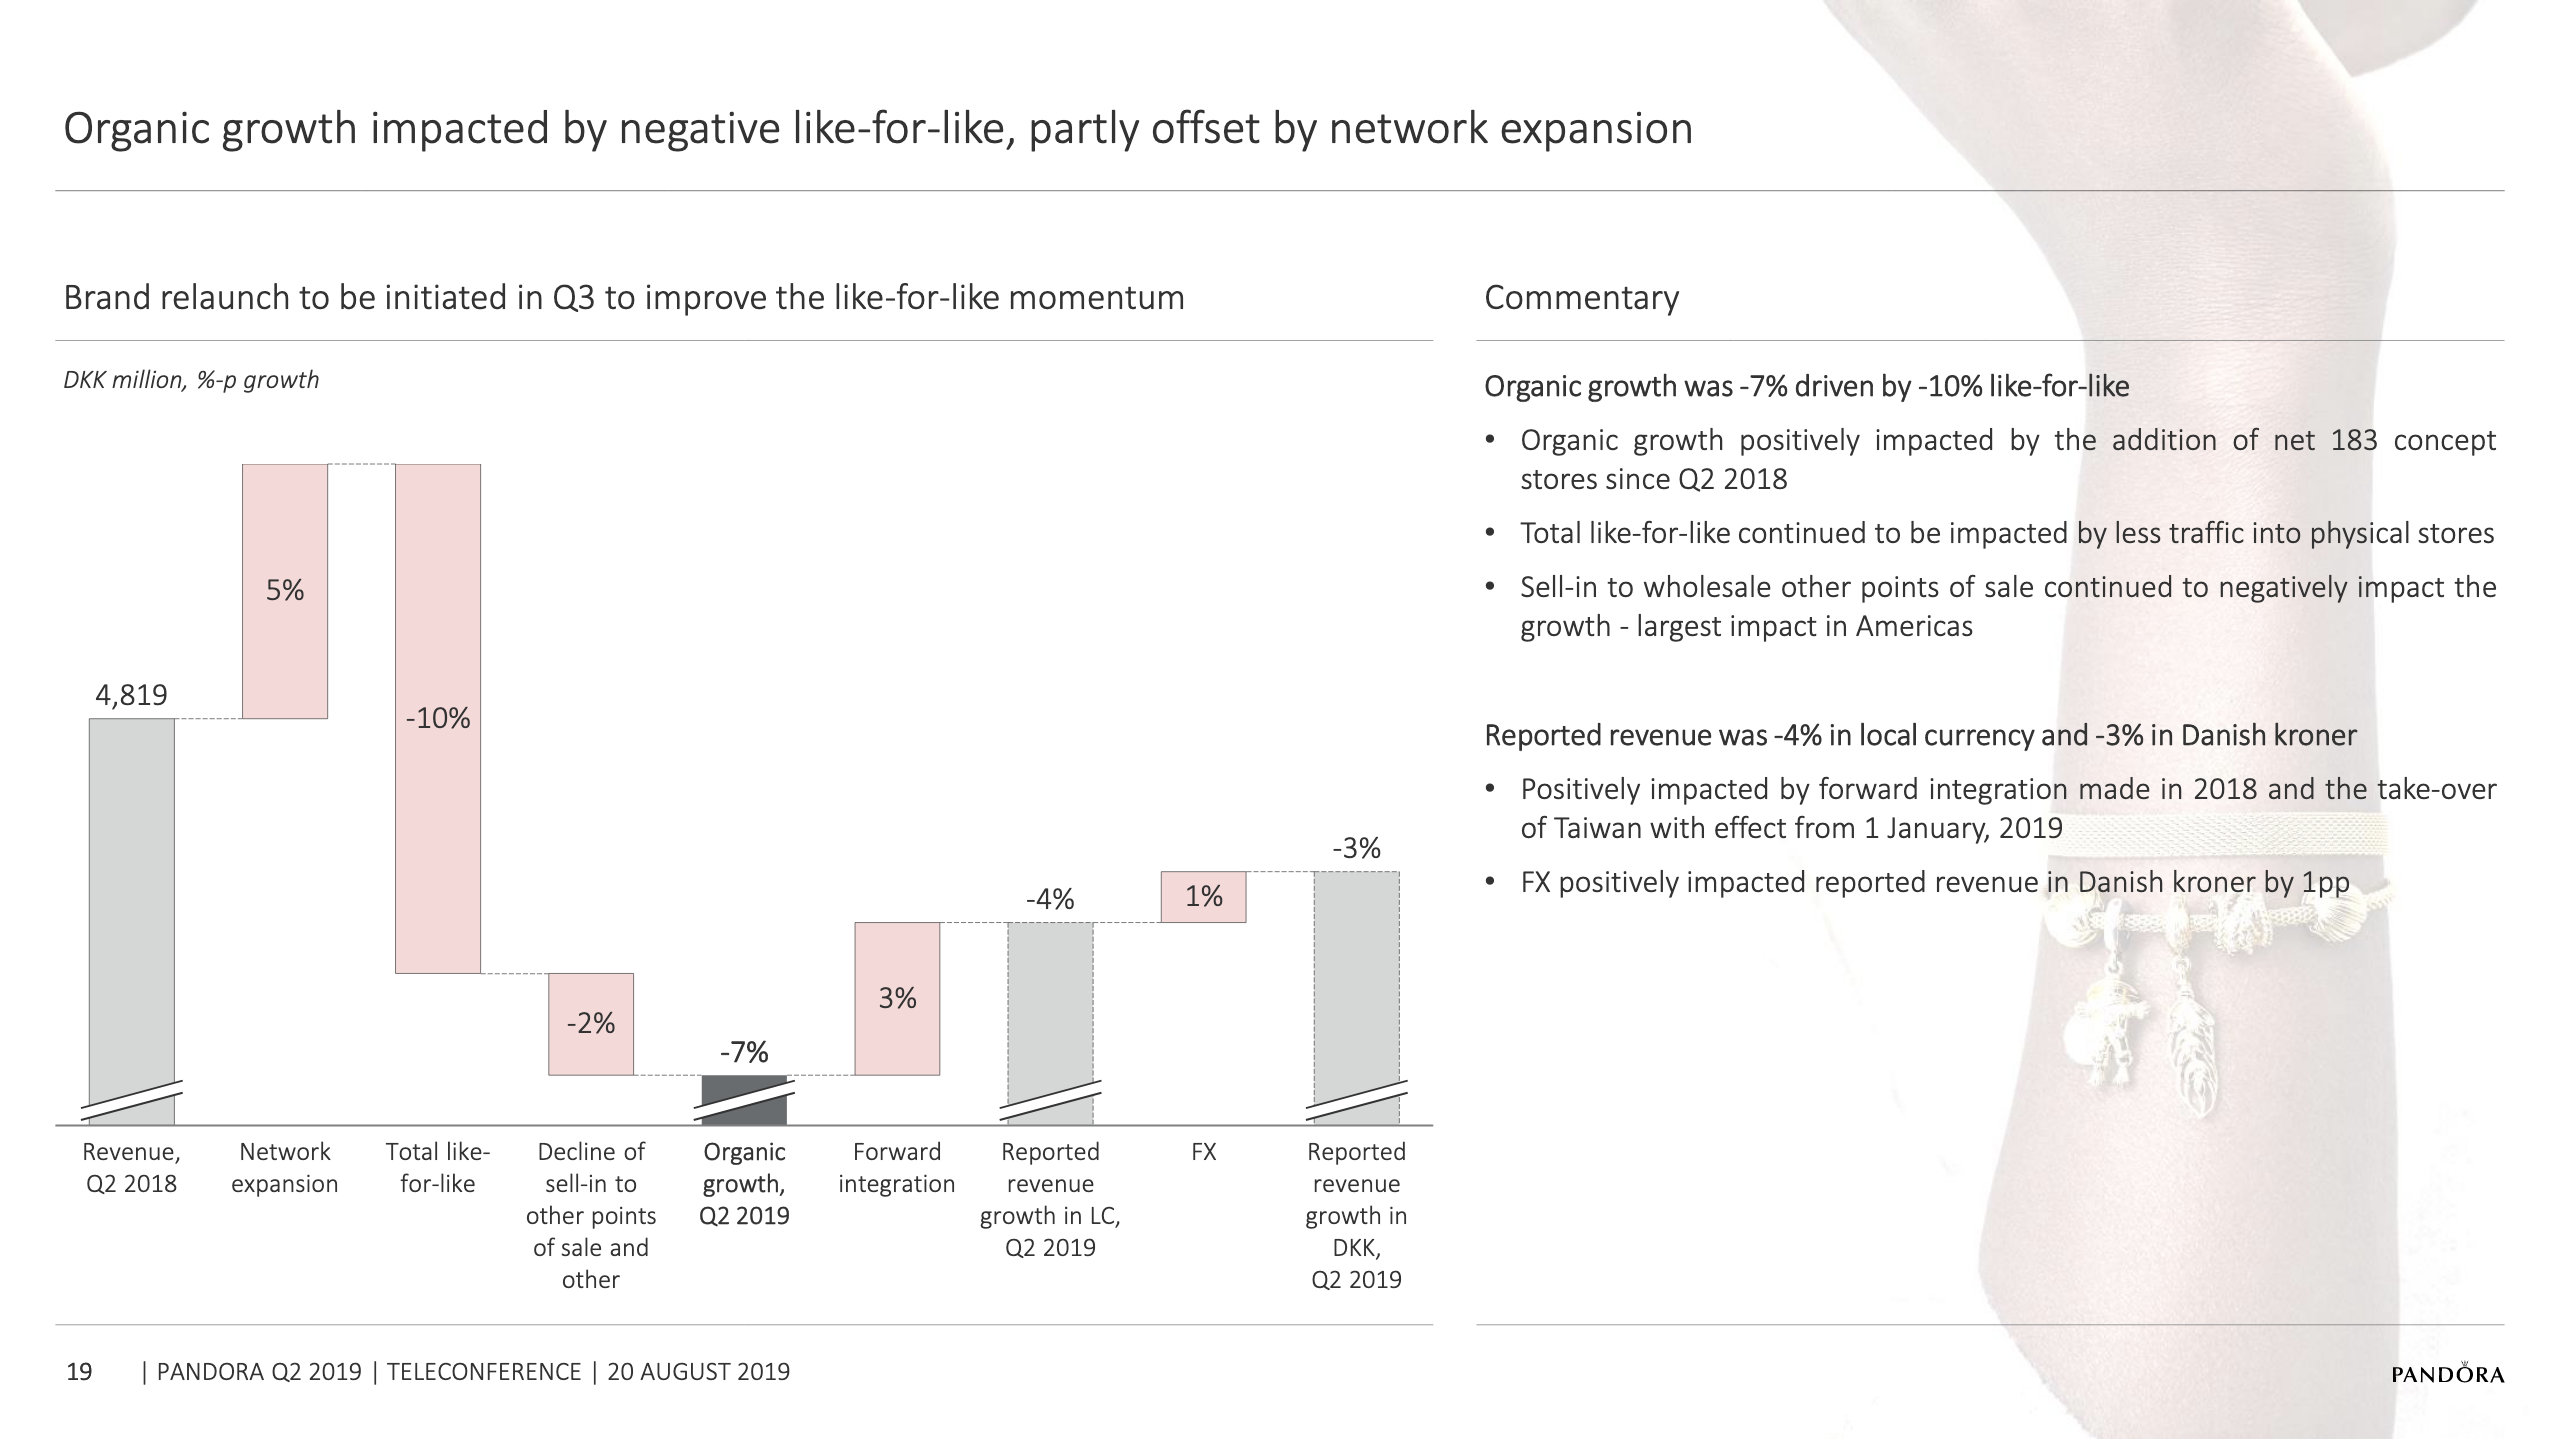
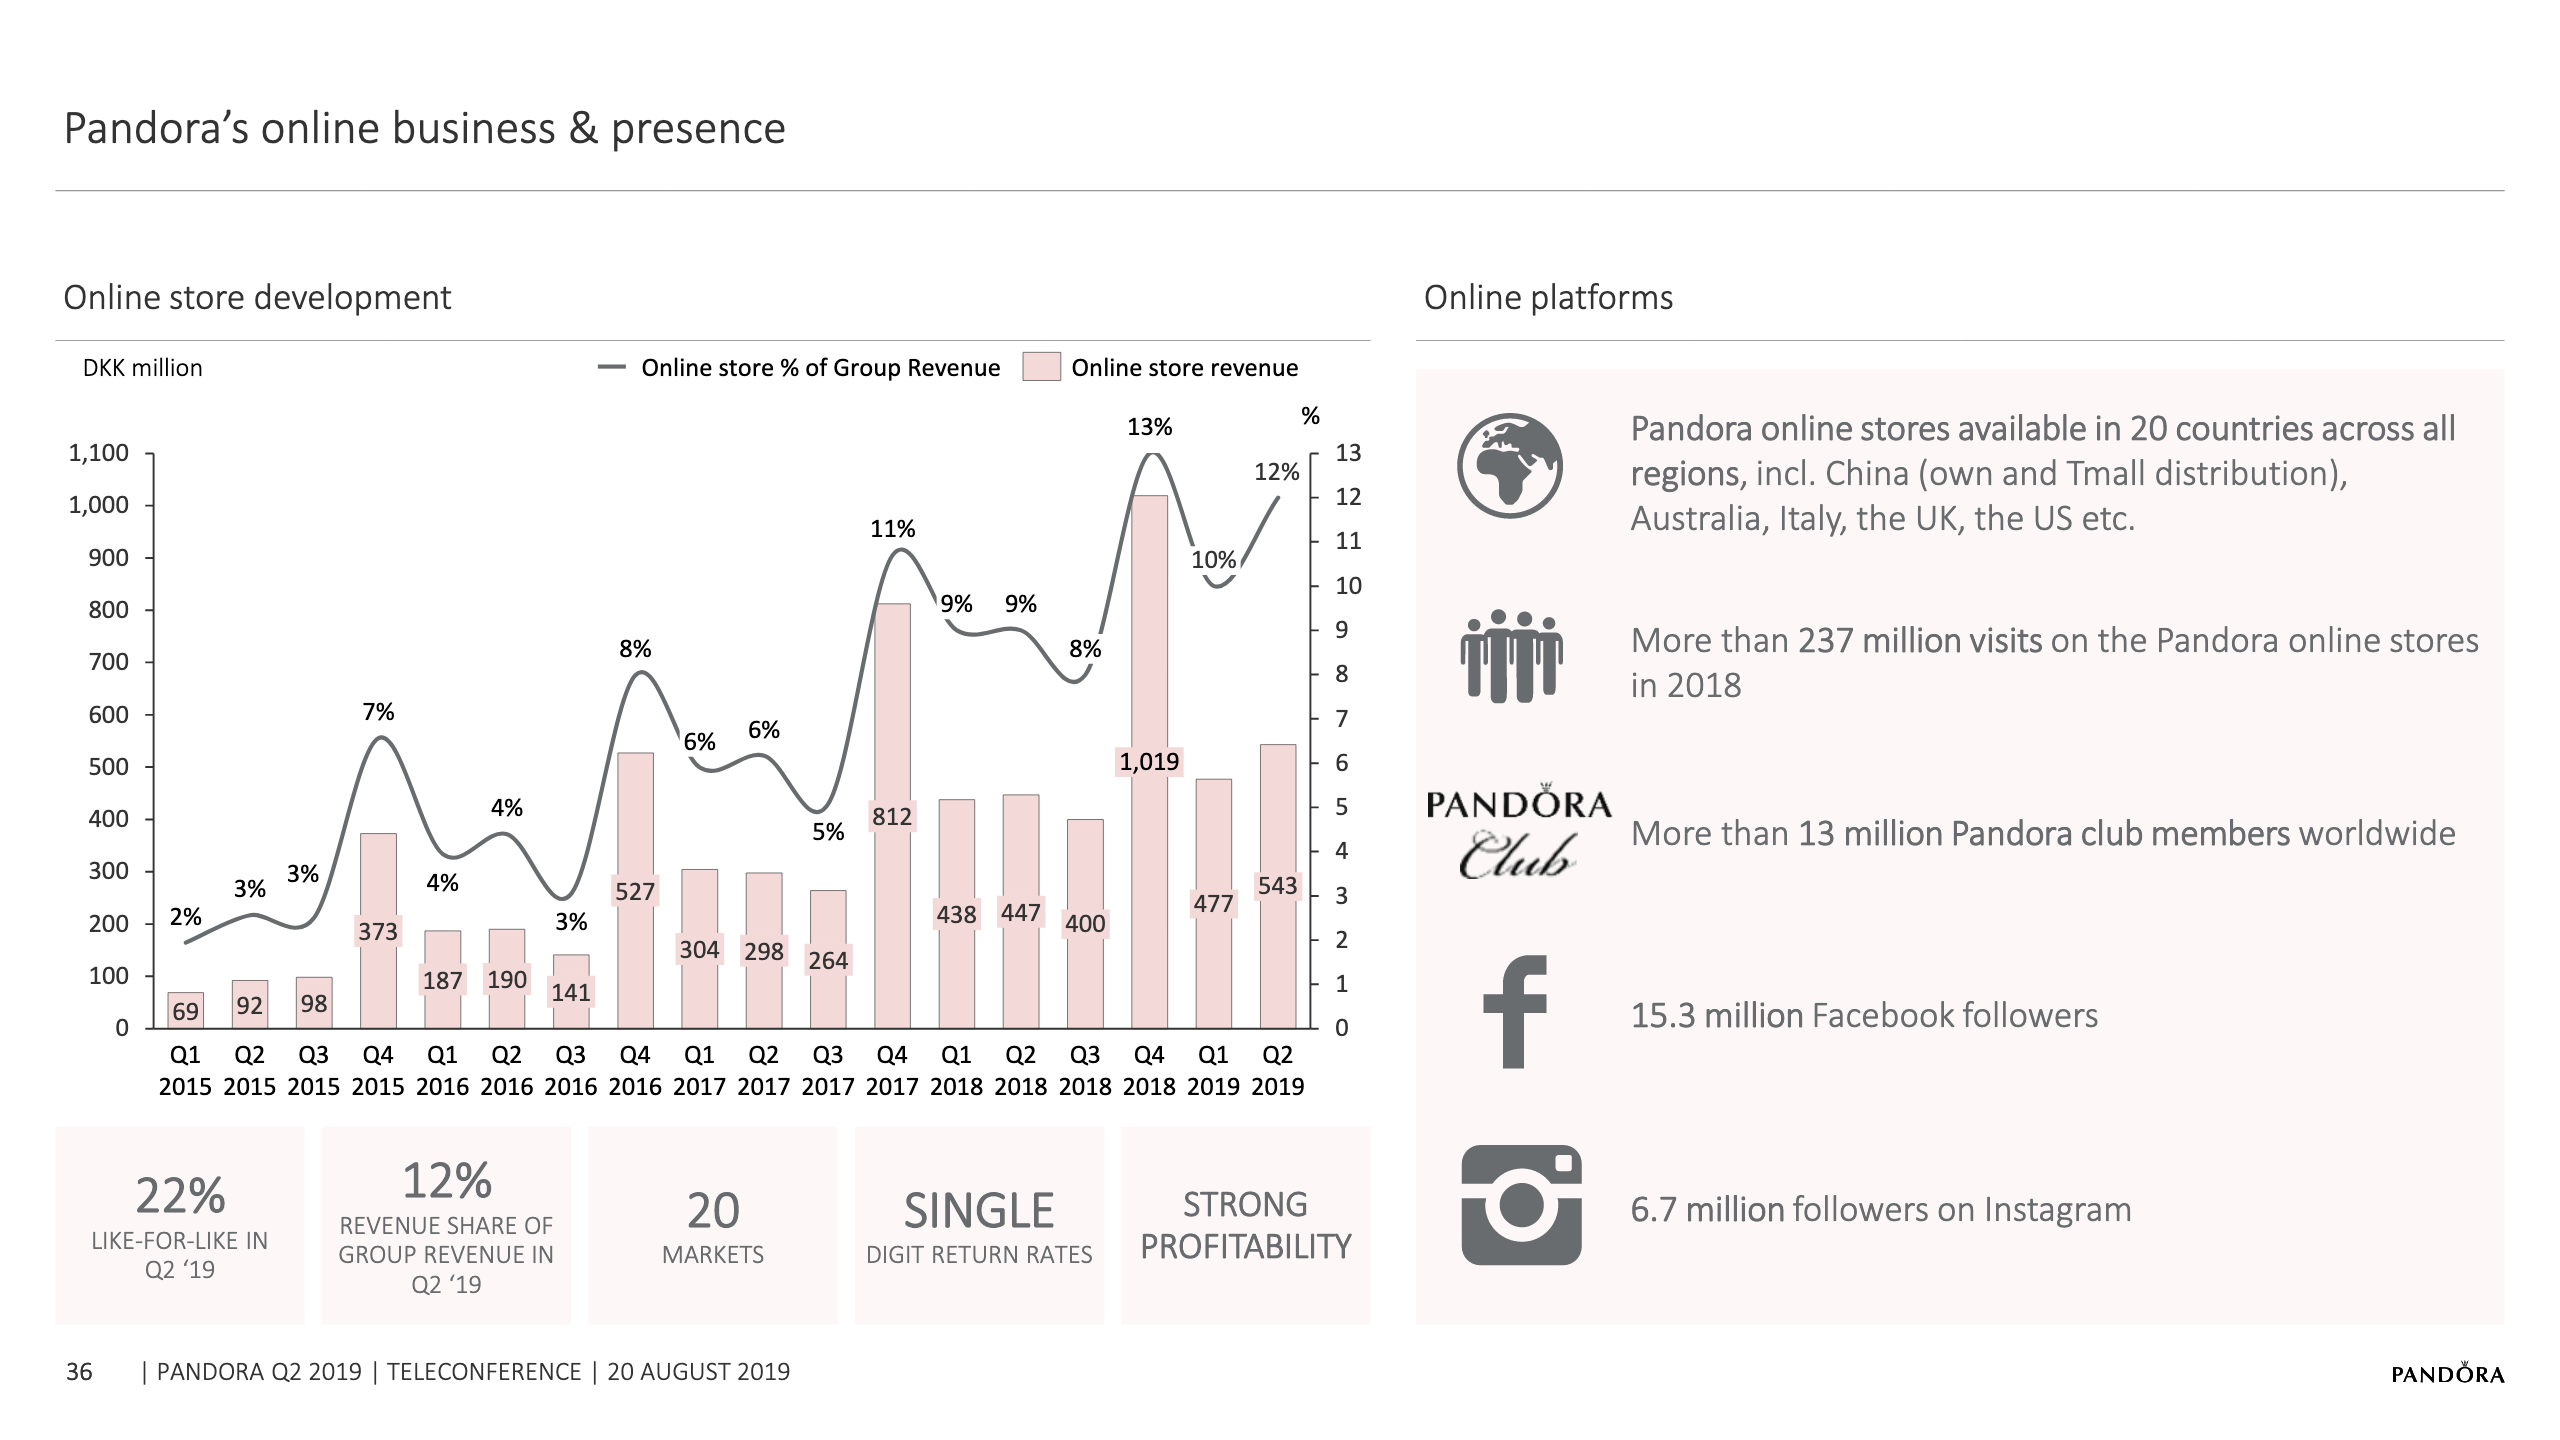
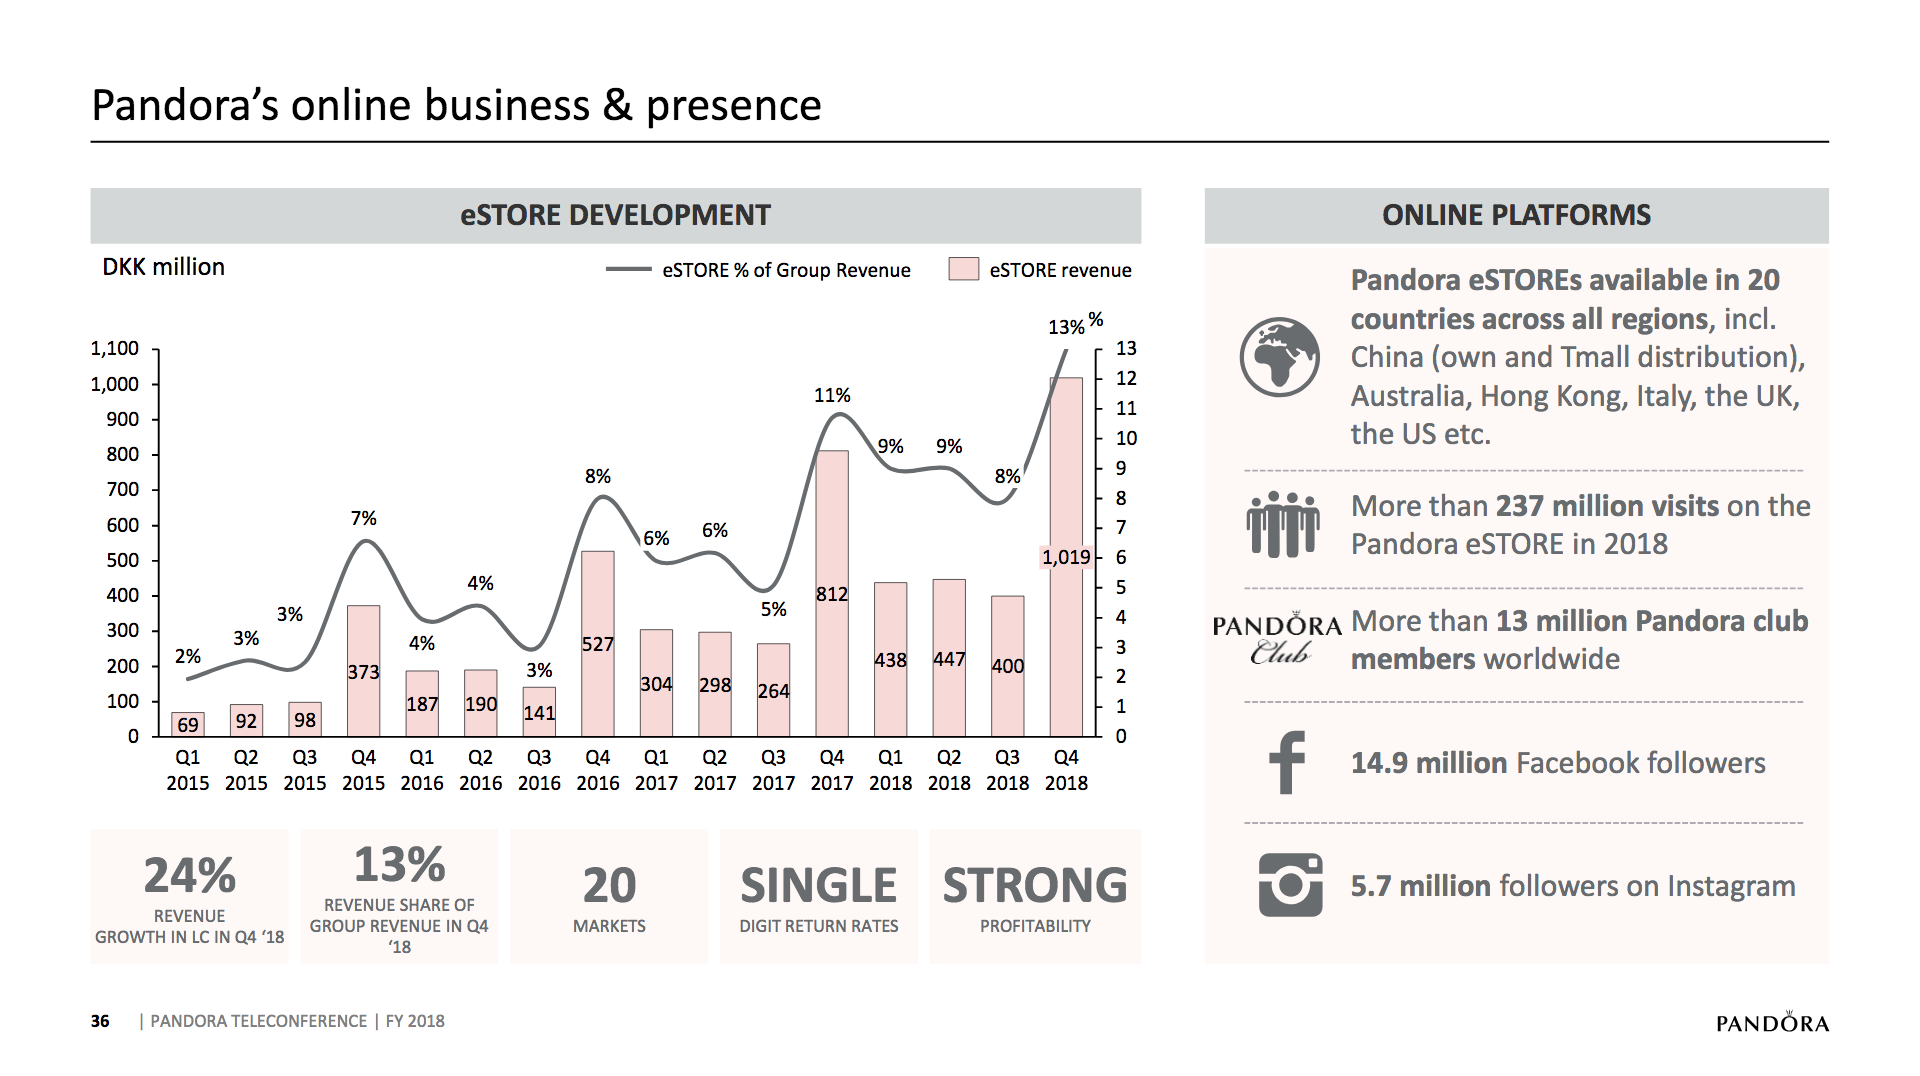
Organic growth was -7% and total like-for-like sales-out growth (like-for-like) was -10% in Q2 2019 driven by decreasing traffic into the physical stores. Like-for-like in Online Stores accelerated to 22%.
Key highlightsOrganic growth waterfall chartEBIT margin waterfall chartFinancial guidanceFull year 2019 organic growth guidance waterfall chartFull year 2019 EBIT margin guidance waterfall chartOnline store development
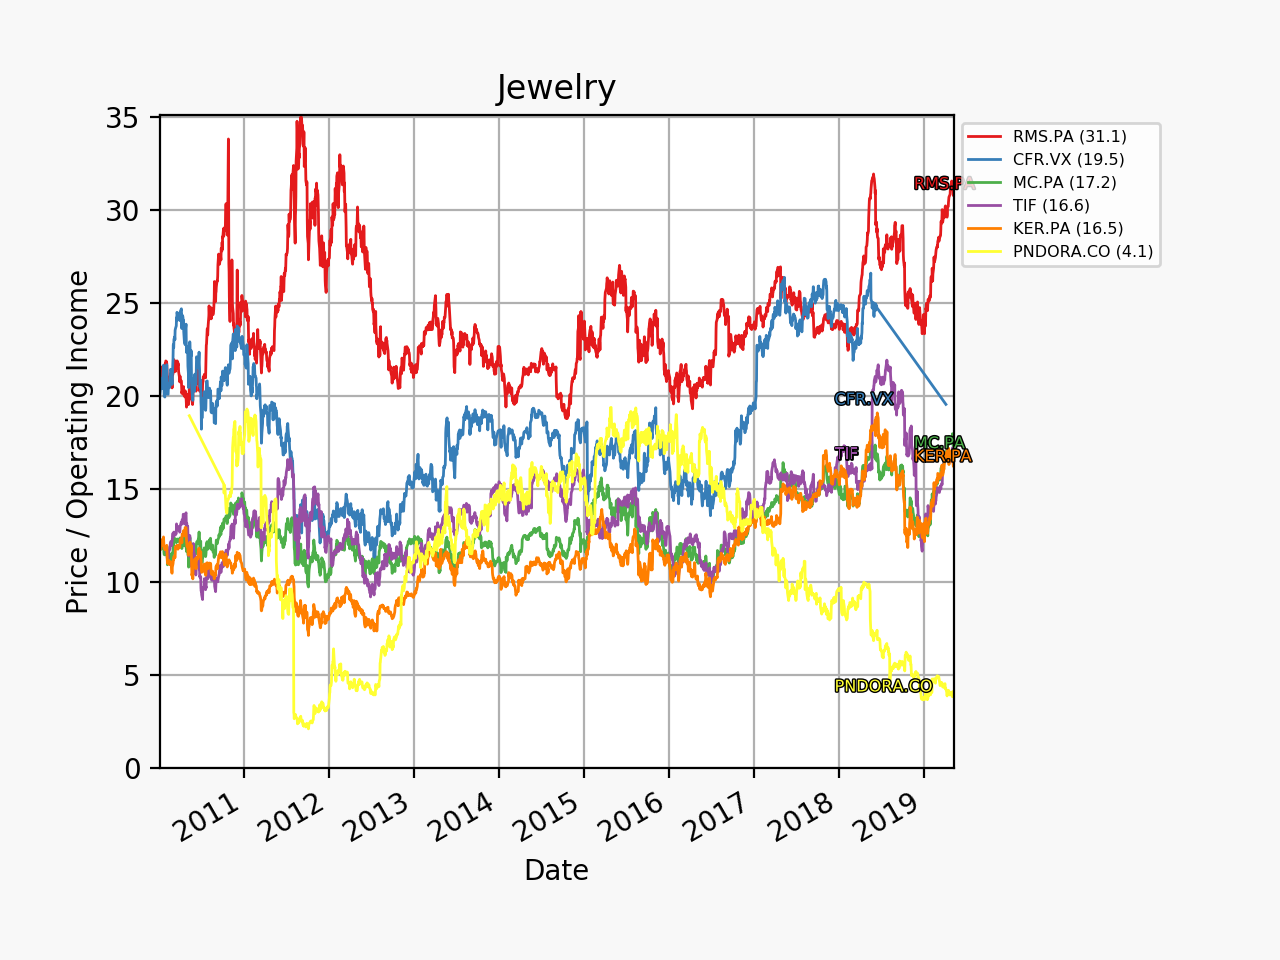
Pandora is still trading at rock bottom prices despite still having a very reasonable EBIT margin in the low mid twenties.
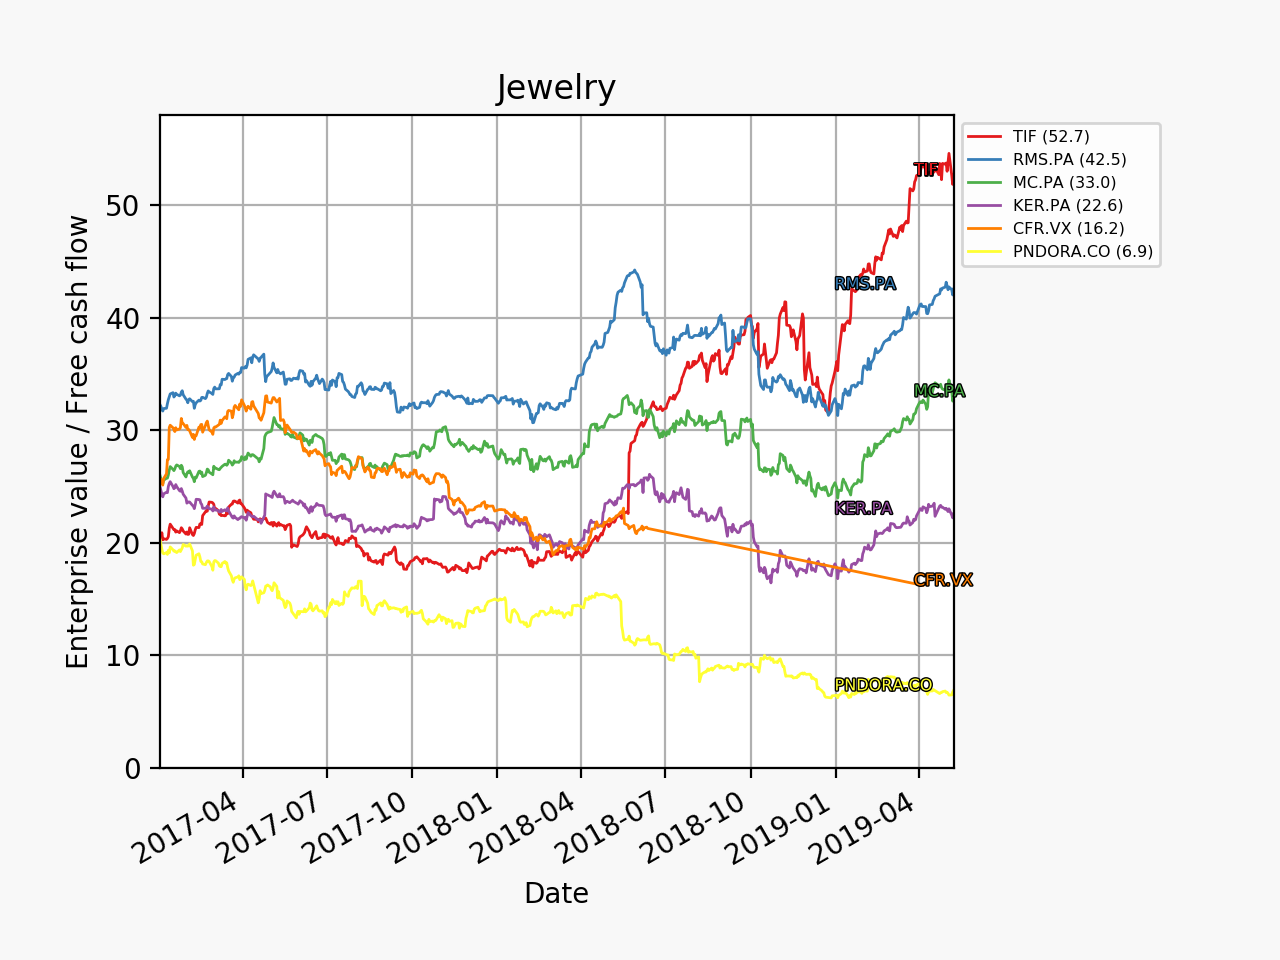
Time series of enterprise value relative to operating income for various jewellery and luxury good companies.Time series of enterprise value relative to free cash flow for various jewellery and luxury good companies.Time series of annual operating margin for various jewellery and luxury good companies.
Reuters – Recovery signs boost jeweler Pandora despite profit drop
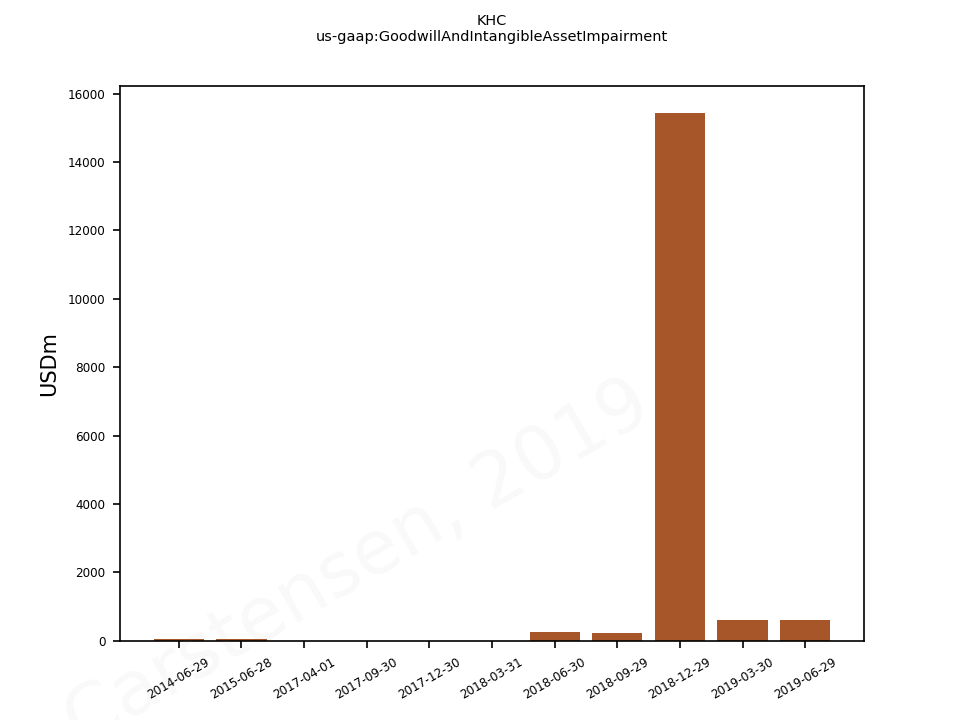
Kraft Heinz issued a press release on its Q2 earnings on August 8th and has with delay filed its 10Qs for Q1 and Q2 on August 14th. This article will cover a) the goodwill and asset impairment losses, b) the compression of profit margins, c) the debt and bond grade situation, d) the dividend and e) the current value of the company.
Goodwill and asset impairment losses
Additional goodwill write-down and asset impairment losses were observed in Q1 and Q2 in all geographic segments, although they were dwarfed by those in Q4.
Figure 1 – Impairment losses in each geographic segment in the recent quarters.Figure 2 – Goodwill and intangible asset impairment.Figure 3 – Goodwill impairment losses.Figure 4 – Goodwill. Figure 5 – Net Intangible Assets Excluding Goodwill.Figure 6a – Goodwill in the US segment.Figure 6b – Goodwill in the Canada segment.Figure 6c – Goodwill in the rest of the world segment.
The outgoing CFO David Knopf had the following comments during the Q&A session of the earnings call regarding future impairments.
On the impairment side, first off our impairment testing as you know occurs in 2Q every year. And so we performed our testing procedure this year after we file the 10-K current concurrent with preparing our Q1 and Q2 financial statements. And then to reiterate these are preliminary numbers that we disclose in 8-K. So the preliminary impairment charge in the first half were driven by two main factors. So first off, as you said we did have revised expectations in response to current market factors in some of our international businesses that were evaluated during the first quarter of 2019 as we developed these five-year plans. And as a reminder these are EMEA East reporting unit, LTA Exports reporting unit and Brazil where we had an impairment. Secondly, we also had the application of a higher discount rate to reflect the sustained decline in our stock price since the start of the year. And also you should keep in mind that we did start the year at nearly $60 billion of goodwill and indefinite-lived intangibles with less than 20% attrition relative to carrying value. So what that means is there’s going to be risk of future impairments, given any change in forecasts or modeling assumption can particularly trigger that.
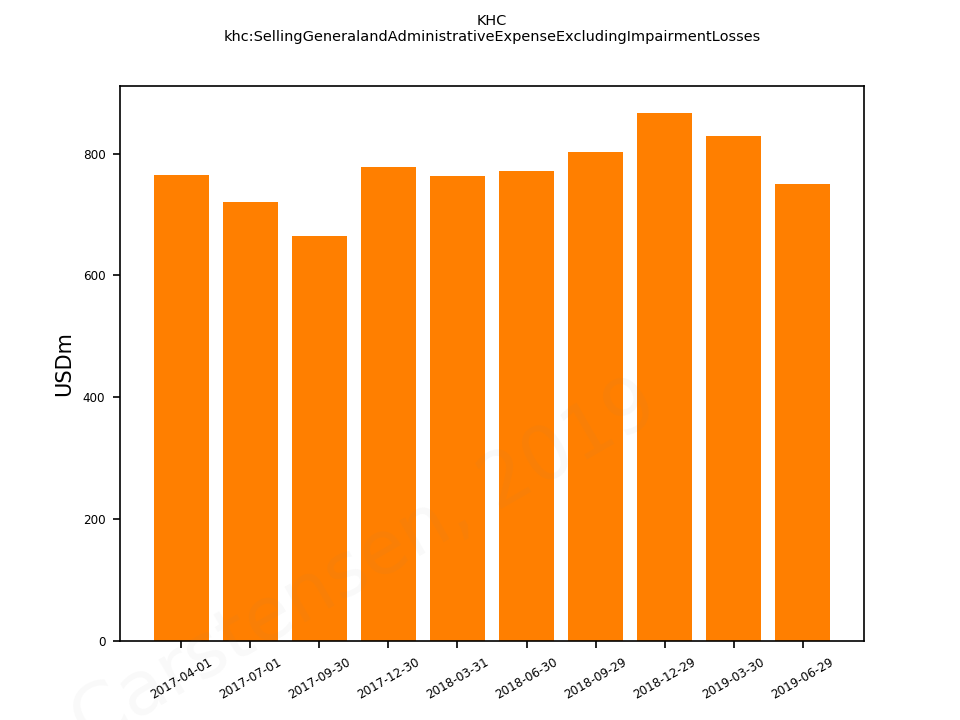
Profit margins
COGS and SG&A excluding impairment losses have been kept somewhat steady in absolute terms for the past quarters but not as a percentage of revenue, because revenue is down. The profit margins are thus down.
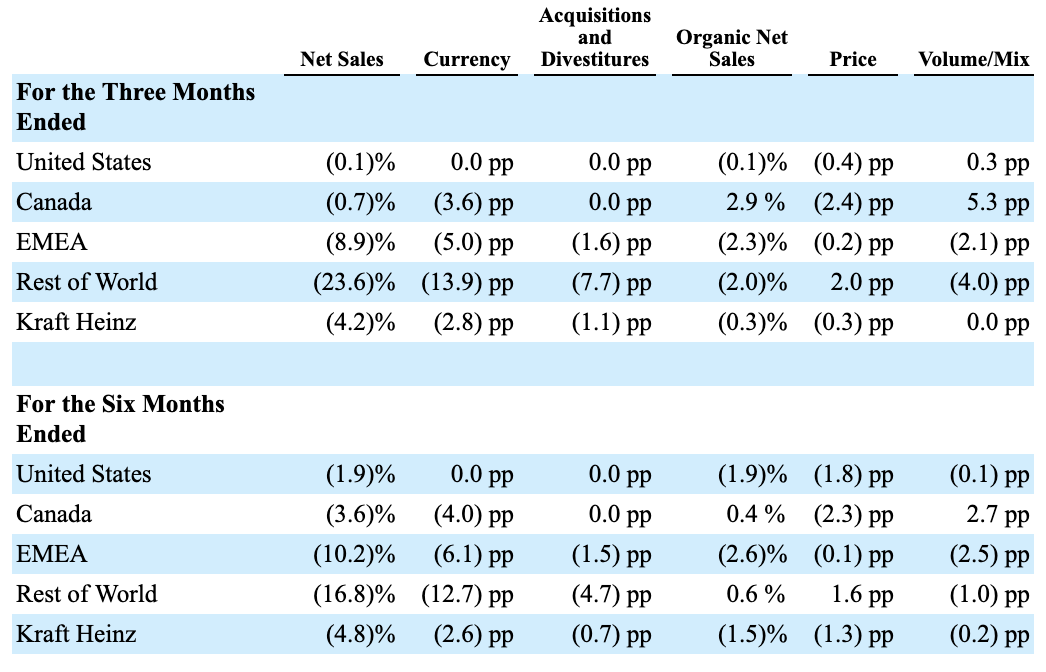
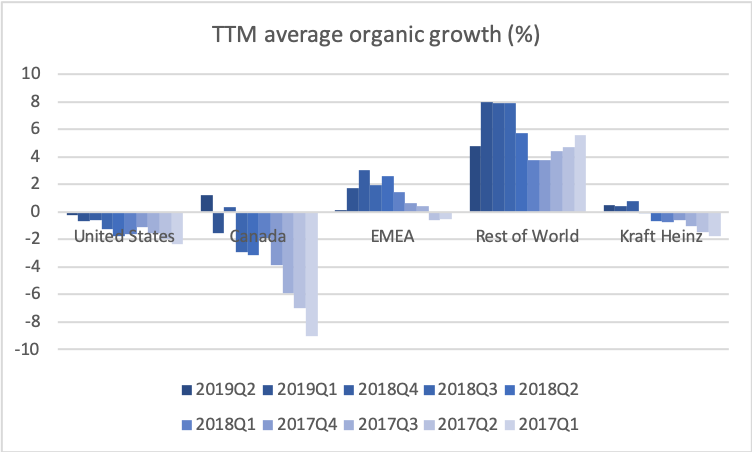
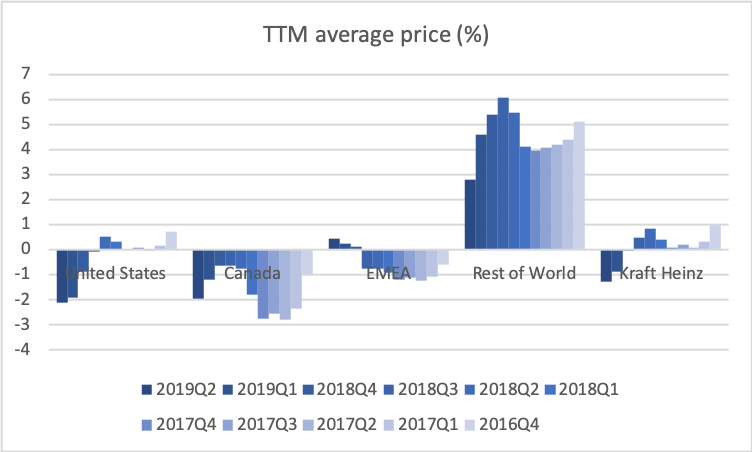
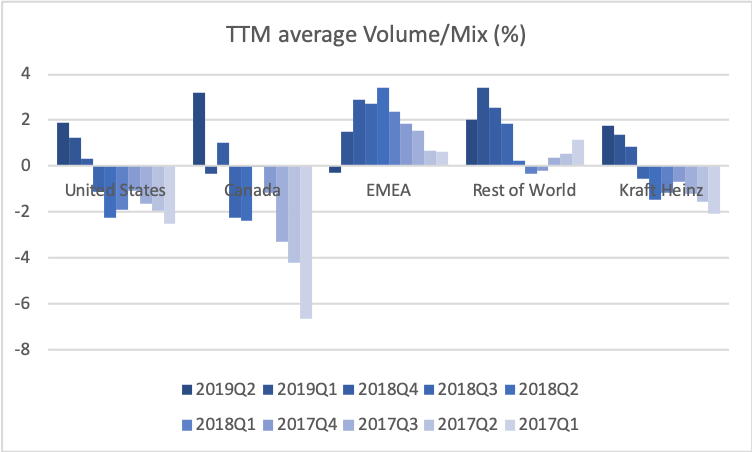
The drop in revenue is caused by a drop in primarily price but also volume/mix in certain geographic segments. The outgoing CFO David Knopf had the following comments on organic growth.
From a total company perspective, organic net sales were down 1.5% in the first half, including an adverse impact of approximately 1.2 percentage points from retail inventory reductions primarily in the U.S. and Canada. Volume mix was relatively flat in the first half as the reduction in retail inventory levels more than offset consumption growth in the United States, Canada and Latin America. Pricing was negative, down 1.3 percentage points, driven by three factors. The first factor driving lower pricing was unfavorable timing of promotional expense, representing roughly 80 basis point decrease in price on a global basis, including approximately 90 basis points in the U.S.
…
The second factor was key commodity driven pricing in North America, representing roughly 30 basis point drag on global pricing in the first half. And third, the remainder primarily reflects continued promotional support behind selects for select U.S. categories, mainly in our Launchables and frozen categories.
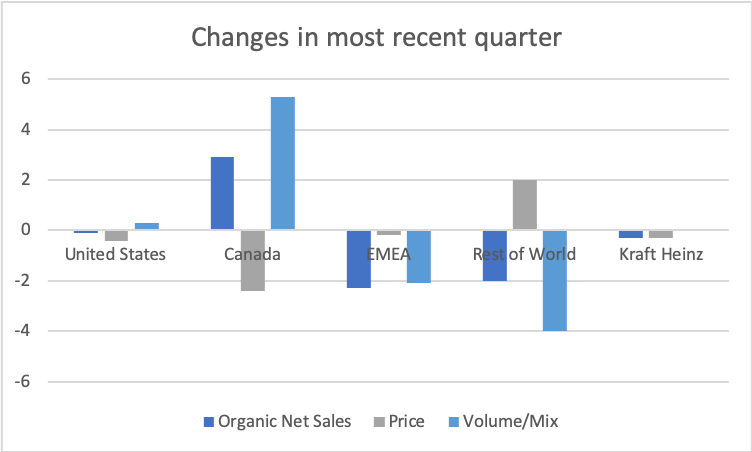
Table 1 – Changes to organic net sales in the most recent quarter and the most recent half year.Figure 11a – Changes to organic sales, price and volume/mix in the most recent quarter. Figure 11b – Changes to organic growth (average for TTM) over time. Figure 11c – Changes to price (average for TTM) over time.Figure 11d – Changes to volume/mix (average for TTM) over time.
Product segments
The product segments taking the biggest hits are “Condiments and sauces” and “Infant and nutrition”.
Figure 12 – TTM net sales (USDm) in each product segment over time.
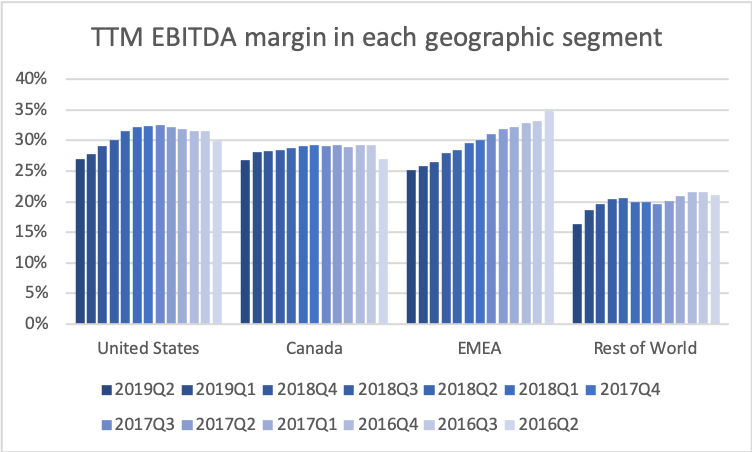
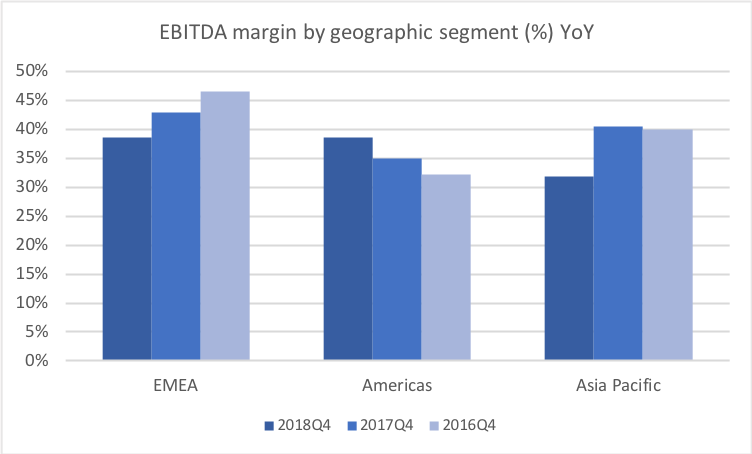
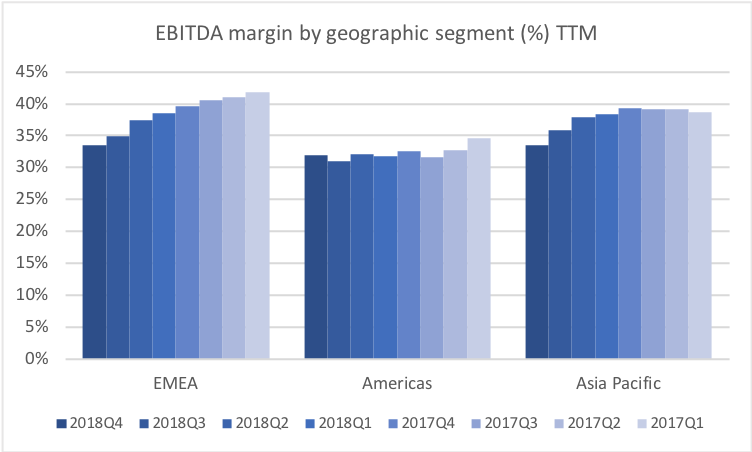
Geographic segments and EBITDA margins
Adjusted EBITDA decreased 19.3 percent versus the year-ago period to $3.0 billion. The CEO had the following comments regarding EBITDA and profitability.
With respect to profitability, we spoke about our first quarter and indeed our first half being up against our toughest EBITDA comparisons for the year. This reflected our expected net inflation curve, stepped up fixed cost investments and retail channel growth, marketing and our people, as well as pricing not beginning to take effect until the second quarter.
First and foremost the company had a significant decline in adjusted EBITDA margins from a peak of 29.4% in the fiscal 2017 to roughly 24.5% for the trailing 12 months through the end of June this year. This was driven by a combination of inflation in our supply chain, including packaging, freight, overtime, and maintenance costs, as well as significant step up in fixed costs to support sales growth with price increases lagging higher costs.
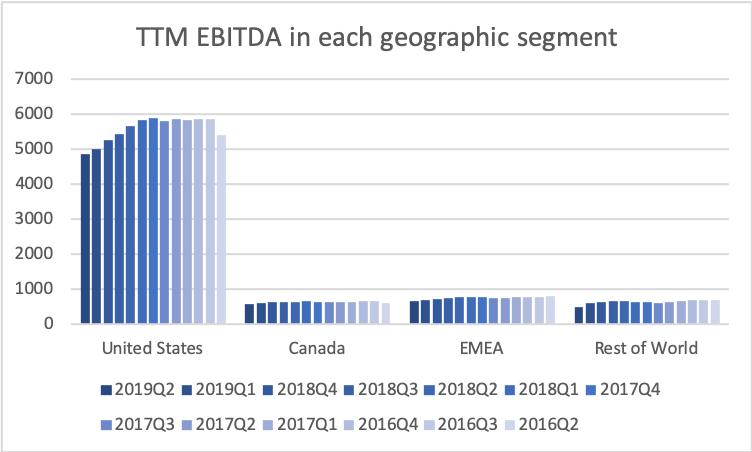
EBITDA is down in all geographic segments; US -10.7%, Canada -17.0%, EMEA -17.1%, rest of the world -52%. The latter partly because of the Venezuelan Bolivar and the divestiture of Heinz India and the brands Complan, GluconD, Sampriti, Nycil to Zydus Cadila.
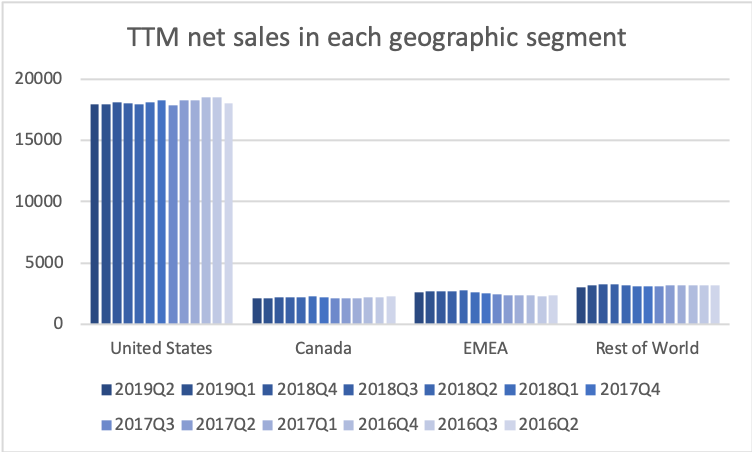
Figure 13a – TTM EBITDA margins in each geographic segmentFigure 13b – TTM EBITDA (USDm) in each geographic segmentFigure 13c – TTM net sales (USDm) in each geographic segment
The comments to each of the geographic segments in the 10Qs are as follows.
US – Segment Adjusted EBITDA decreased 10.7% to $1.3 billion for the three months ended June 29, 2019 compared to $1.4 billion for the three months ended June 30, 2018. This decrease was primarily due to cost inflation in manufacturing and procurement, and the unfavorable volume/mix due to higher sales of lower margin products in the current period.
Canada – Segment Adjusted EBITDA decreased 17.0% to $143 million for the three months ended June 29, 2019 compared to $173 million for the three months ended June 30, 2018 partially due to the unfavorable impact of foreign currency (2.8 pp). Excluding the currency impact, Segment Adjusted EBITDA decreased primarily due to lower pricing and higher input costs, partially offset by favorable volume/mix.
EMEA – Segment Adjusted EBITDA decreased 17.1% to $171 million for the three months ended June 29, 2019 compared to $206 million for the three months ended June 30, 2018, including the unfavorable impact of foreign currency (4.6 pp). Excluding the currency impact, the decrease was primarily due to higher supply chain costs, lower Organic Net Sales, and investments in marketing and people.
Rest of the world – Segment Adjusted EBITDA decreased 52.1% to $102 million for the three months ended June 29, 2019 compared to $213 million for the three months ended June 30, 2018 including the unfavorable impact of foreign currency (30.2 pp, including 26.5pp from the devaluation of the Venezuelan bolivar). Excluding the currency impact, the decrease in Segment Adjusted EBITDA was primarily due to the sale of the Heinz India business, higher supply chain costs, and lower sales in Asia Pacific.
Debt situation and bond rating
The CFO had the following comment on the debt situation during his opening remarks.
From a forward-looking perspective, we have now completed the two divestitures we previously announced: India nutritional beverages and Canada natural cheese. These divestitures resulted in a combined after-tax proceeds of more than $1.5 billion. And we remain committed to using those proceeds to further deleverage and strengthen our balance sheet.
Long term debt has remained somewhat constant for several quarters and as a consequence so have the interest expenses.
Figure 14 – End of quarter long term debt
Interest expenses are approximately $300M per quarter, which is approximately 5% of total net sales.
Figure 15 – Quarterly interest expenses (USDm).
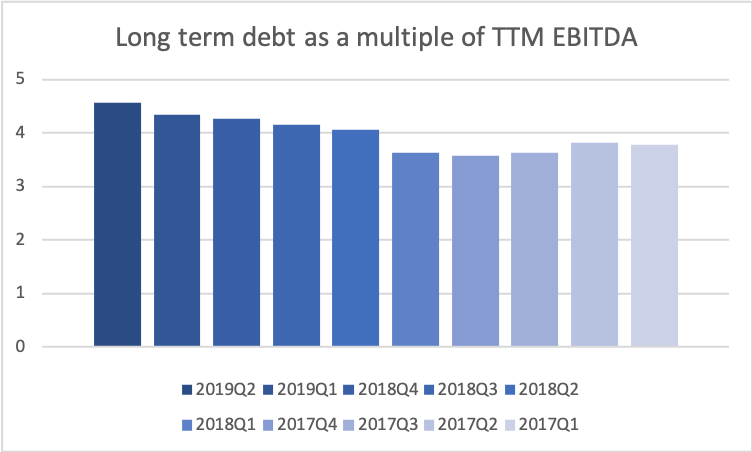
As a consequence of the EBITDA being down and the long term debt not decreasing noticeably the debt to EBITDA ratio is up.
Figure 16 – The ratio between long term debt and TTM EBITDA over time
S&P warned Kraft Heinz on August 23rd that their bond rating might be cut to junk, if they don’t cut their debt. The CEO Miguel Patricio had the following comment in his opening remarks during the earnings call.
We absolutely remain committed to our investment grade credit rating.
Debt was paid in the 3rd quarter of 2018 and 2019 and more debt is maturing in 2020; below according to the most recent 10Q.
Figure 17 – Repayment of long term debt
We repaid approximately $350 million aggregate principal amount of senior notes on August 9, 2019.
We have aggregate principal amount of senior notes of approximately $900 million maturing in February 2020 and approximately 800 million Canadian dollars and $1.5 billion maturing in July 2020. We expect to fund these long-term debt repayments primarily with cash on hand, cash generated from our operating activities, proceeds from our divestiture in Canada, and potential new issuances of short-term or long-term debt.
Dividend and payout ratio
The CFO had the following comment on the dividend during the Q&A part of the earnings call.
As we said before we are committed to our investment grade rating and we firmly believe that our business today generates sufficient free cash flow to support both delevering organically over time as we’ve committed as well as to support the current dividend payout that we have. On top of that we have taken actions as you know earlier this year to accelerate the delevering producing our dividend and successfully divesting India beverages and Canada cheese businesses a couple of digits multiple. So again we feel that the business currently generates sufficient cash flow to cover the dividend and also to delever organically.
The payout ratio will probably be firmly above 80% for the time being.
Figure 18 – Income, cash flow, dividends and payout ratio.
Valuation
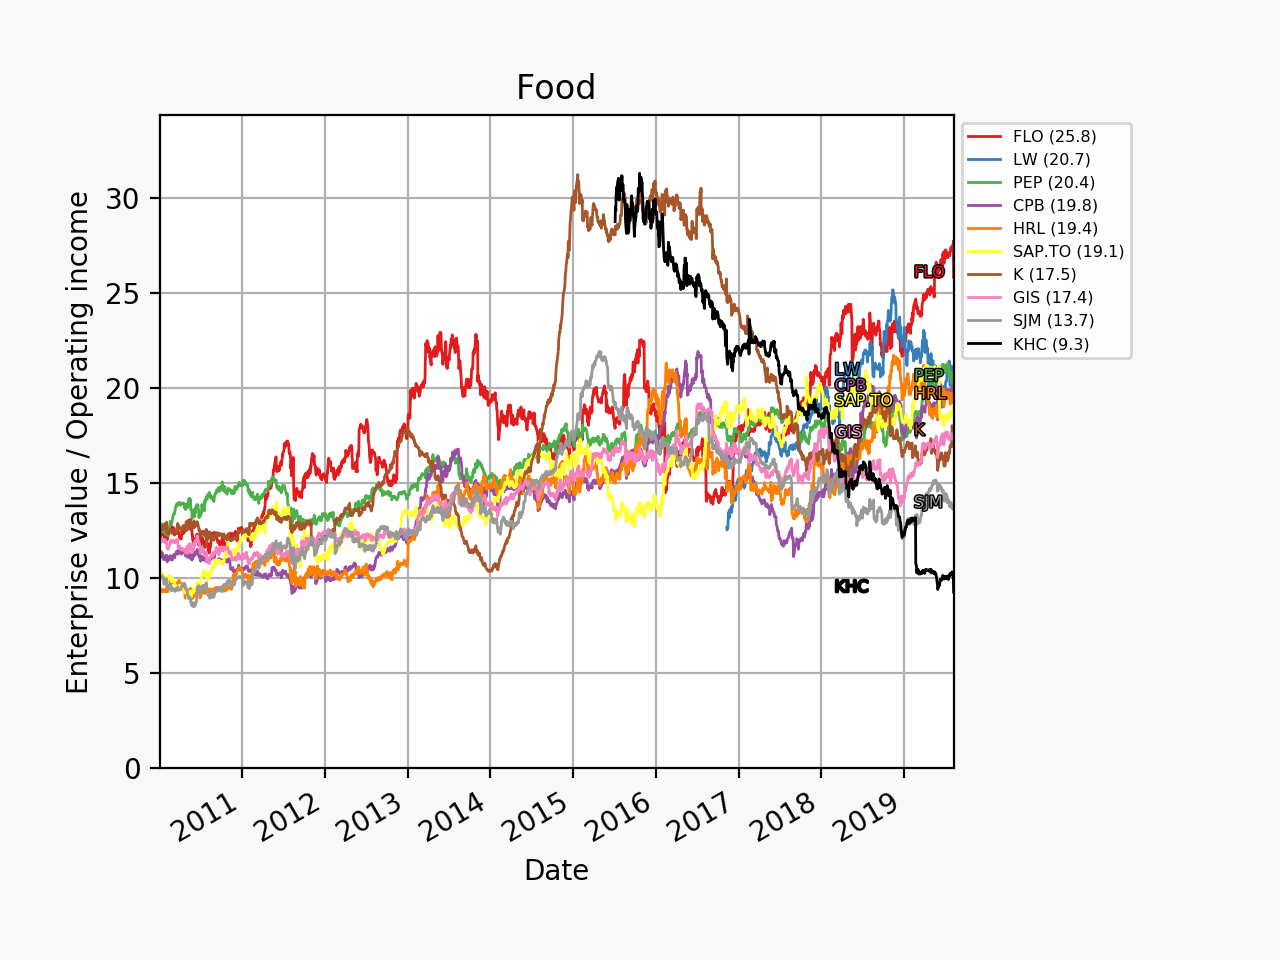
In terms of for example enterprise value to operating income Kraft Heinz is trading at absolute rock bottom prices in historical terms and relative to its peers.
Figure 19a – Time series of enterprise value relative to operating income.Figure 19b – Time series of enterprise value relative to net sales.
This low valuation should of course be seen in the context of the debt load, but also in the context of operating margins of 20% still being at the top of the industry.
Figure 20a – Quarterly time series of operating margin for packaged food companies.Figure 20b – Annual time series of operating margin for packaged food companies.
Summary
If there were to be additional significant impairment losses to report it is probably not too far fetched to think that the CEO would have reported them by now. If there are no significant impairment losses in Q3 this could be a positive catalyst. And vice versa.
Media coverage
Nightly Business Report – August 8, 2019
Bloomberg 08Aug – Kraft Heinz, Tired of ‘Fire Fighting,’ Feels Wall Street Heat
Bloomberg 08Aug – Kraft Heinz Hadn’t Hit Bottom After All
Reuters 08Aug – Kraft Heinz withdraws outlook after dismal results
Teva Pharmaceuticals issued a press release on their Q2 earnings on August 7th.
Below are excerpts from the earnings call with CEO Kåre Schultz and outgoing CFO Michael McClellan and relevant figures and slides. Further below the CGRP migraine drugs Ajovy® from Teva, Aimovig® from Amgen and Emgality® from Lilly are discussed. The legacy litigations regarding opioids and pricing are not discussed here, but Teva has a $646 million provision for legal settlements following their $85M opioid settlement, which is further described in the earnings transcript and in this Bloomberg article.
Earnings call
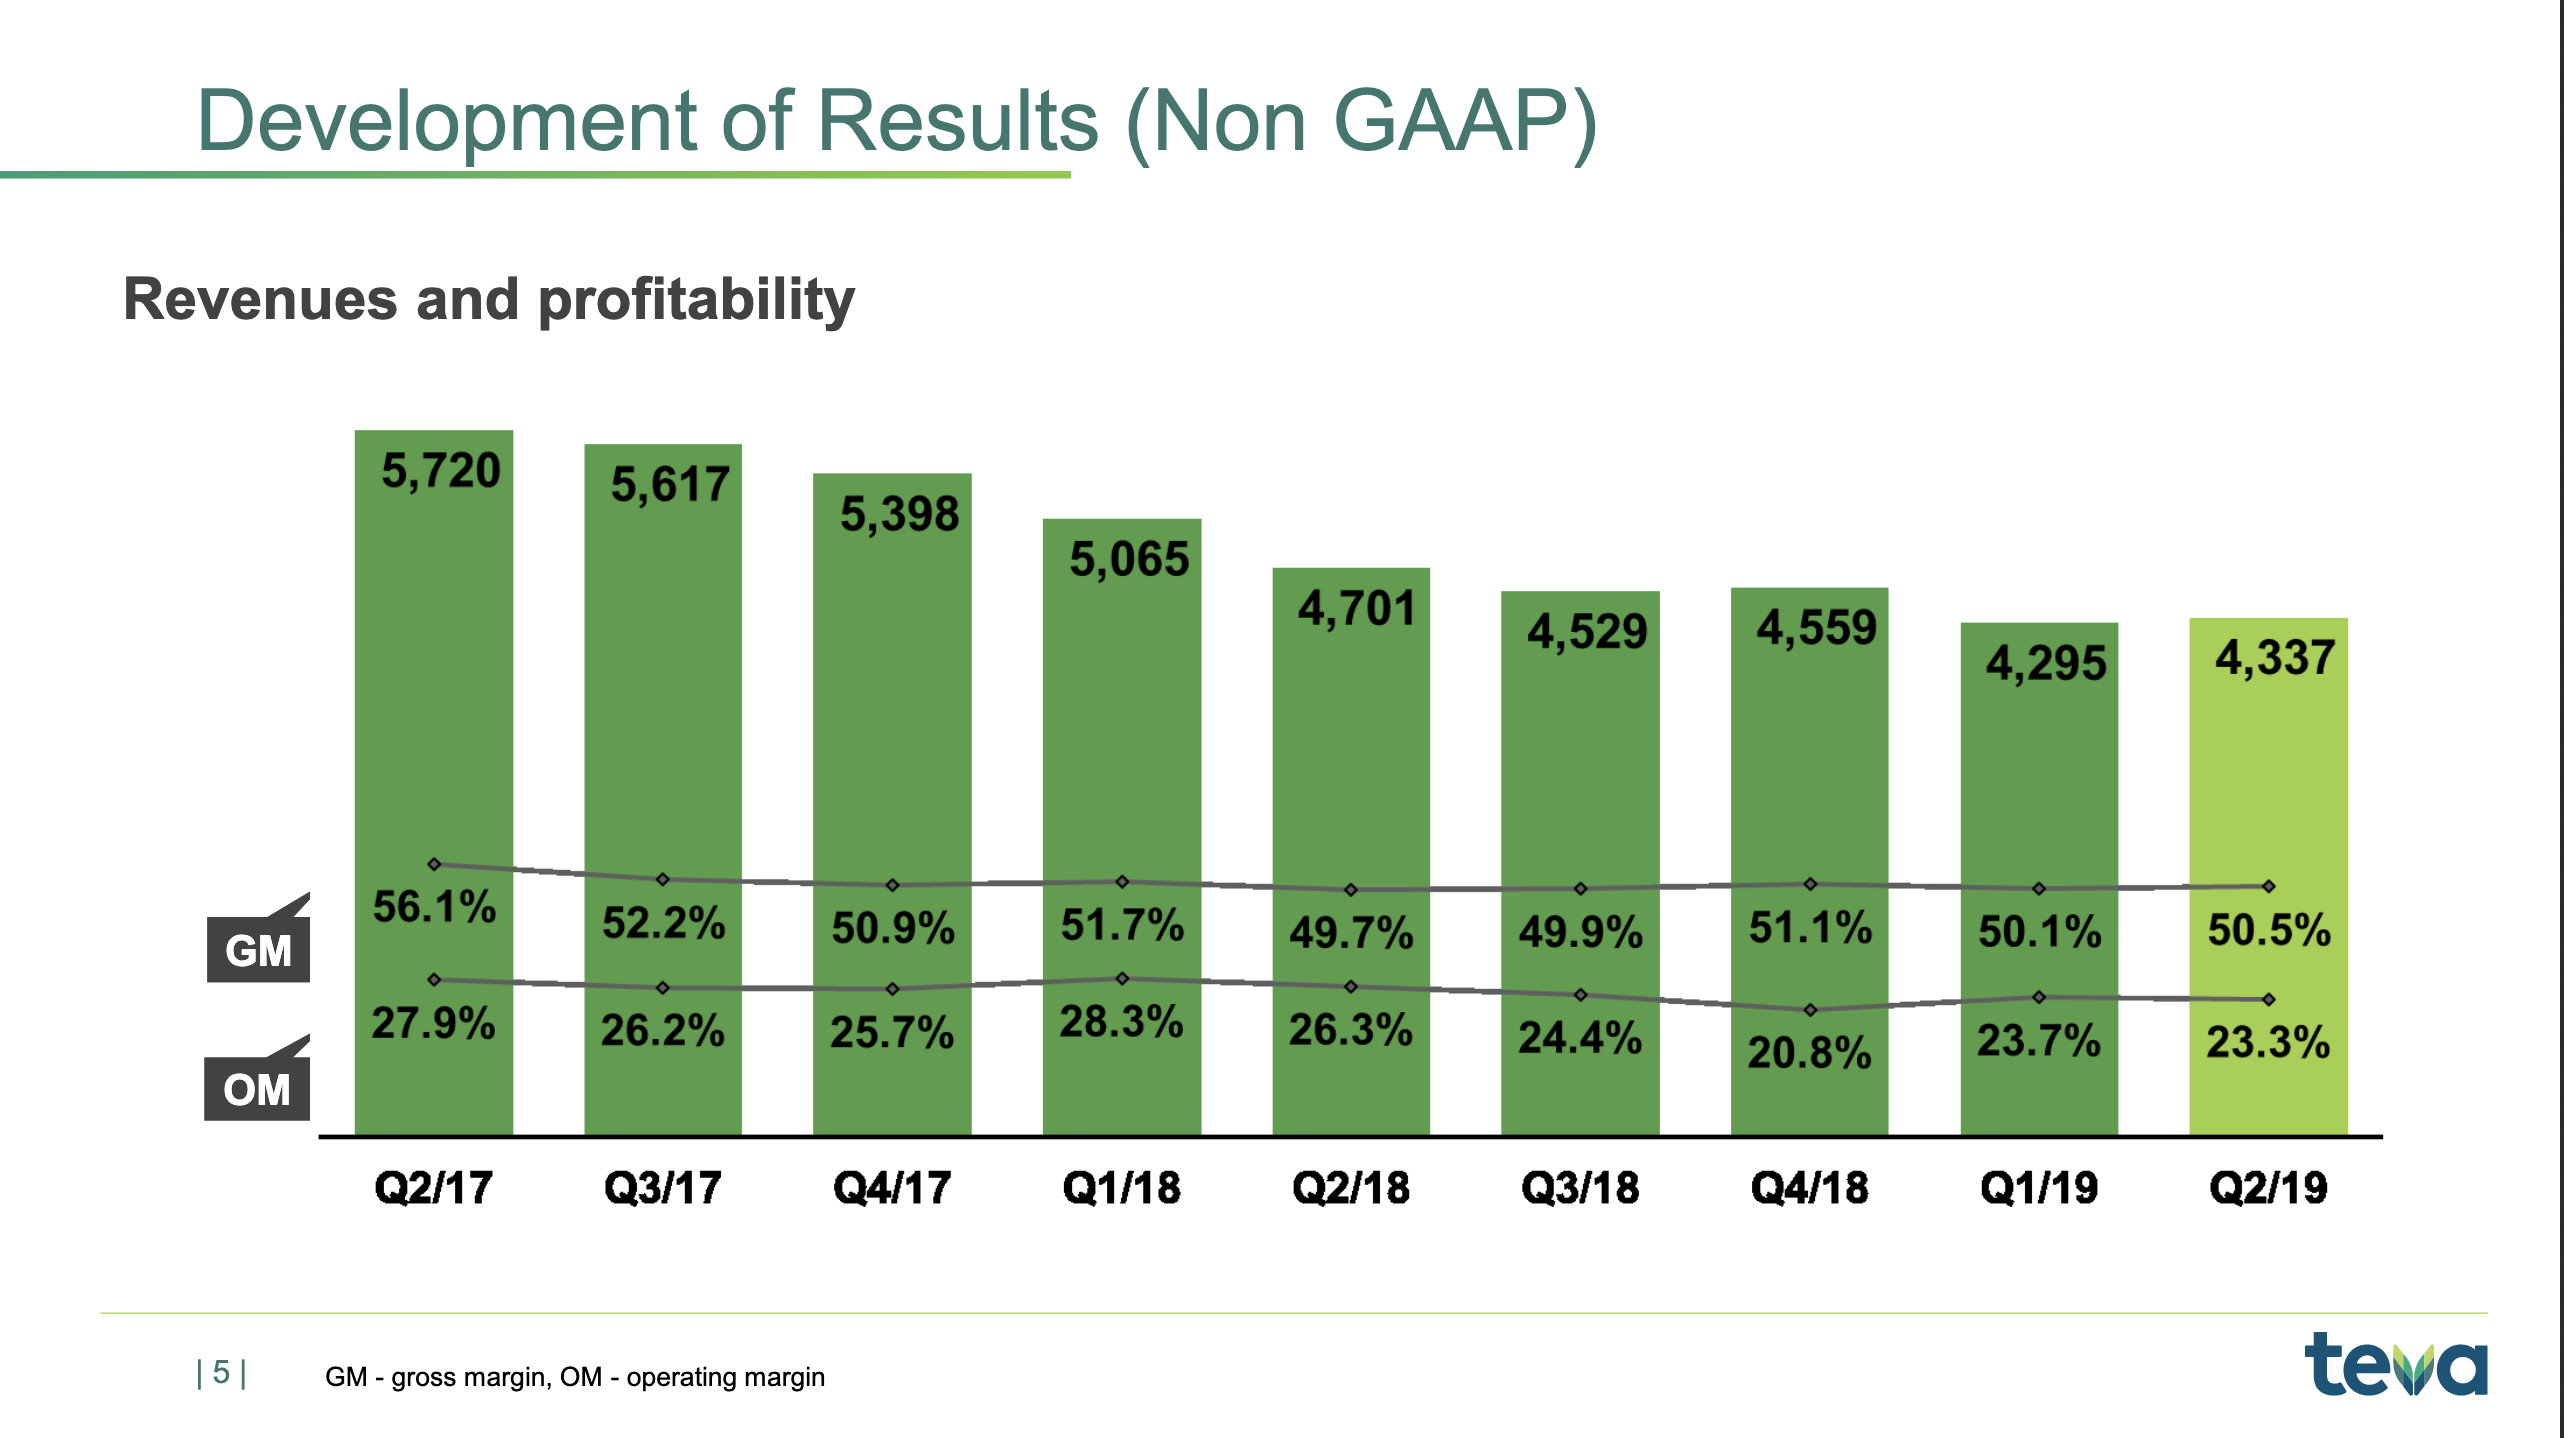
If we go to historical development of revenue and profitability, I’d just like to remind you of the situation in late-2017 when I joined, where we saw generic competition coming in on COPAXONE, and we basically knew that revenues were going to fall roughly $4 billion on a yearly basis. That’s also what you see. You see the quarterly revenue coming down from some $5.3 billion to $4.3 billion.
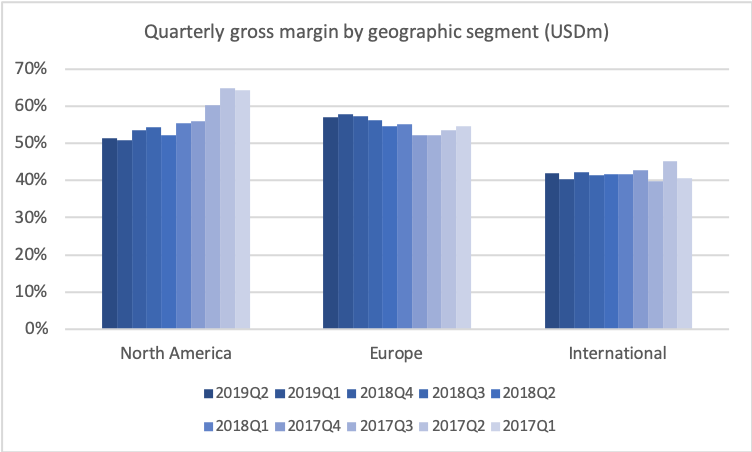
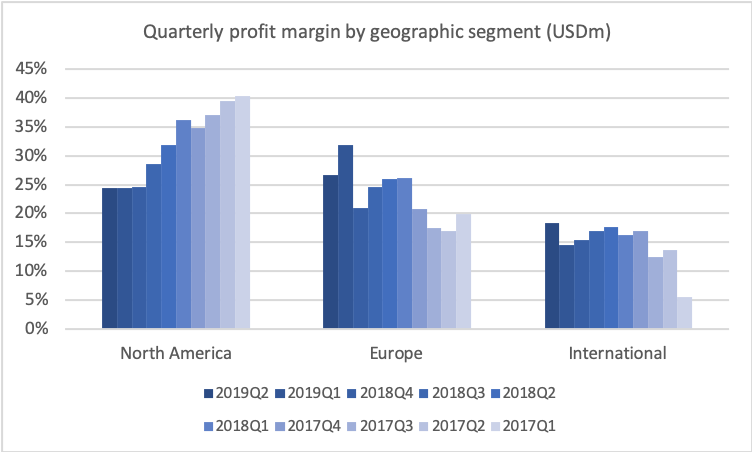
But you also see now the beginning of the trough, as I’ve been calling it, the trough of 2019, which is basically where the revenue stabilises. You also see that the gross margin that was coming down is also stabilising now just above 50%, and the operating margin stabilising now around 23%, which is of course not our long-term target. Our long-term target, as I’ll get back to, is 27%, so we still need to see improvement there.
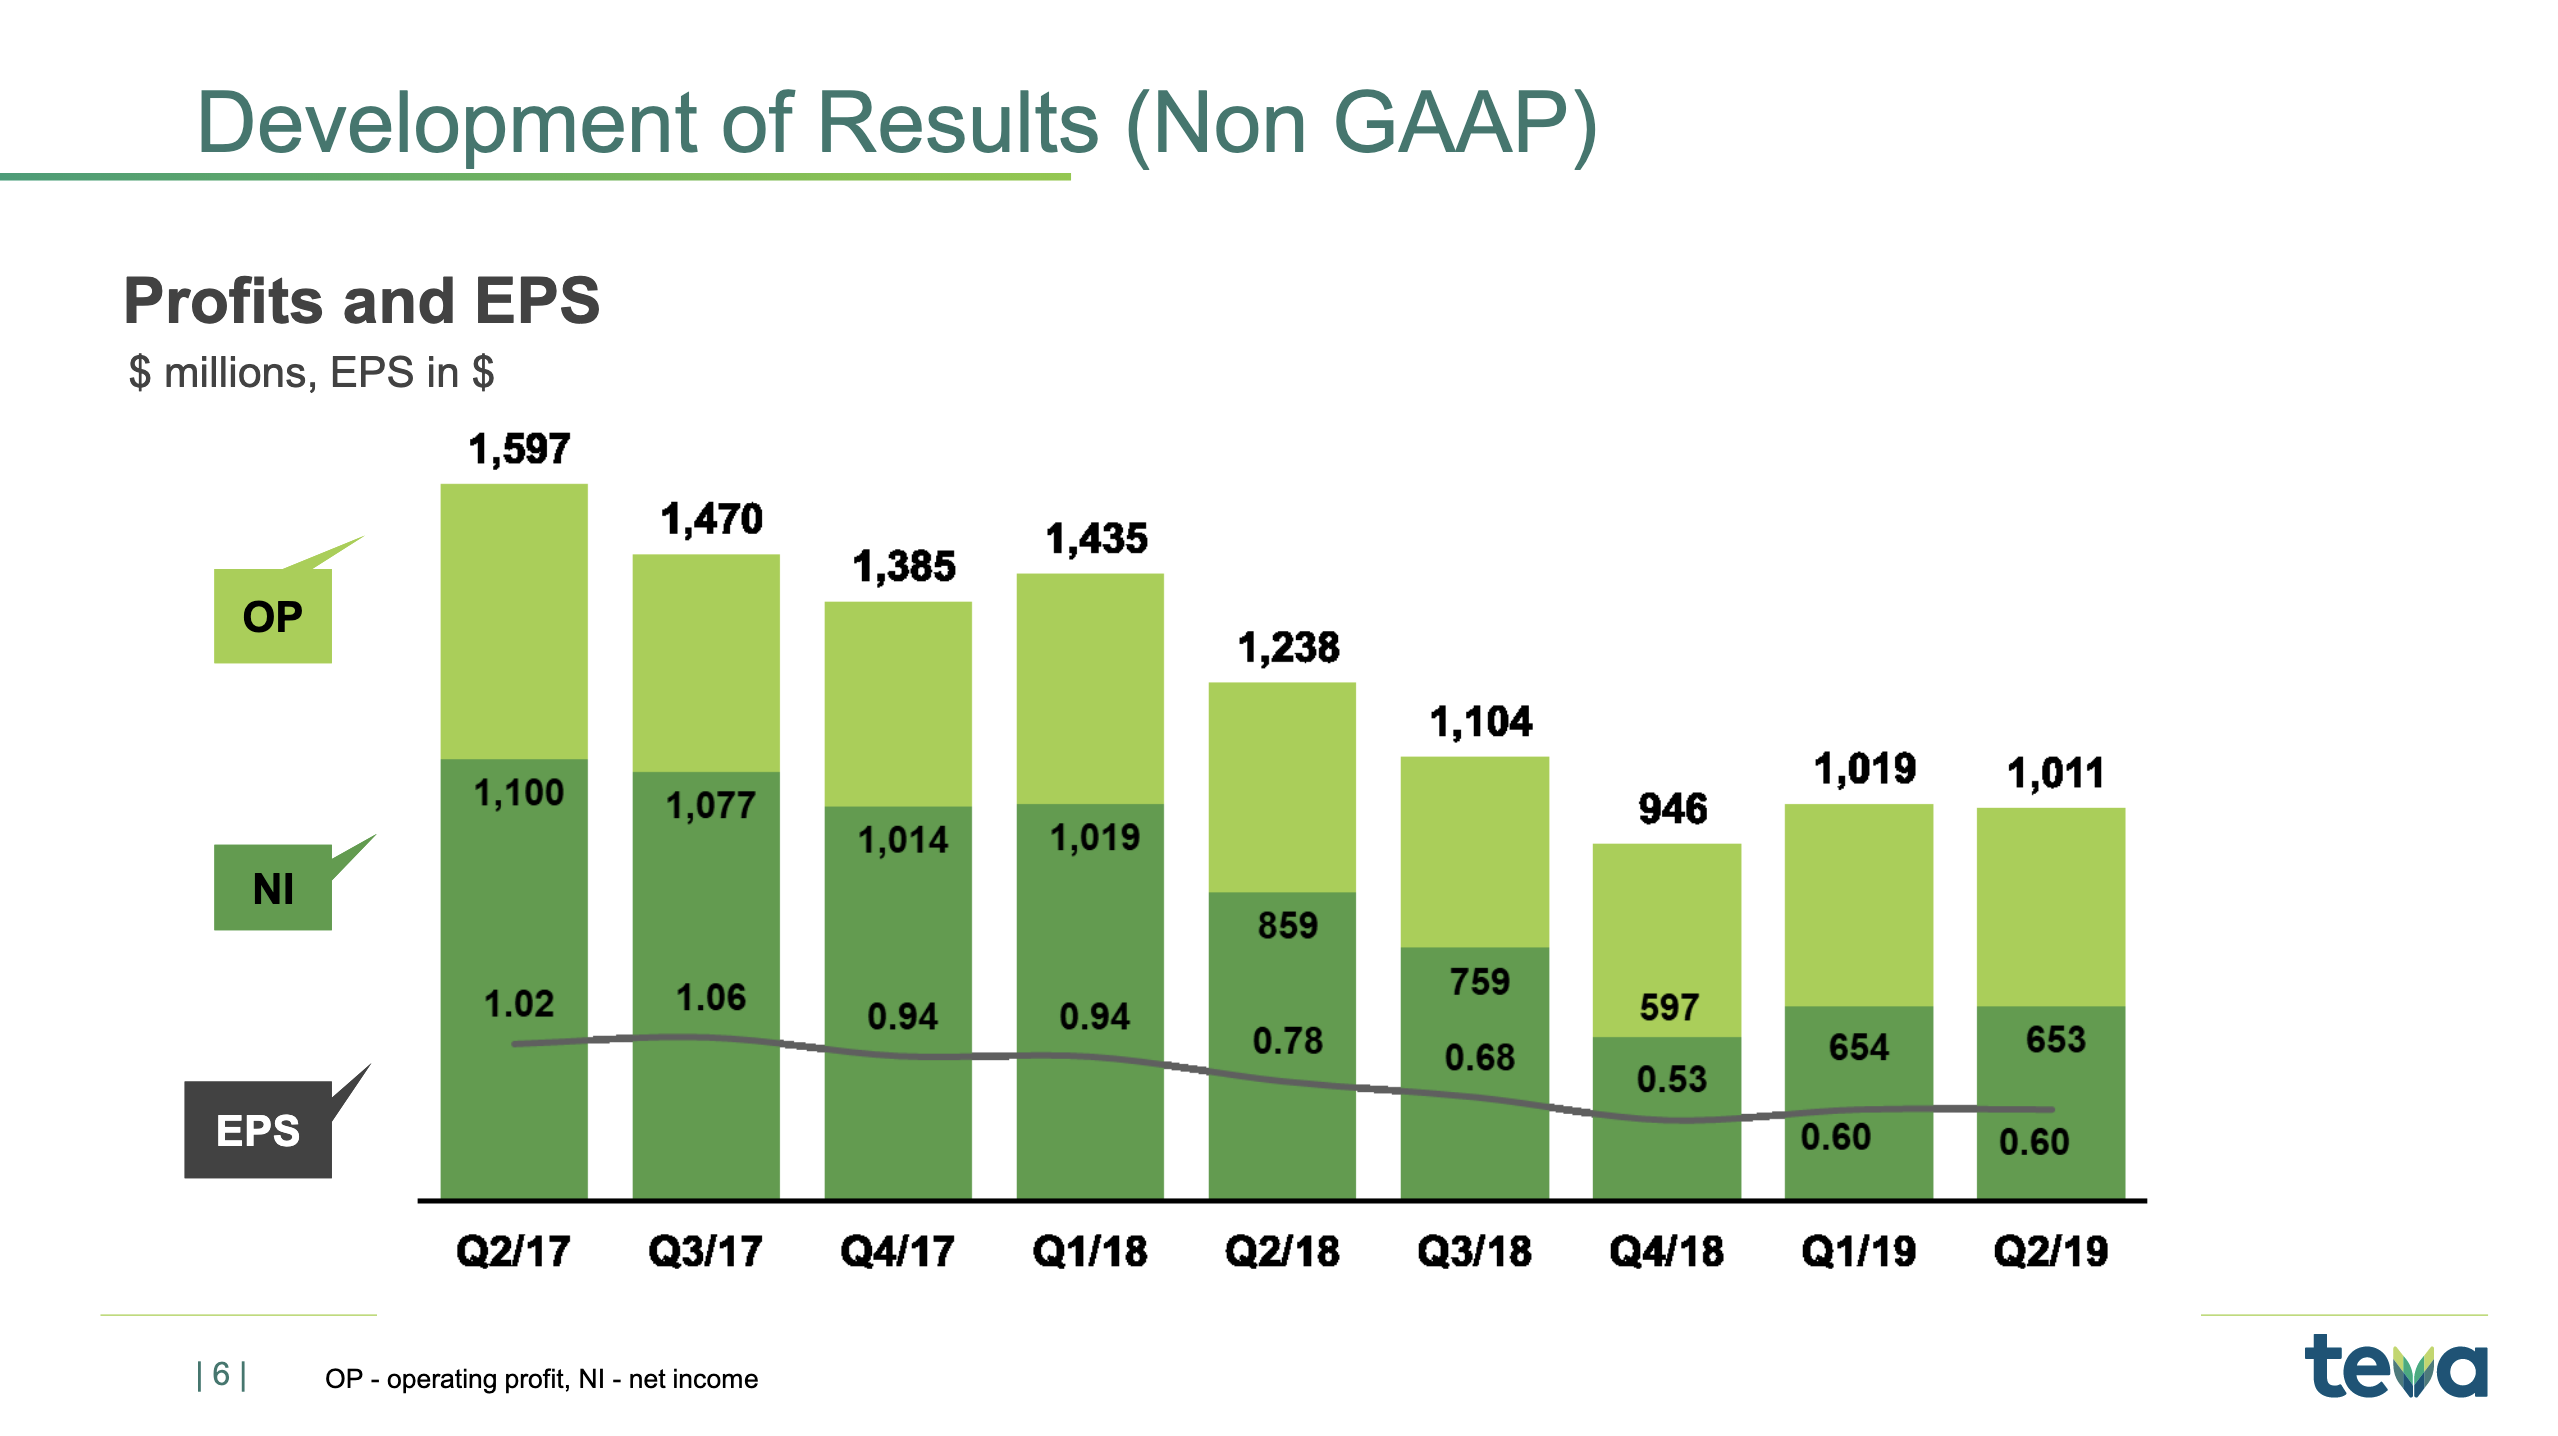
Talking about the trough, let’s look at the operating profit. If we look at that in the same historical period, then you’ll also see the very big effect of the revenues declining, and us only being able to take down the cost quarter-by-quarter, but still the effect now is that we are stabilising the operating profit at around roughly $1 billion per quarter, and you see that the net income is around $650 million right now. And that results, of course, in the earnings per share stabilising right now around $0.60.
Now this is – as I’ve said before, this is what we expect to be the trough year. It’s not that there will be a dramatic turnaround in the coming years, but the trend lines will slowly change and we’ll start to see a moderate increase in revenues and moderate increases in EPS going forward. But, just to remind everybody, this year will be the lowest year in terms of operating profit and also in terms of average earnings per share
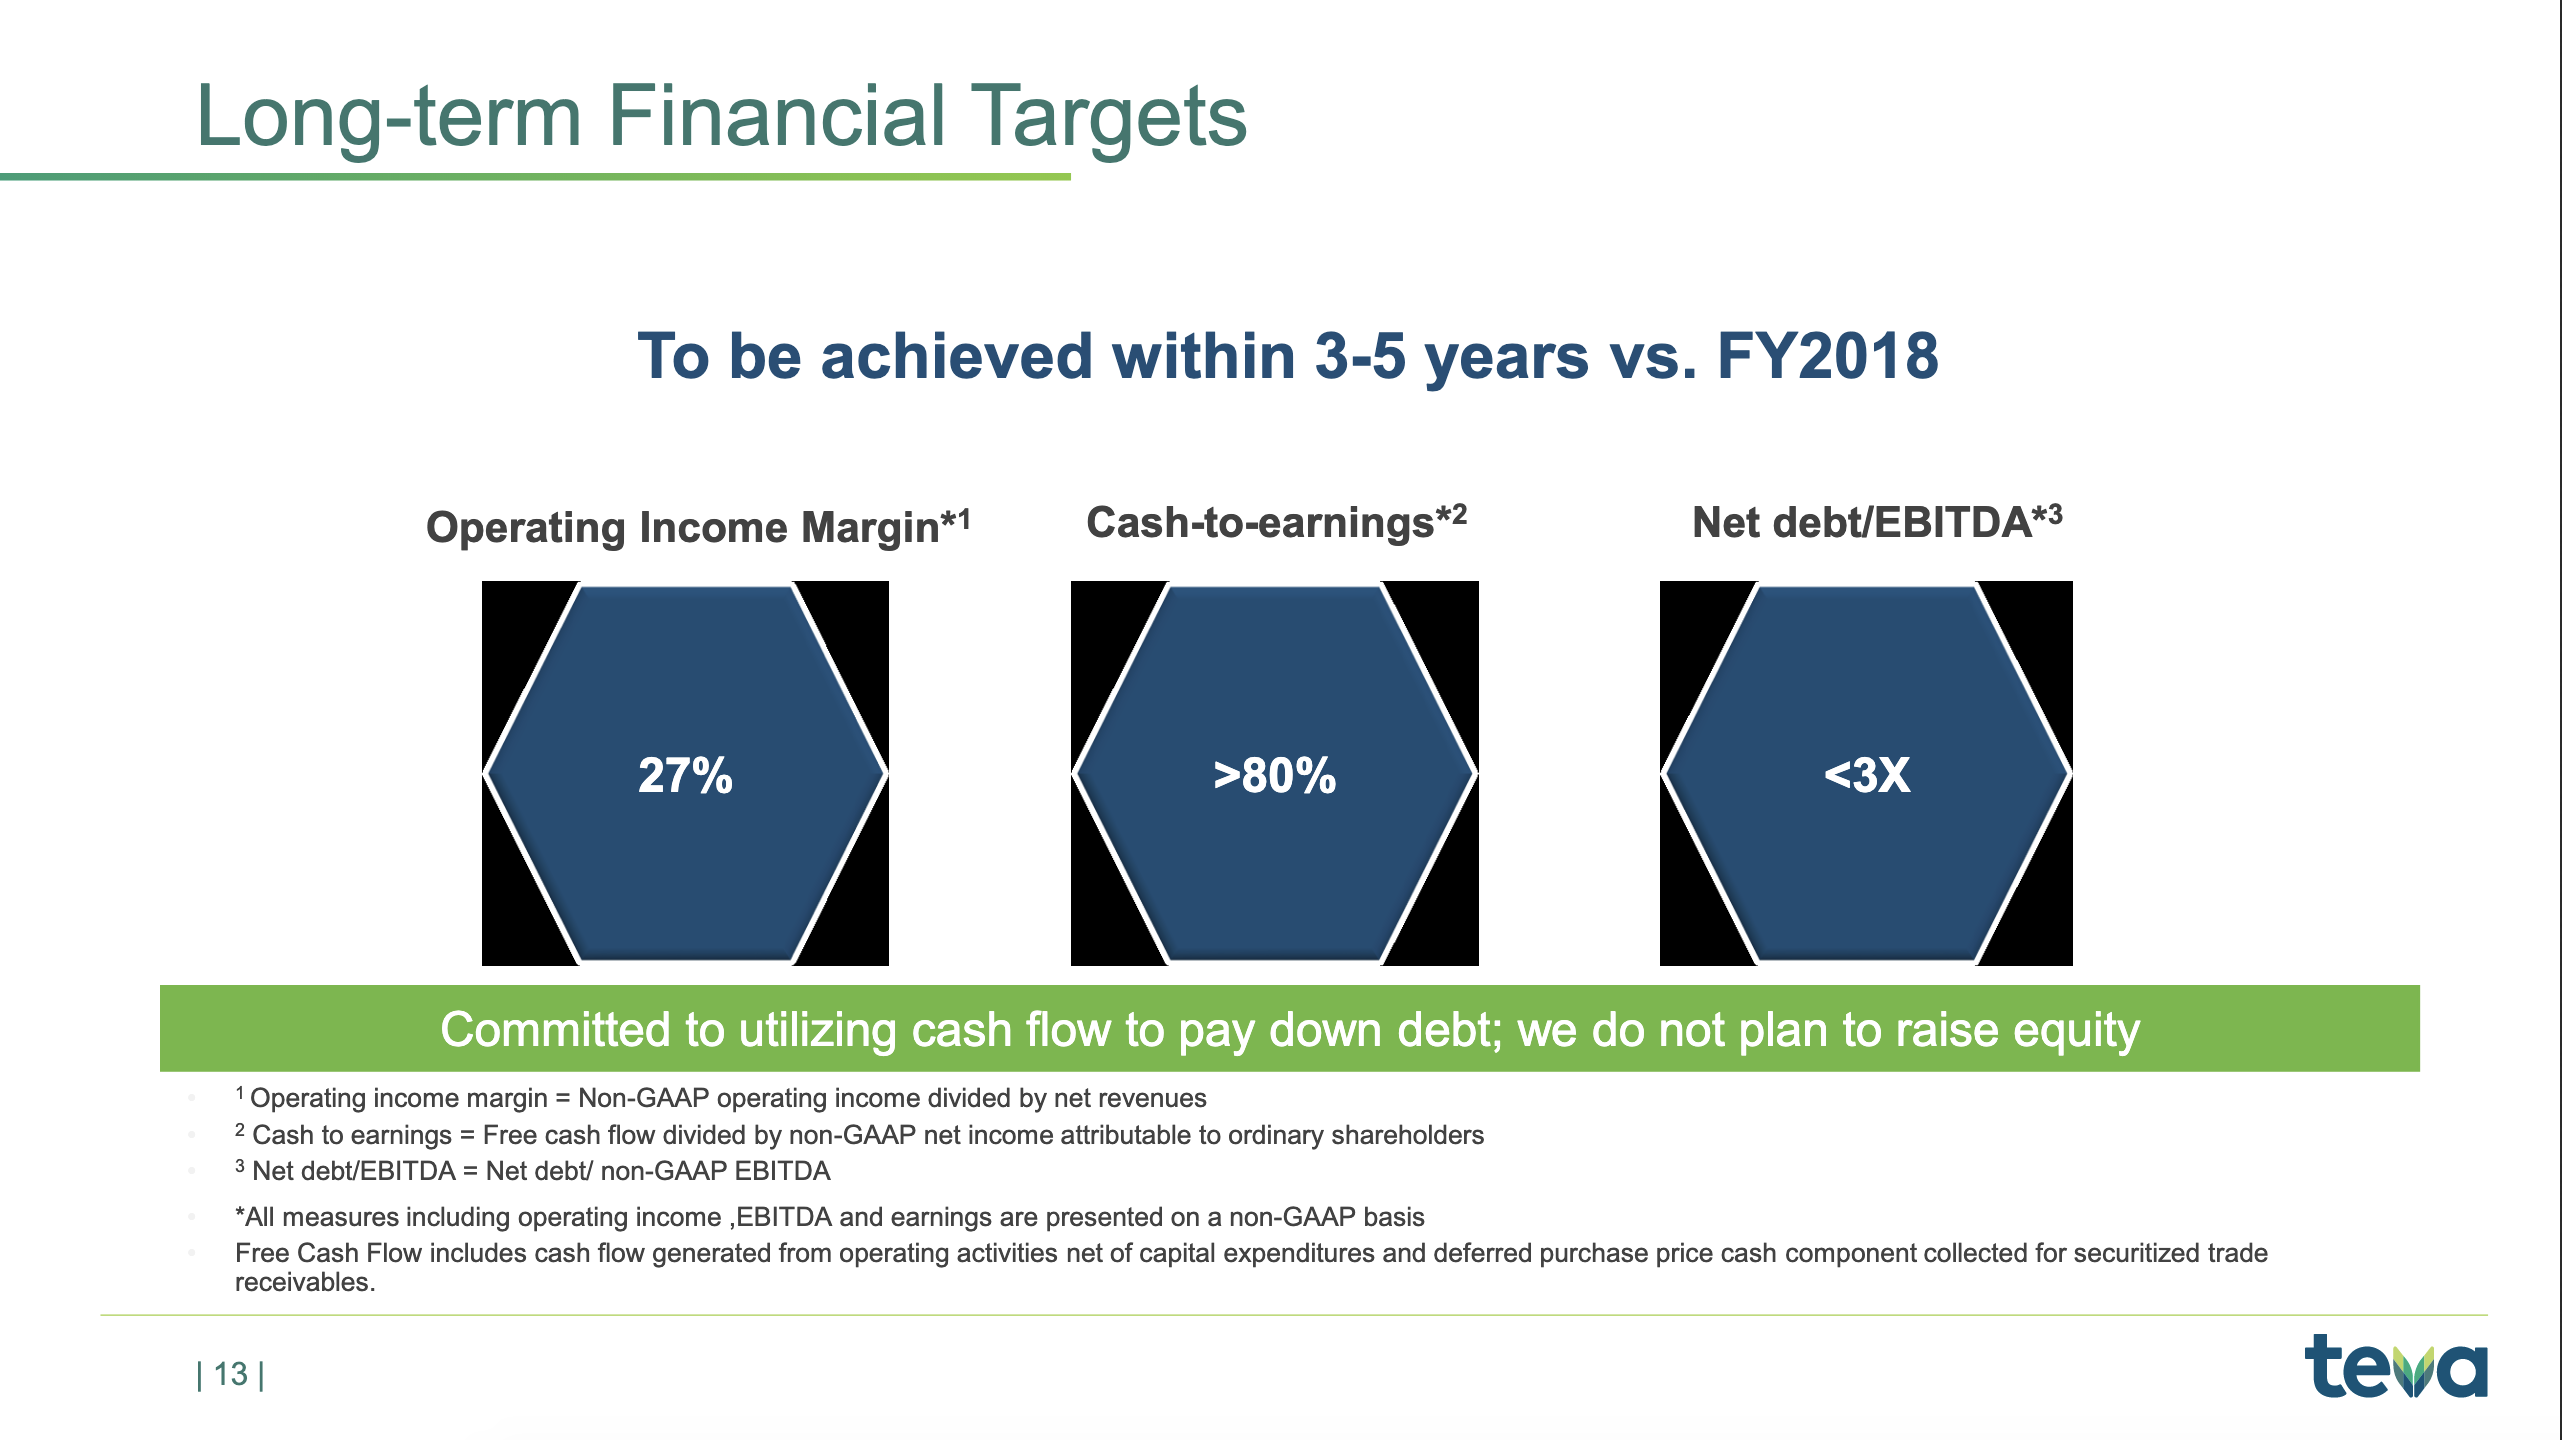
Now, if we look at the business going forward and our financial targets for the business going forward, then I’d just like to repeat these. We have talked about them before, but just so that everybody knows what our long-term plan is. And one key element is, as I said in the beginning, to improve the operating margin. Now, that happens by a lot of elements.
One element is, of course, that you optimise your product portfolio, the gross margin on the products you’re selling. You optimise the manufacturing cost of the products you sell. And you make sure that you have a good and strong overall market development. As I showed you earlier, we are at the level of 23% right now, and we want to improve that up to the level of 27%.
The cash-to-earnings is quite simple because we need the cash in order to reduce our debt. And of course, we have a long-term plan to keep on reducing our debt. The simple math is that, right now, we probably have a net earnings of some $650 million per quarter. That’s 2.6 billion a year. 80% of that, that’s roughly just around $2 billion. So, as you see, we’re also guiding $1.6 billion to $2 billion on the cash flow, so we’re really aiming at getting to that level where we, on a consistent basis, generate most of the result as cash.
There will always be quarterly fluctuations with a big balance sheet as ours. Of course, there are quarterly fluctuations. But, on a yearly basis, it’s very important that we meet this target of the 80% cash-to-earnings. And that is important because we need to reduce the debt.
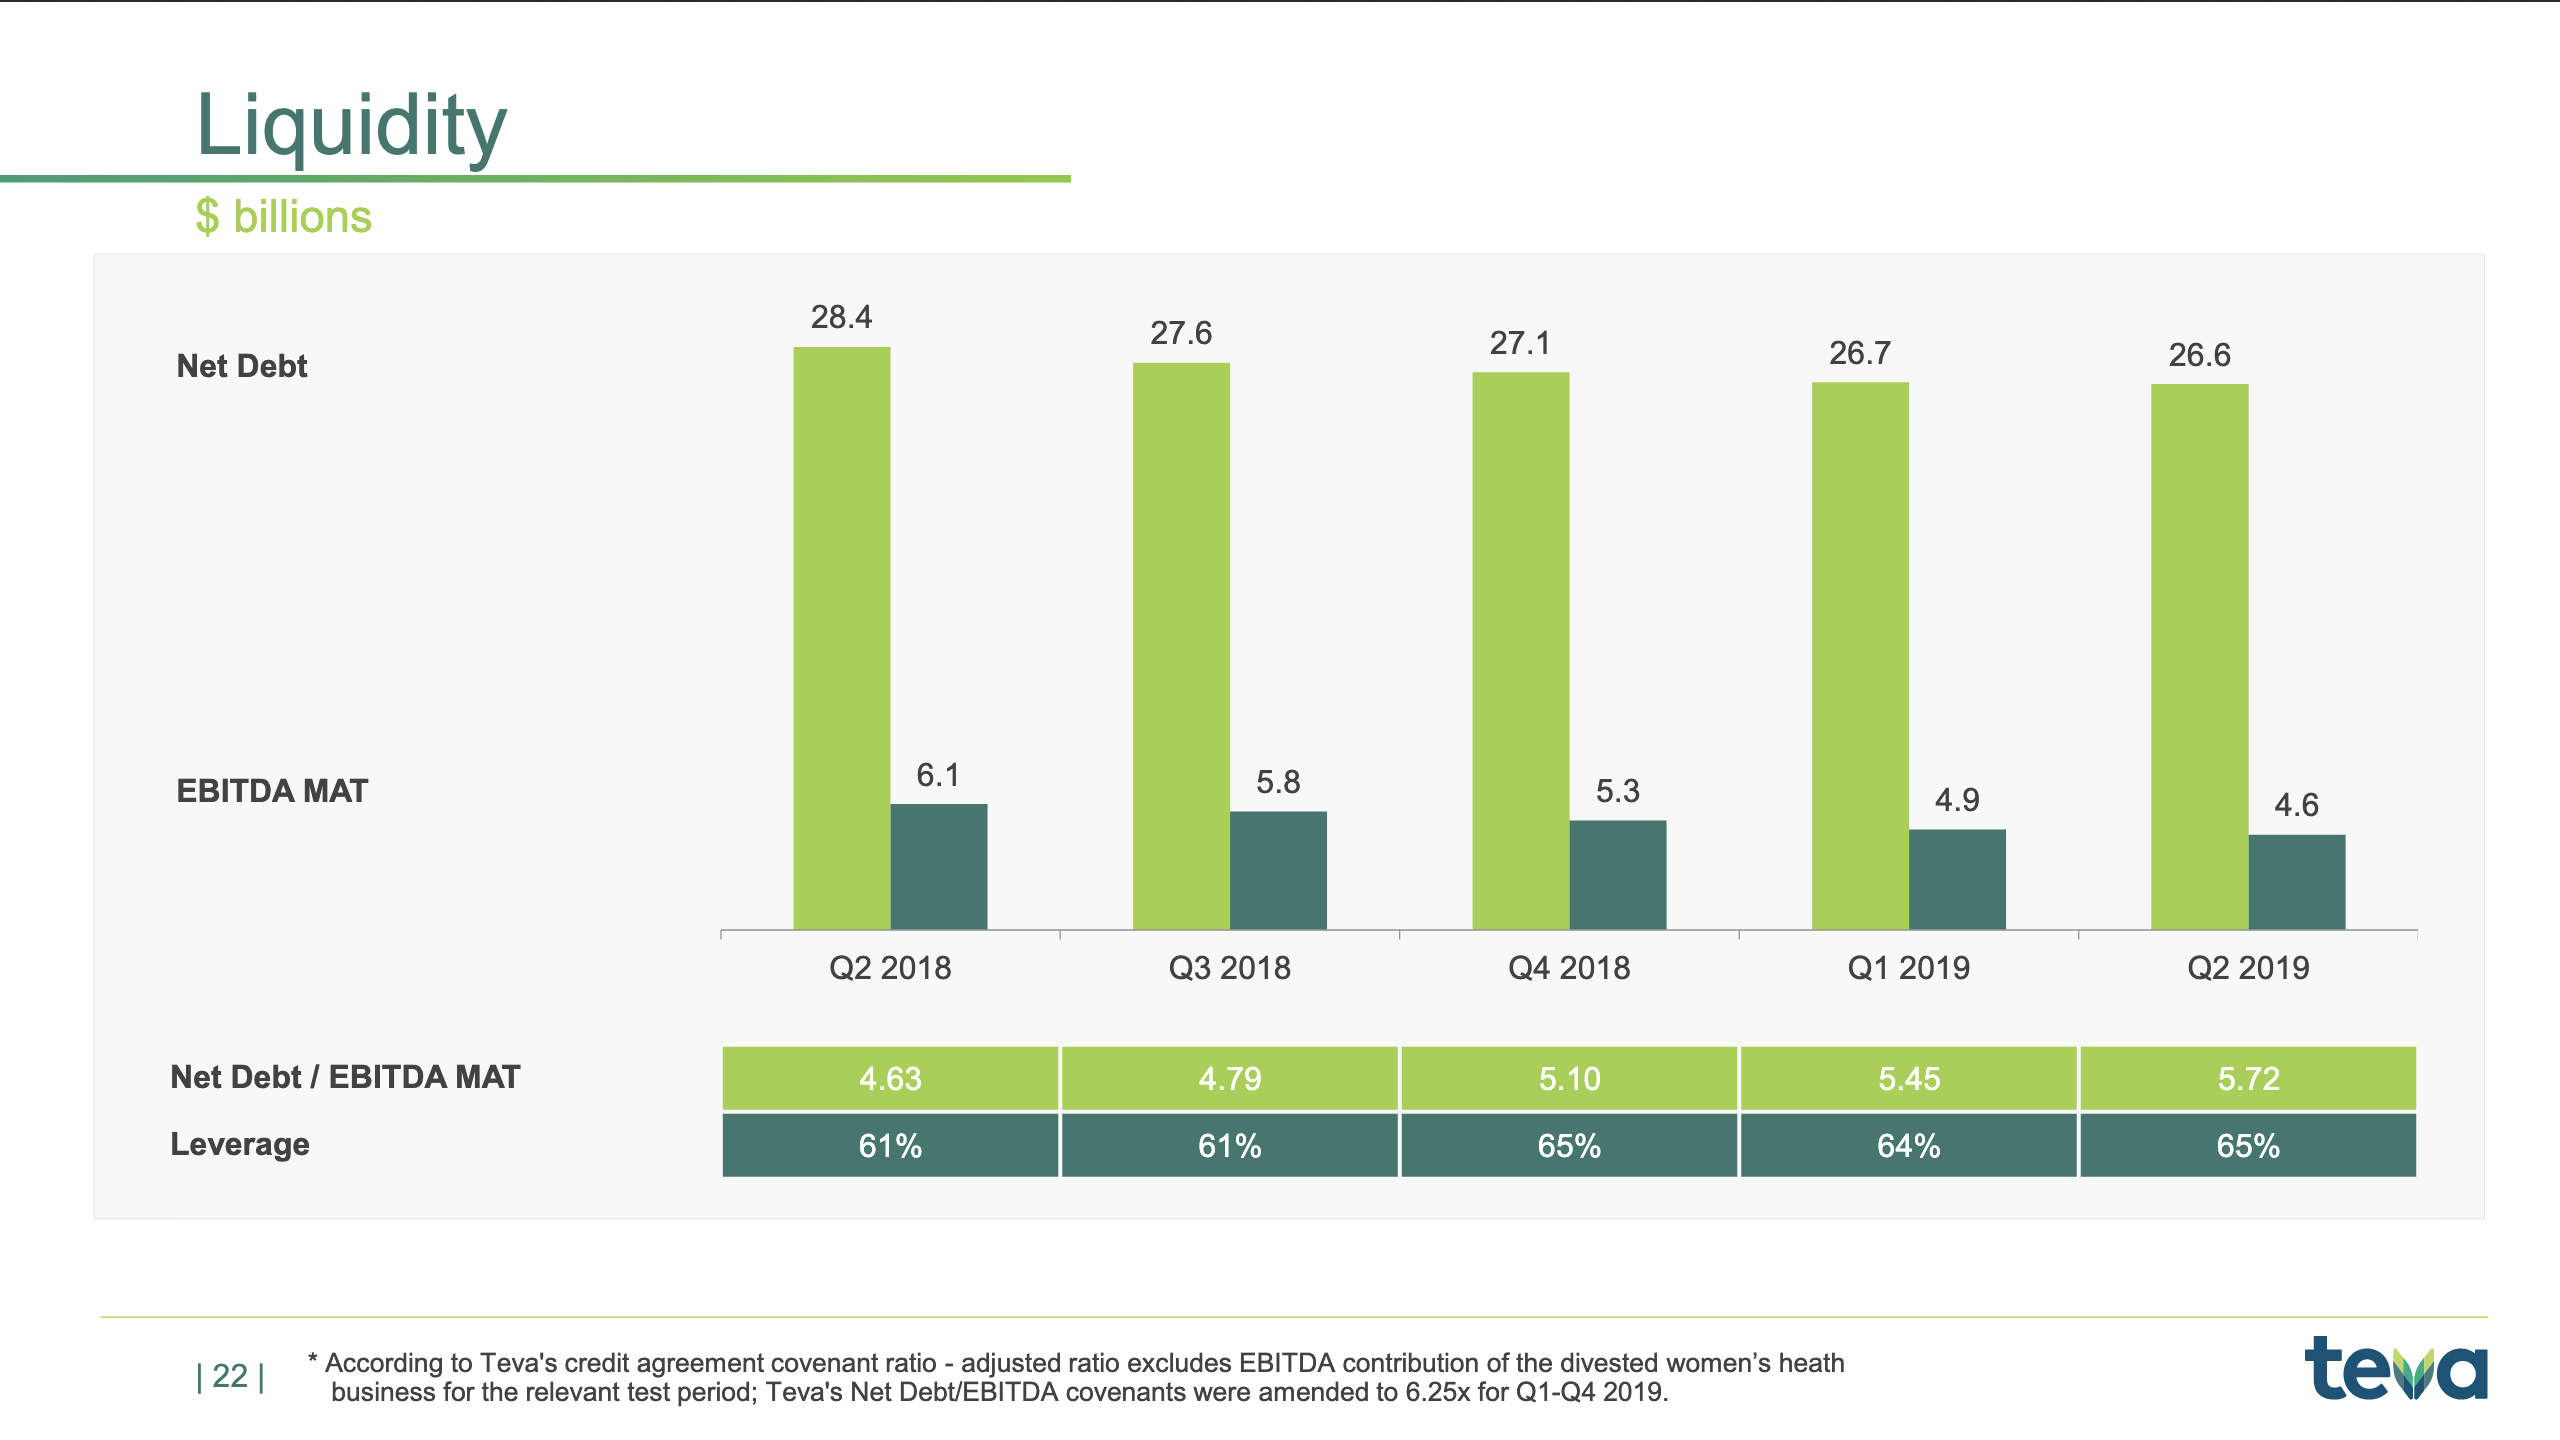
As you know, our net debt-to-EBITDA ratio right now is about 5x, and we really want to get it below 3x, and the only way to do that is to generate cash and pay back the debt. So we will continue to use all our cash flows to really pay down debt. And as I stated many times, we do not plan to raise equity. We plan to continue to use cash to reduce the outstanding debt, and we think that’s the best way to create value for our long-term shareholders.
We ended the second quarter with a net debt of $26.6 billion and a net debt-to-EBITDA ratio of 5.72x. As you may recall, during April, we also entered into a $2.3 billion unsecured syndicated revolving credit facility, which replaced the previous $3 billion revolving credit facility that we had. This new RCF can be used for general corporate purposes, including repaying existing debt. As of June 30, 2019, no amounts were outstanding under the RCF. And as of today, we have $500 million outstanding under the RCF.
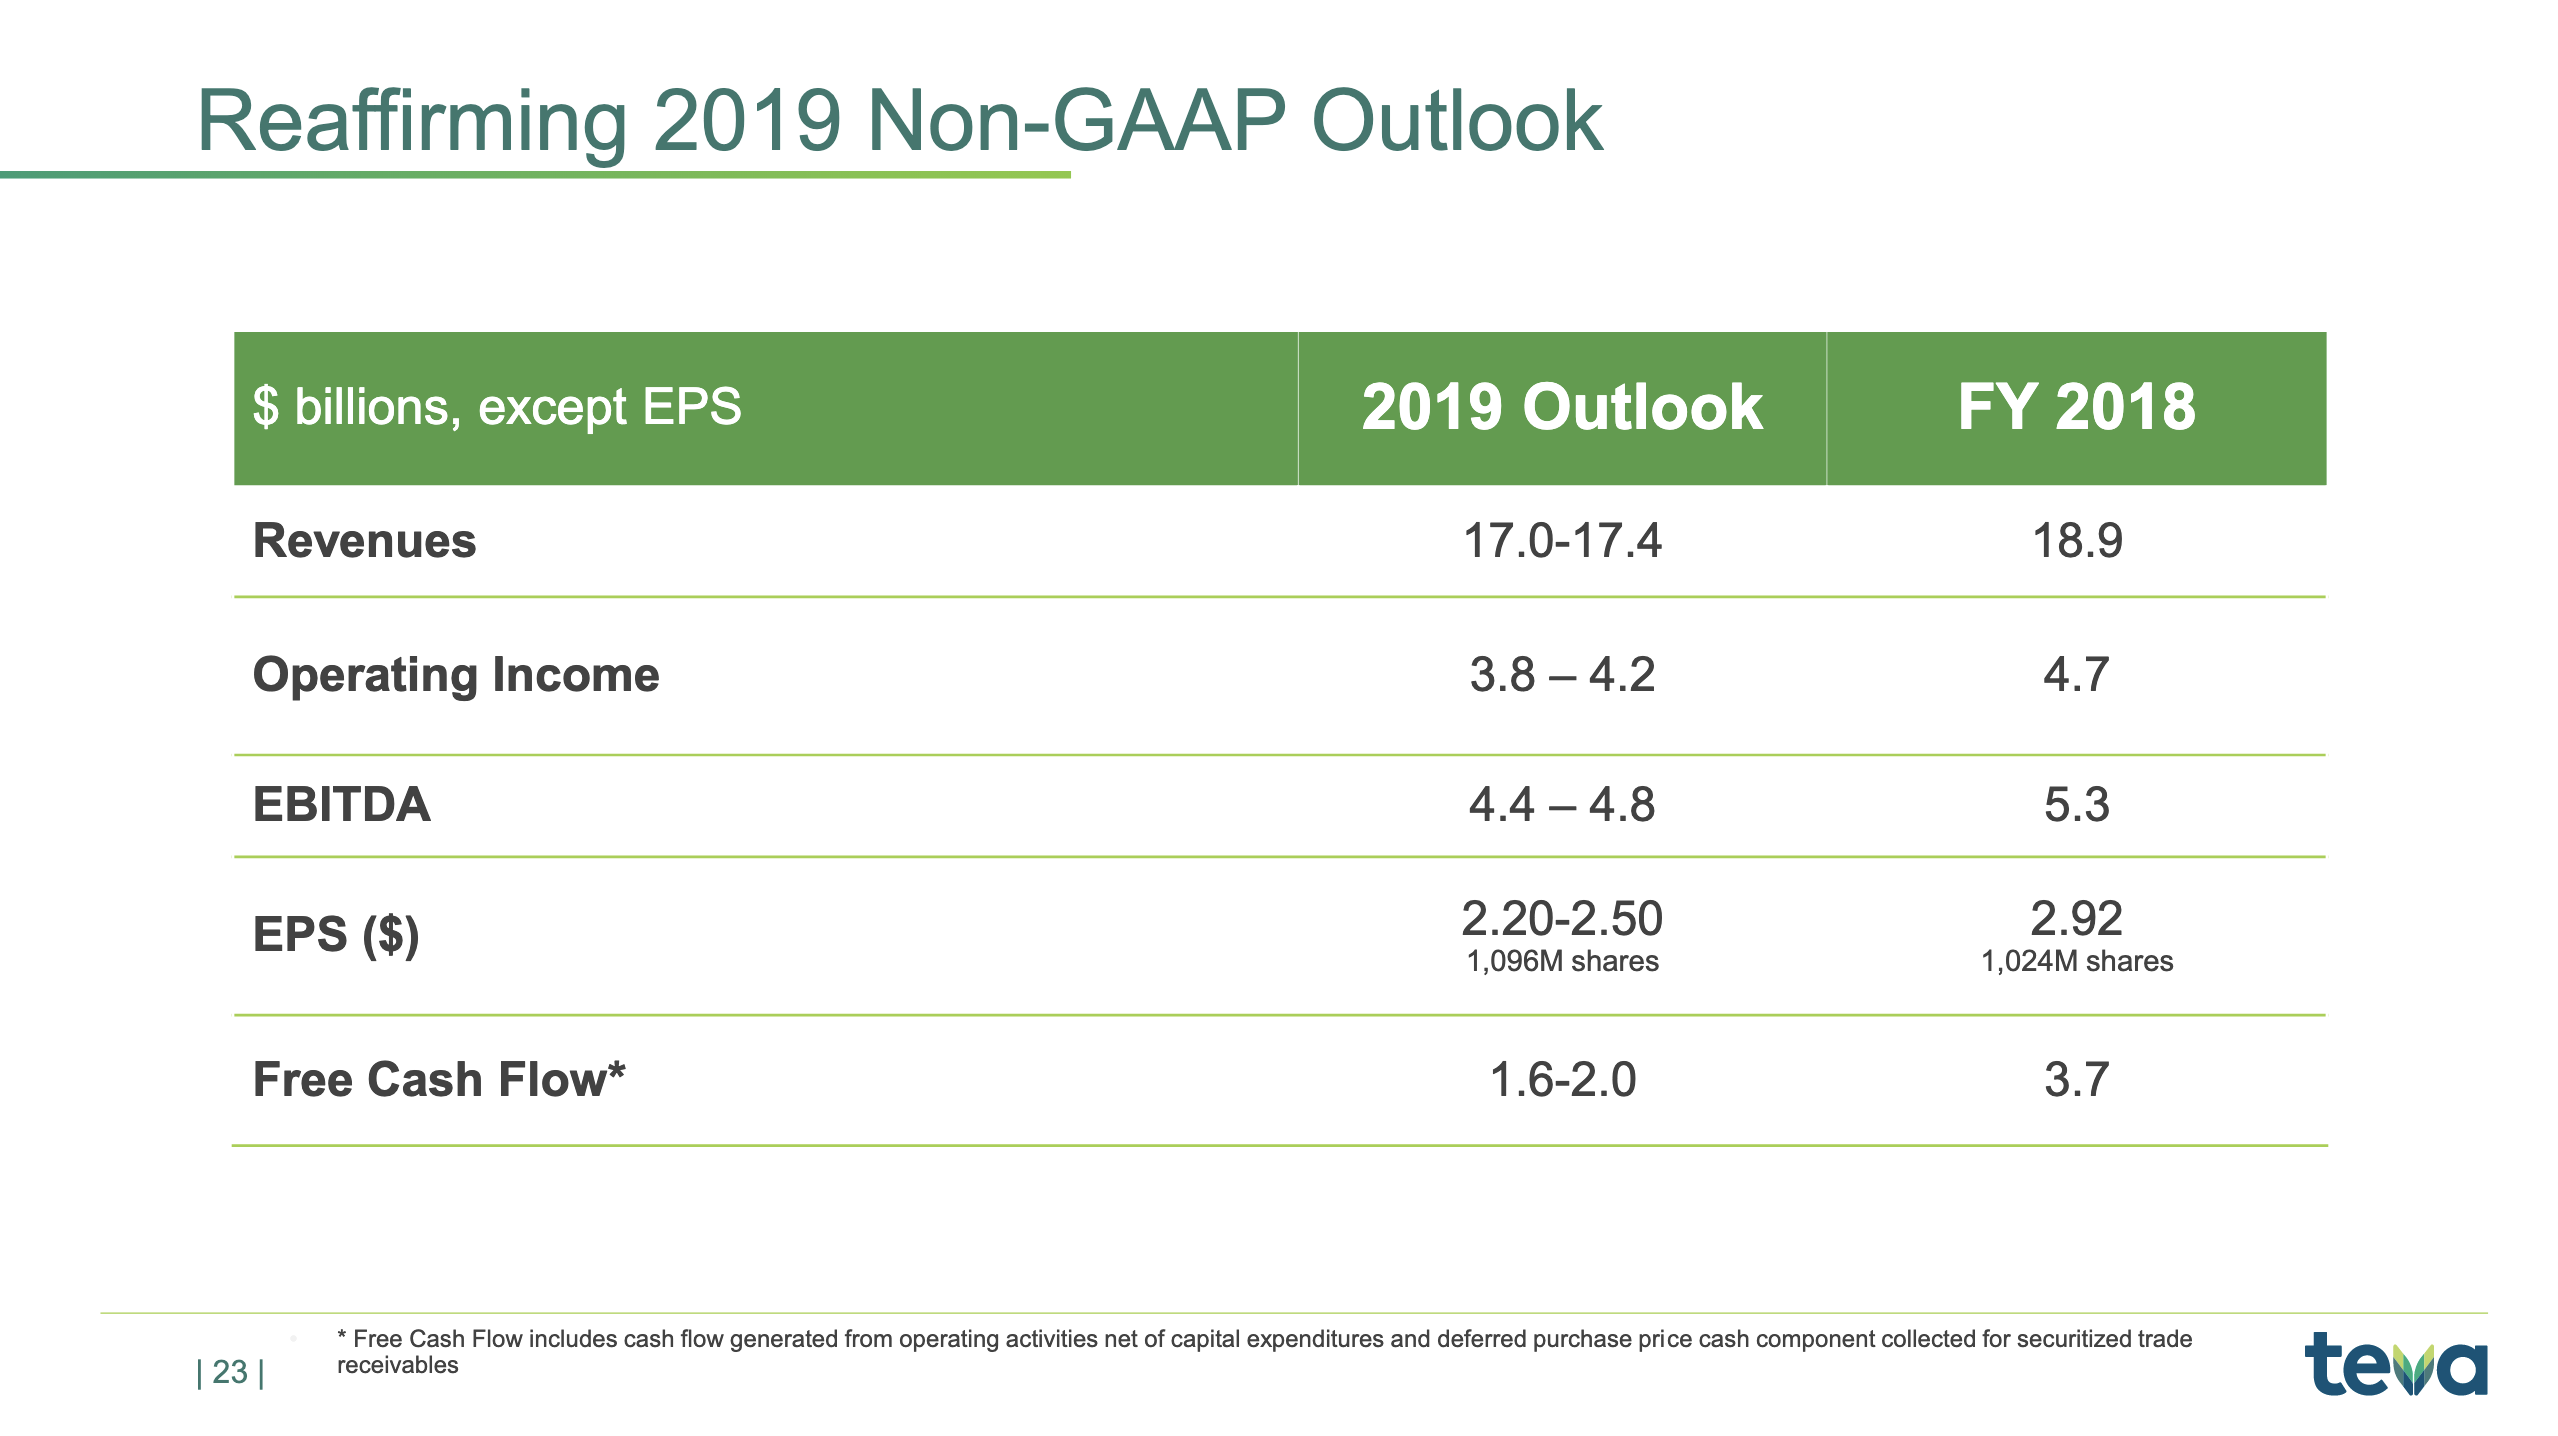
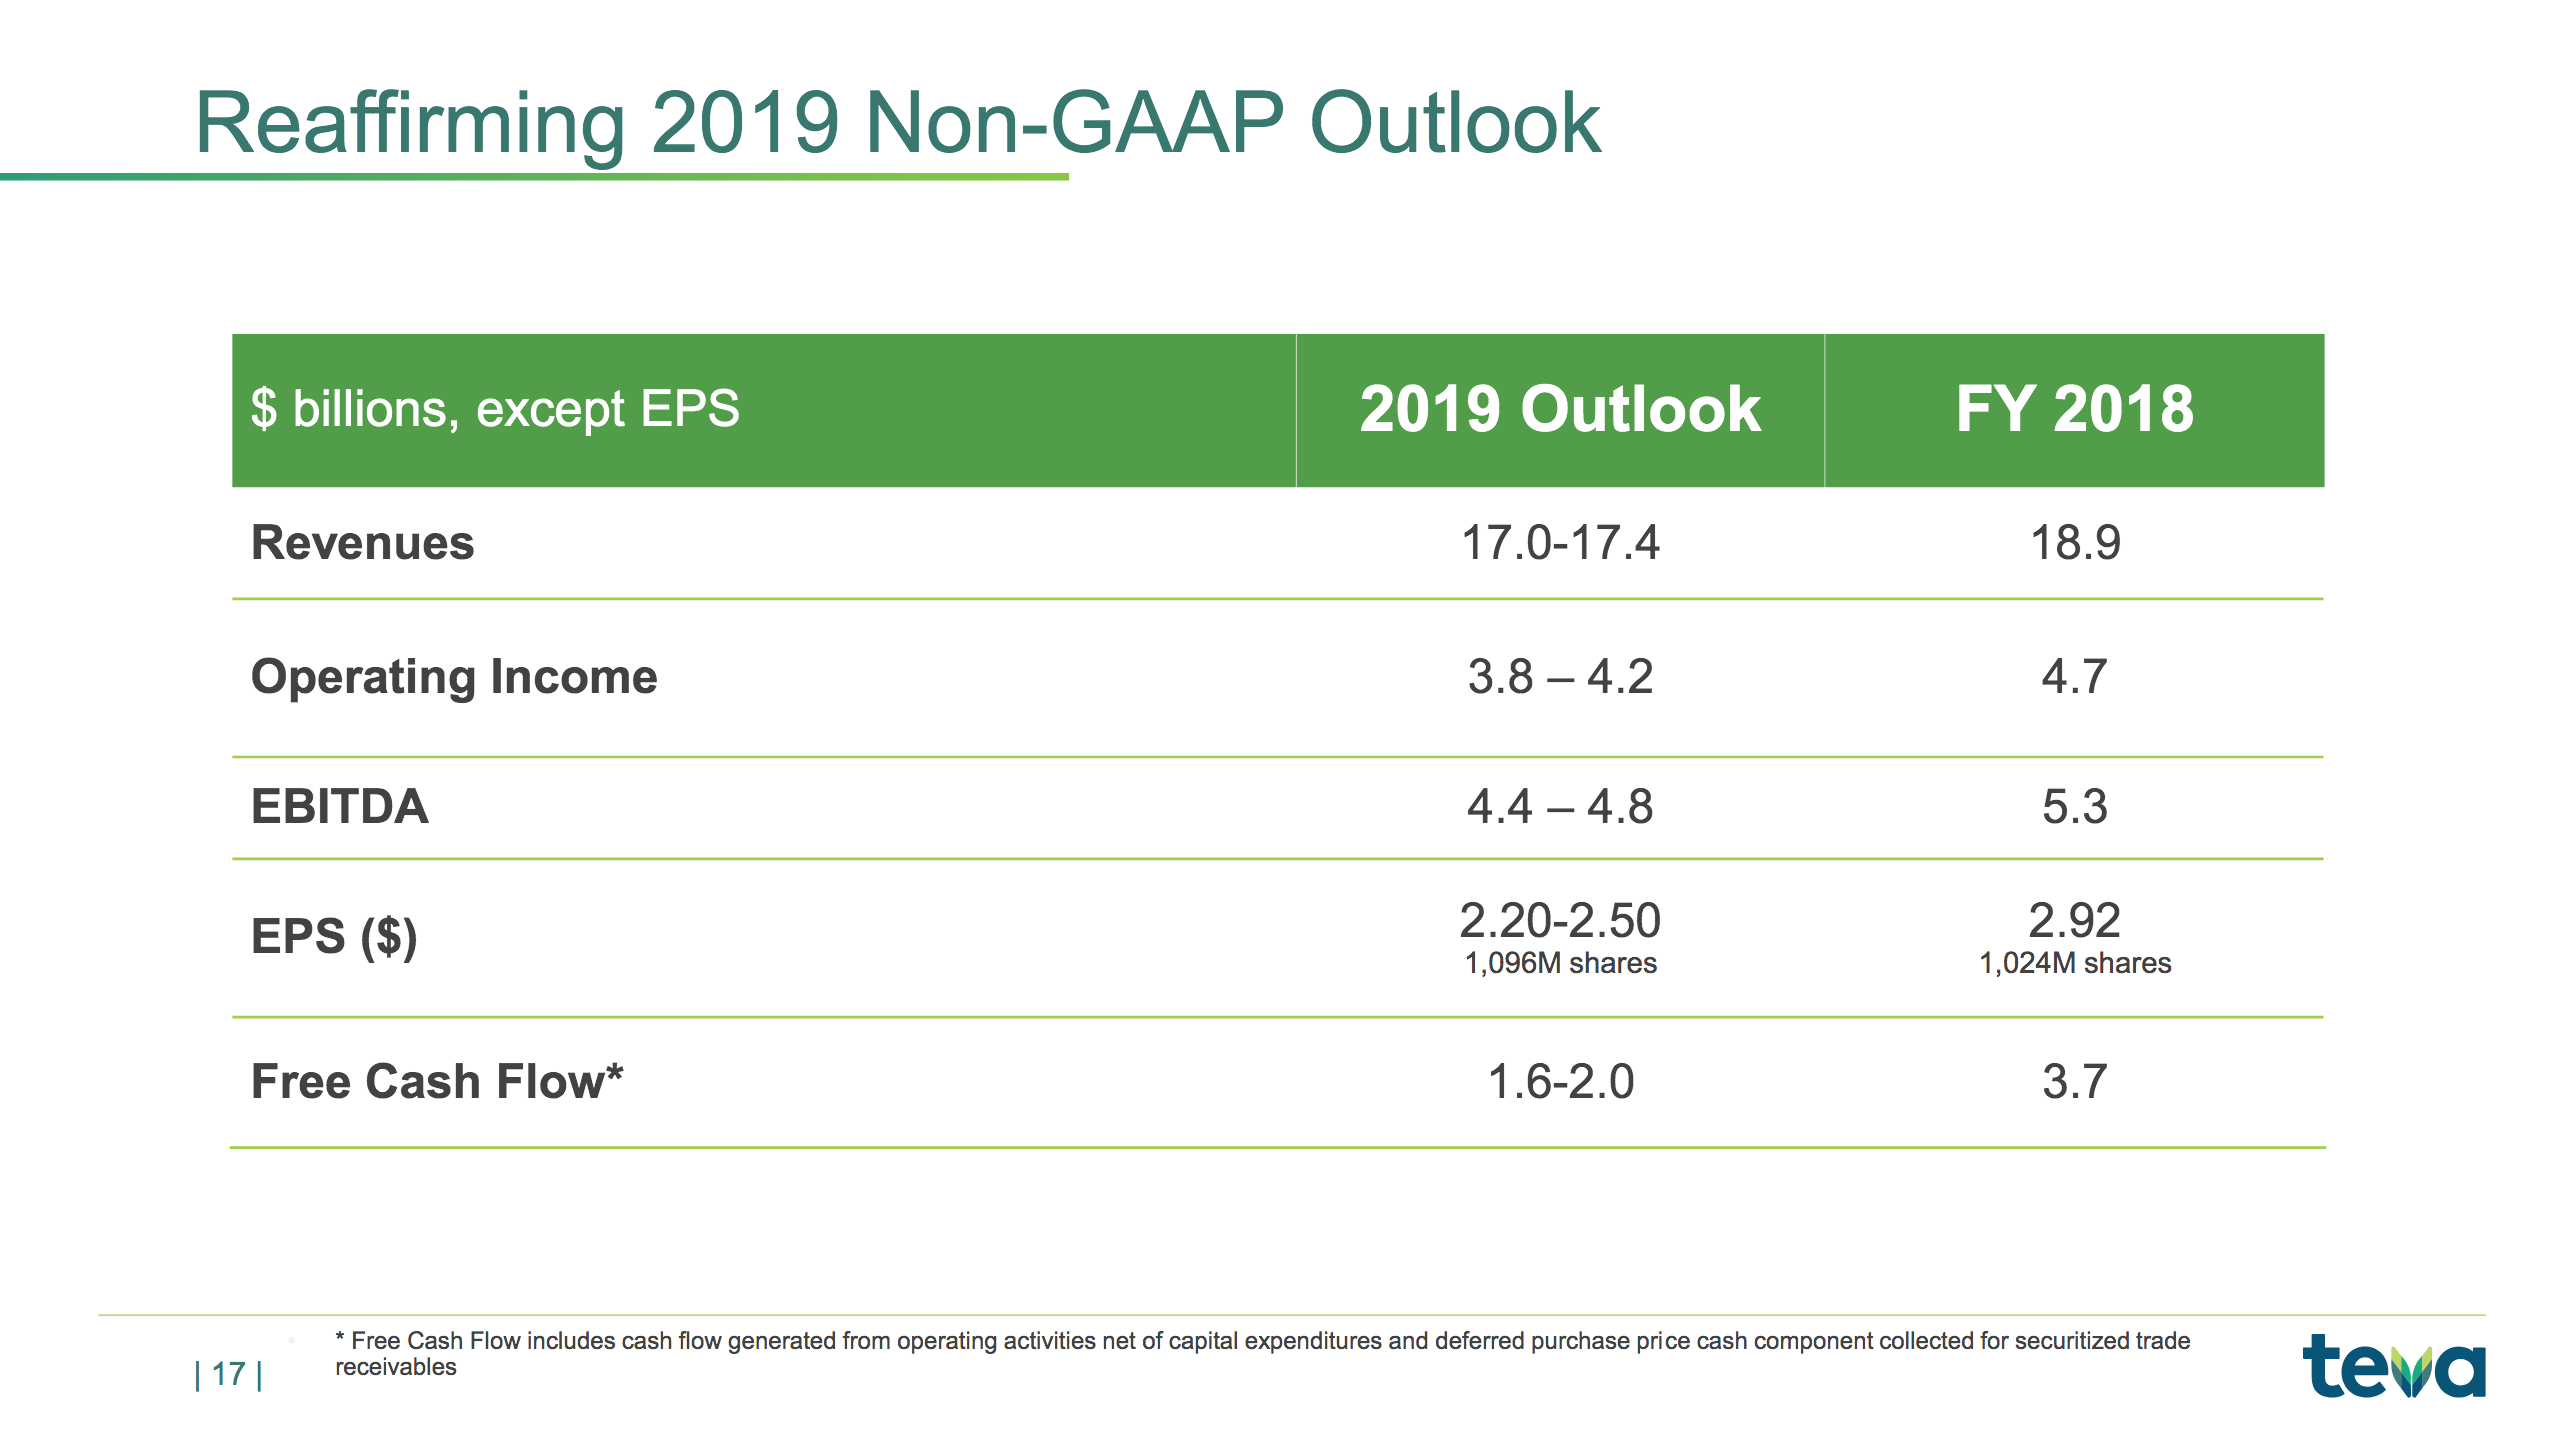
Today, we are reaffirming all aspects of our annual guidance that were first presented in February and reaffirmed in May, including earnings per share in the range of $2.20 to $2.50 and free cash flow from $1.6 billion to $2 billion for the year. Where we end up in the ranges of the full year will depend on the performance of the branded products, especially COPAXONE and AJOVY, the timing of generic launches, foreign exchange rates, especially the euro, and our expense management.
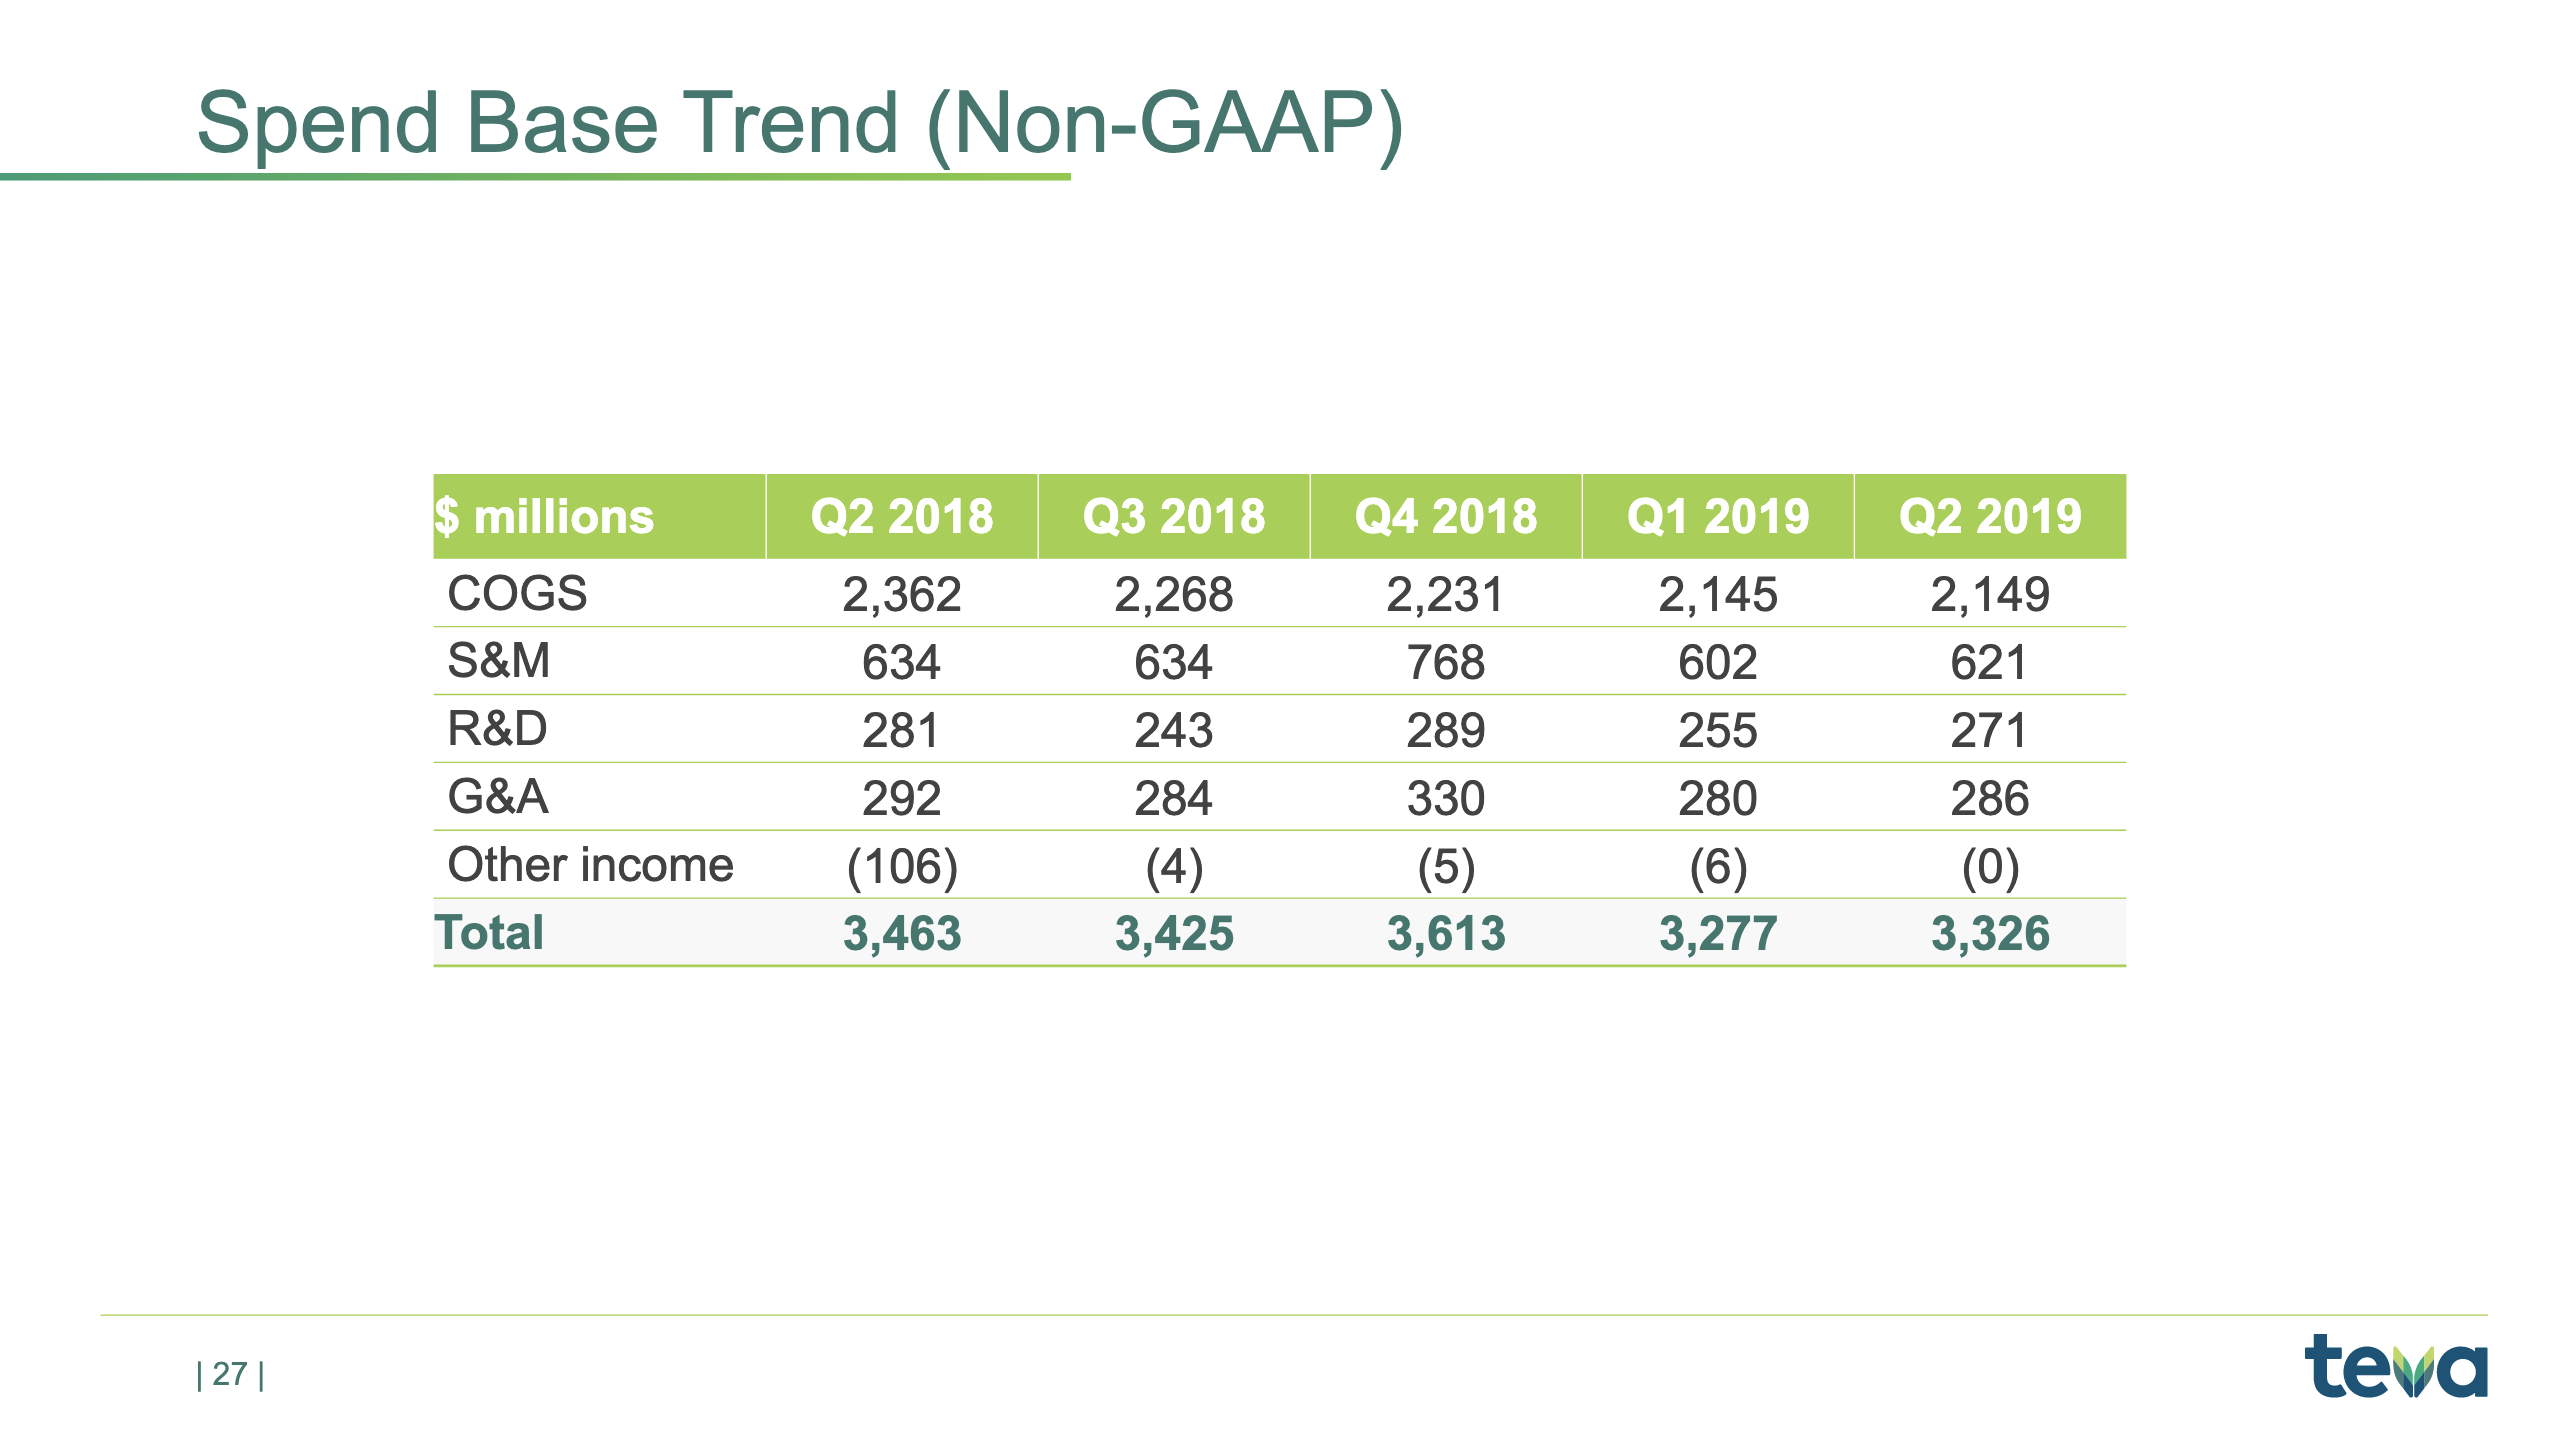
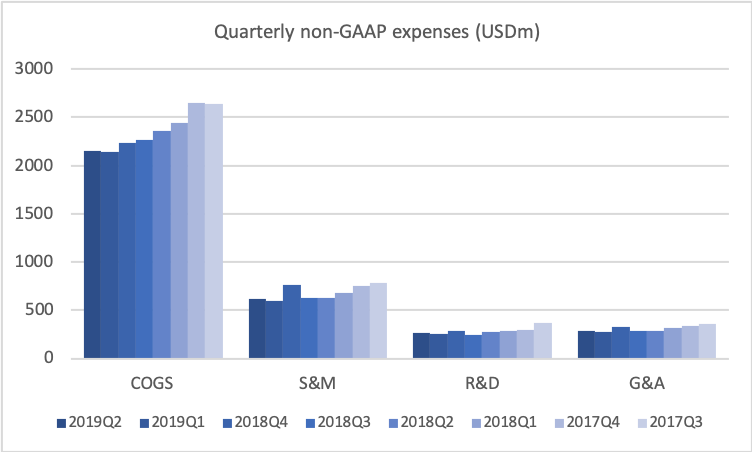
Spend base
Spend base
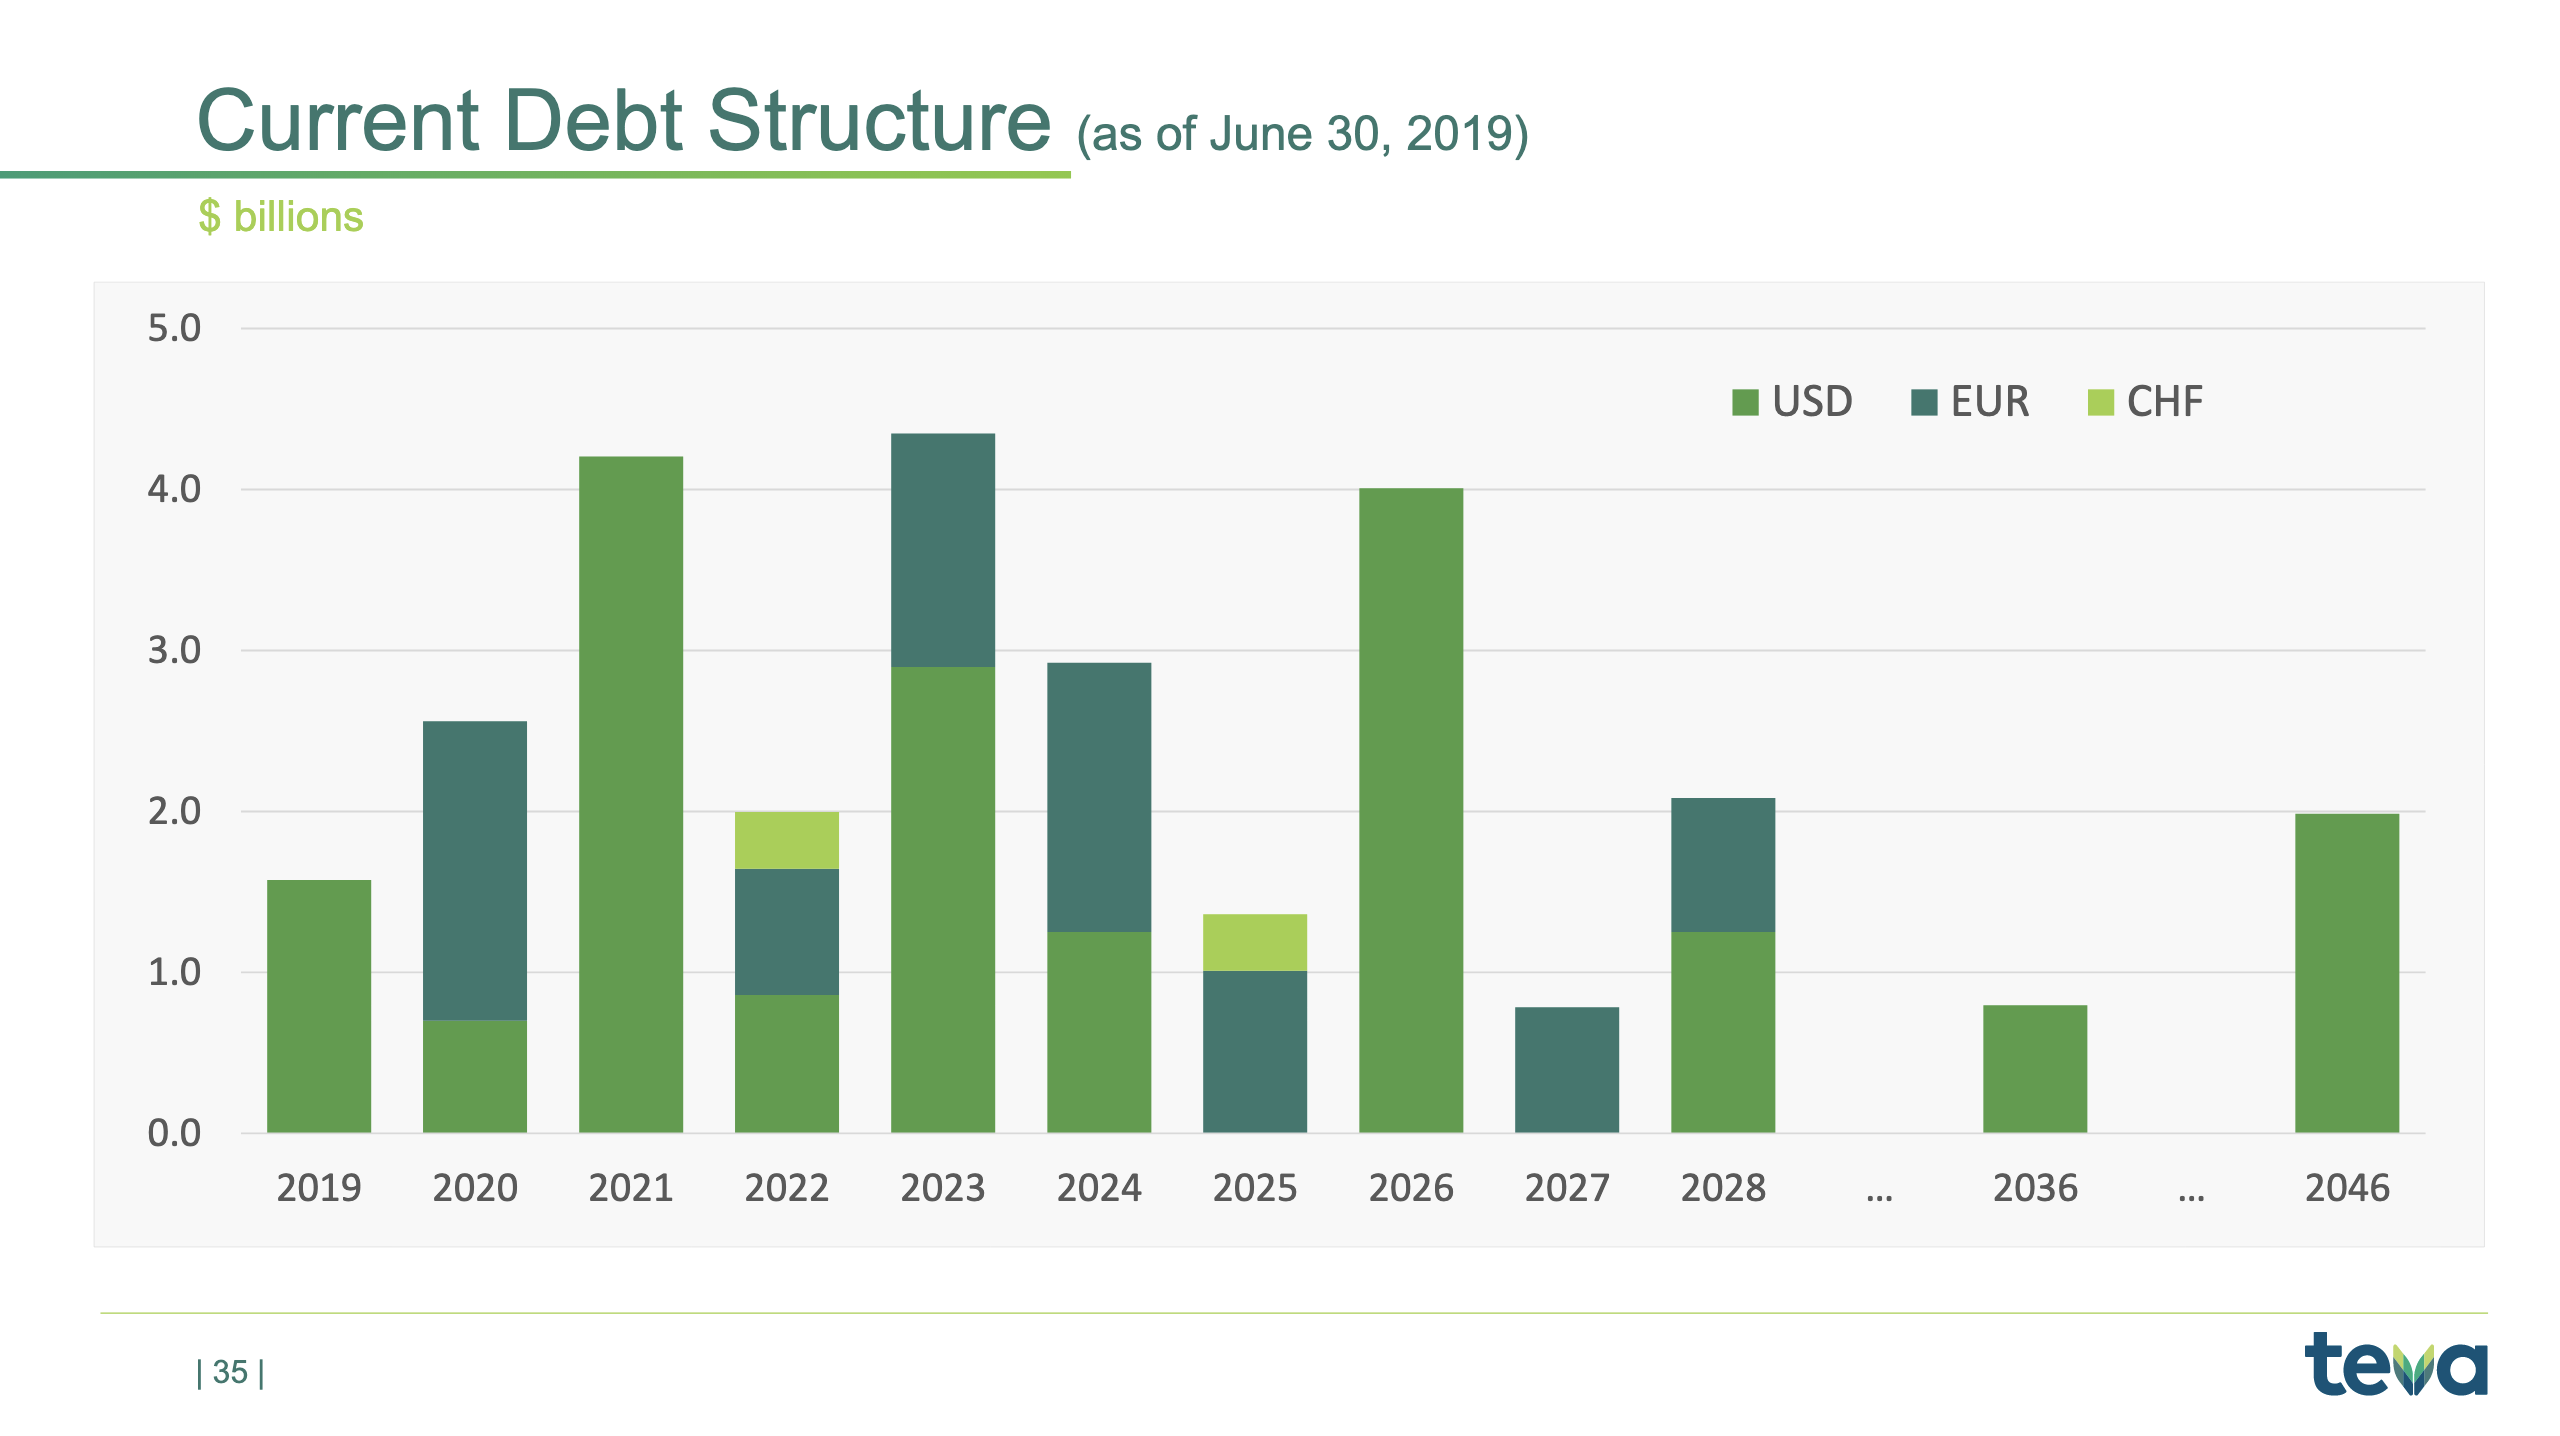
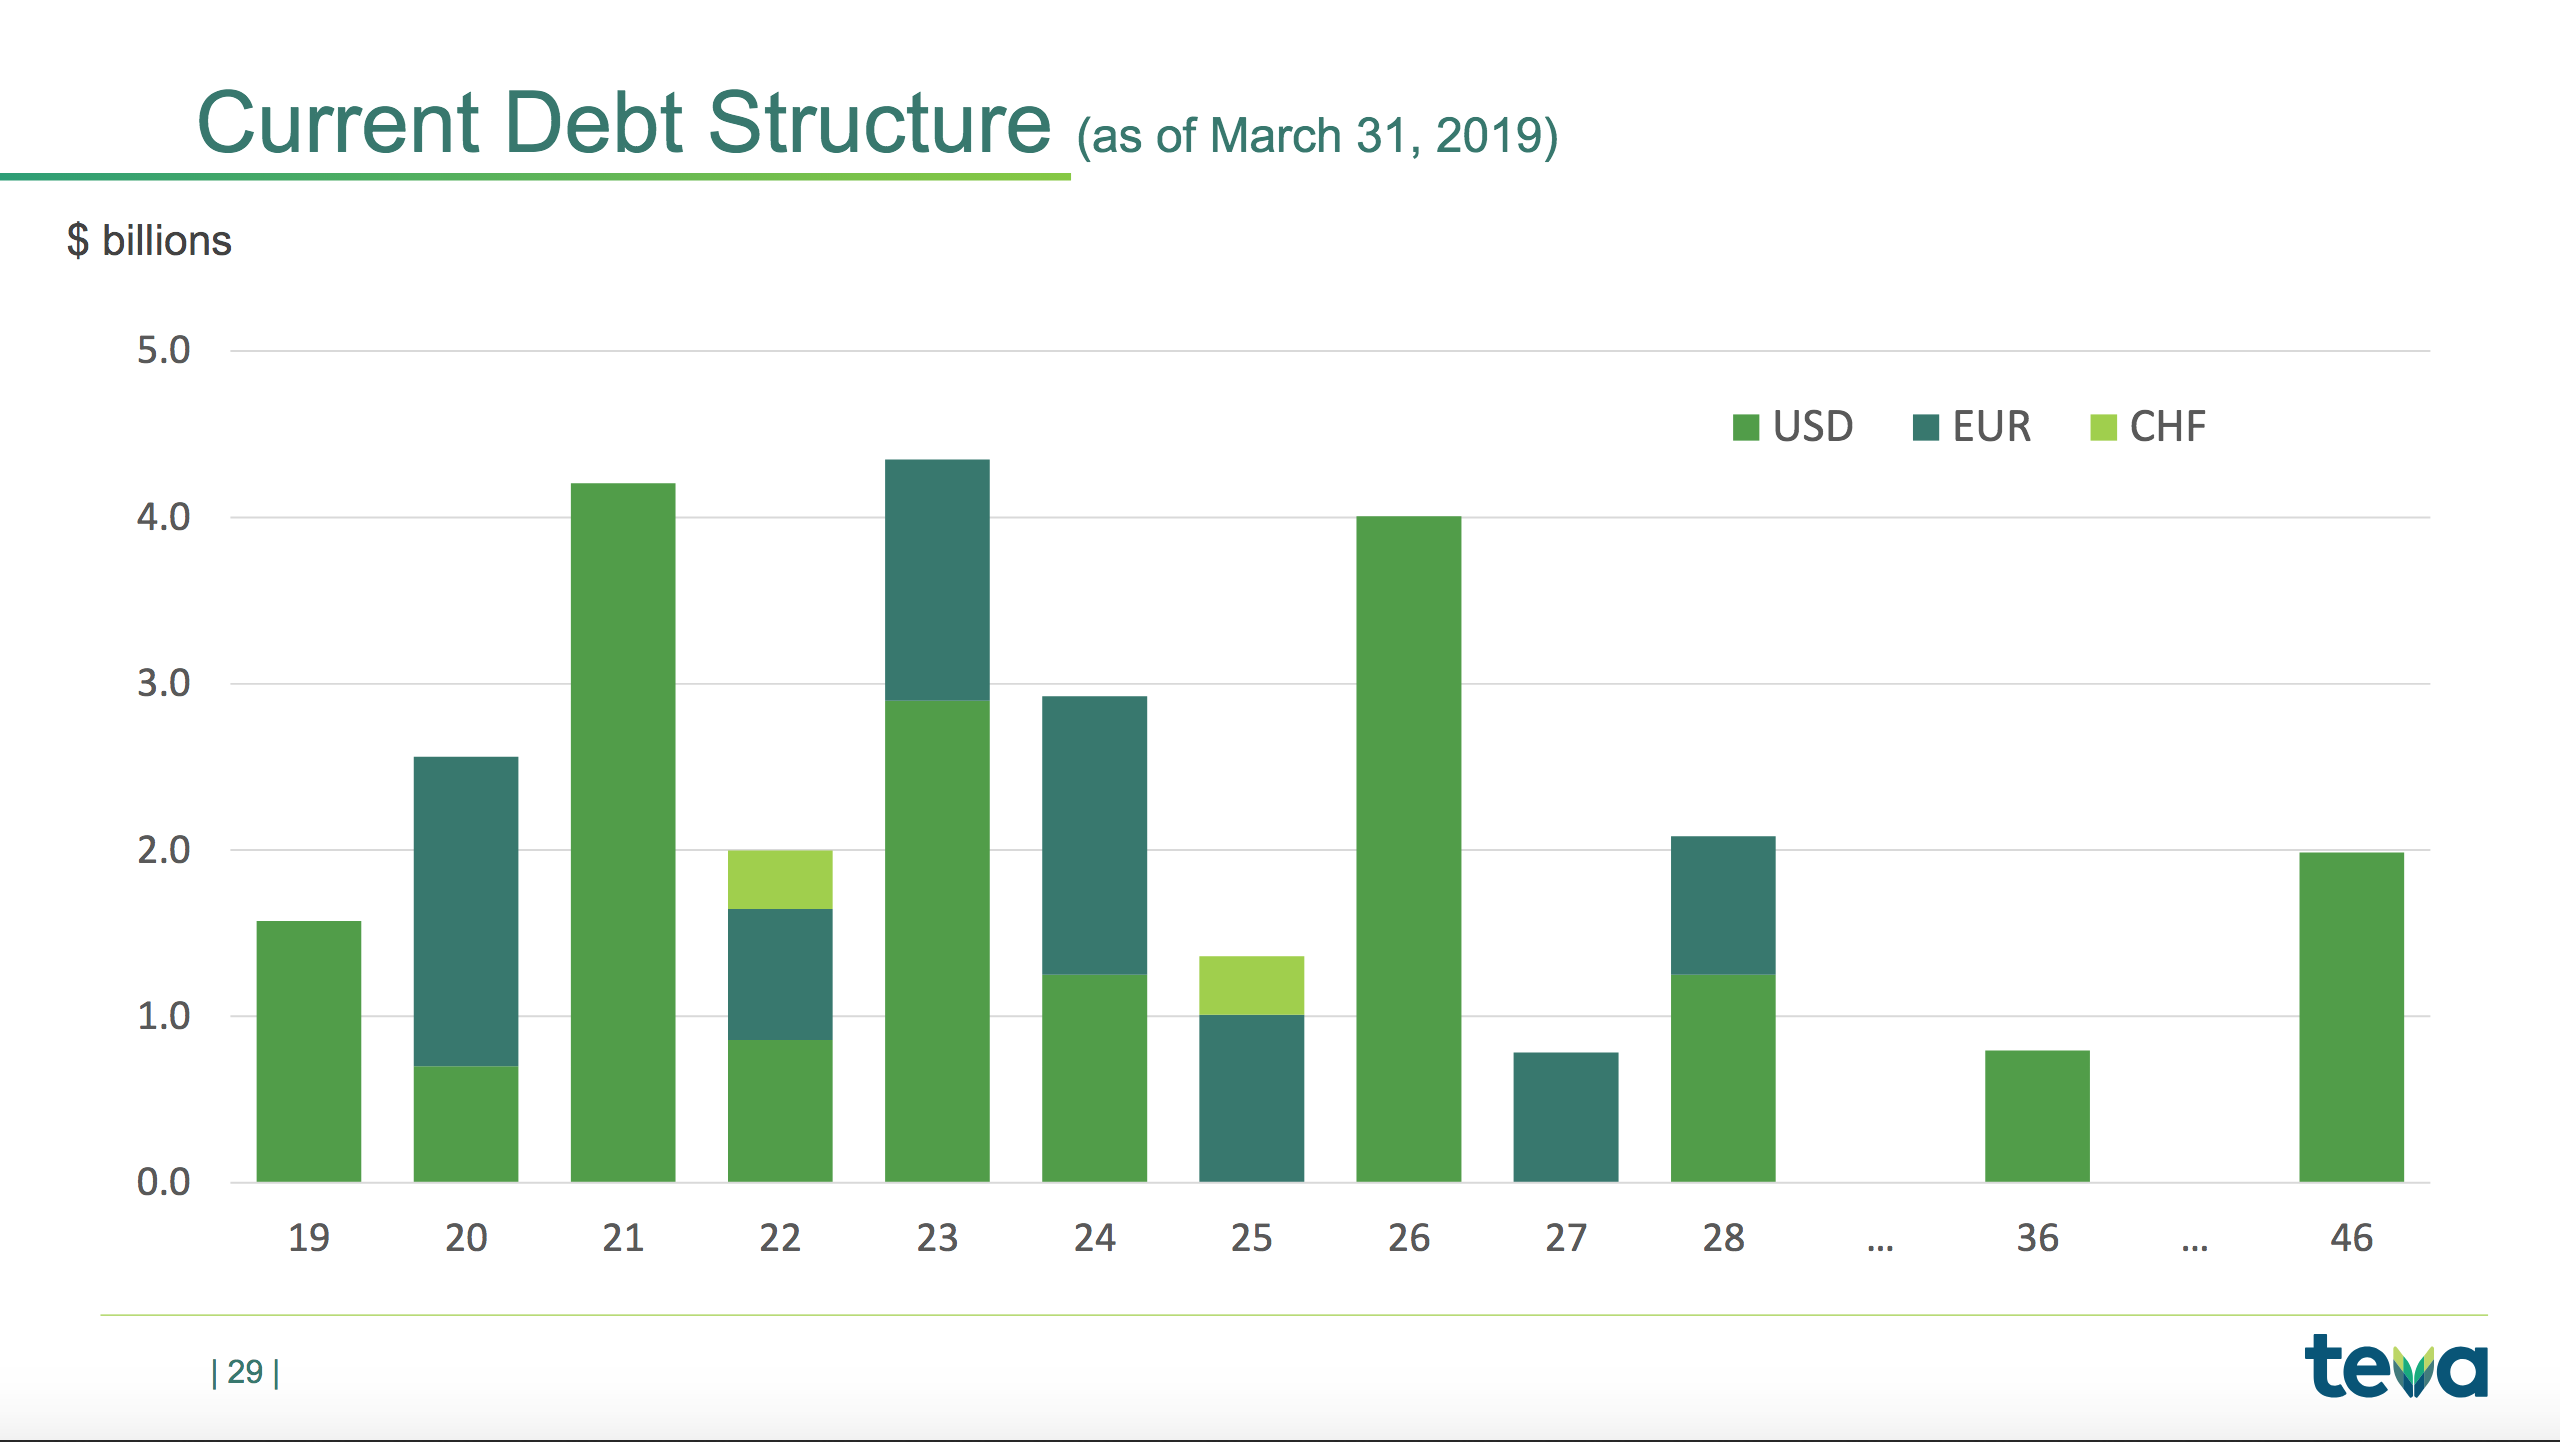
Debt Structure
CGRP migraine drugs
The quarterly sale of CGRP migraine drugs were:
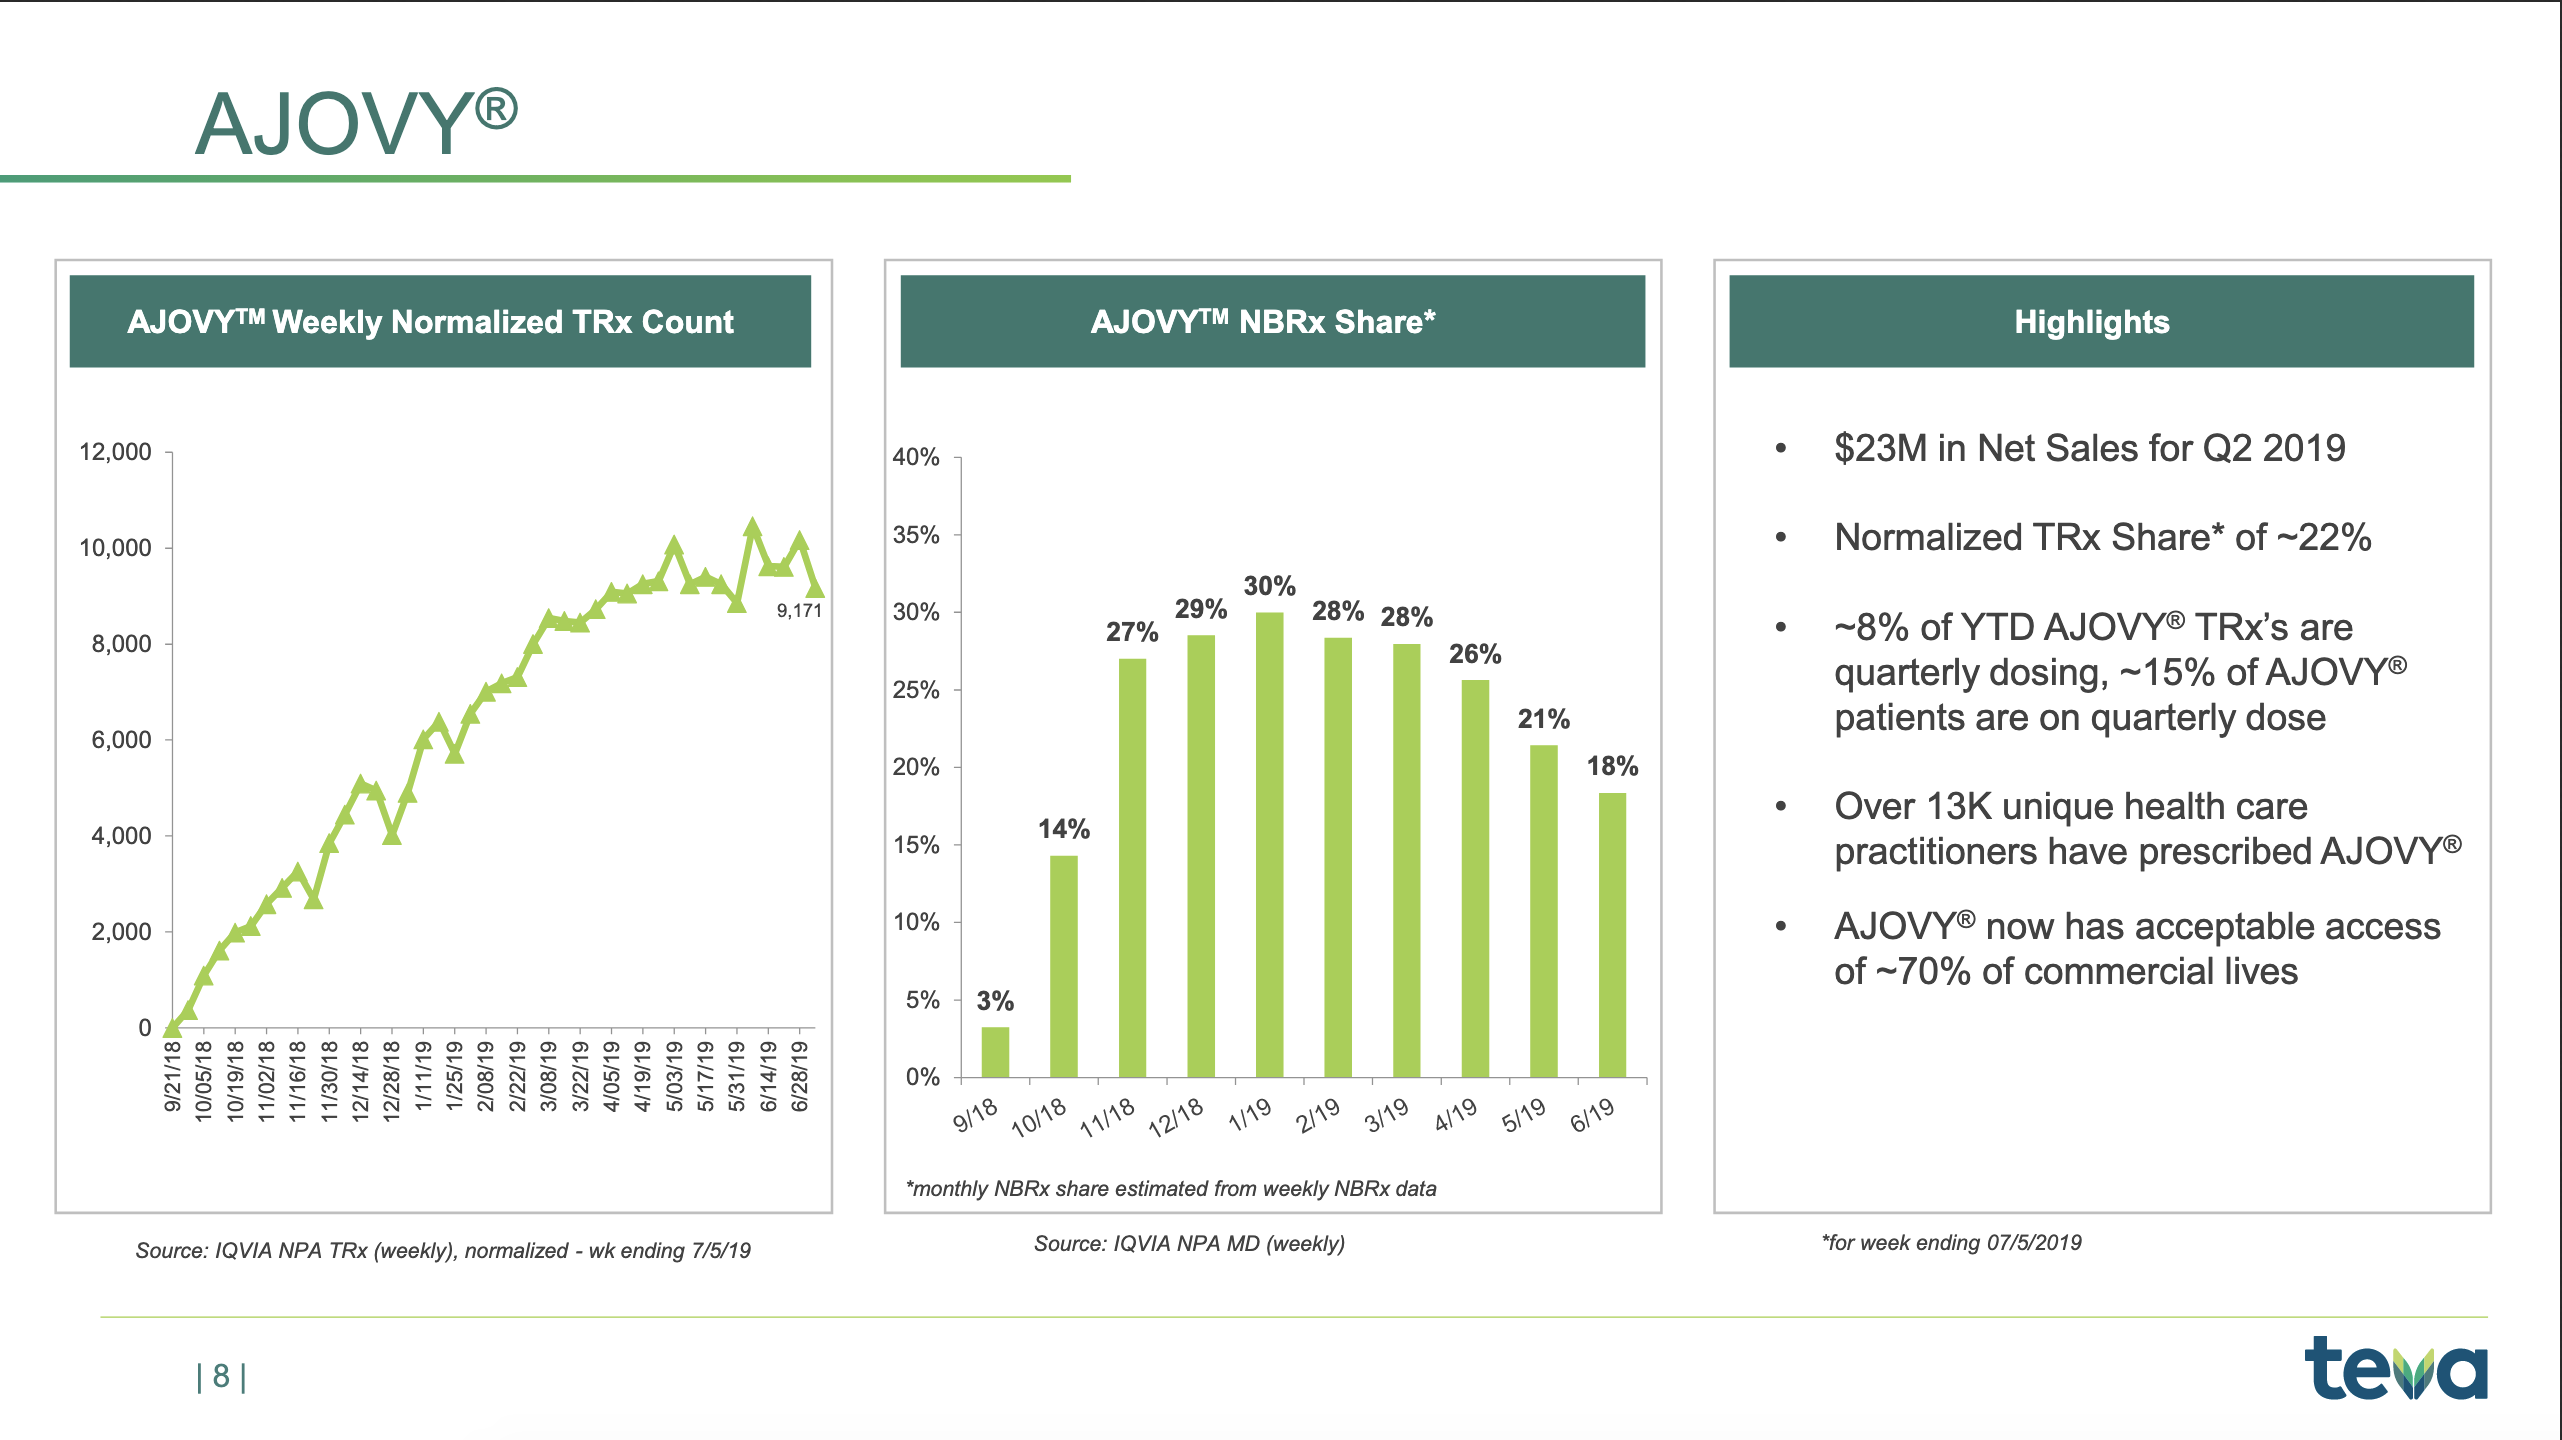
$23M Teva Ajovy® (Fremanezumab)
AJOVY revenues in our North America segment in the second quarter of 2019 were $23 million. AJOVY was approved by the FDA and launched in the United States in September 2018 for the preventive treatment of migraine in adults.
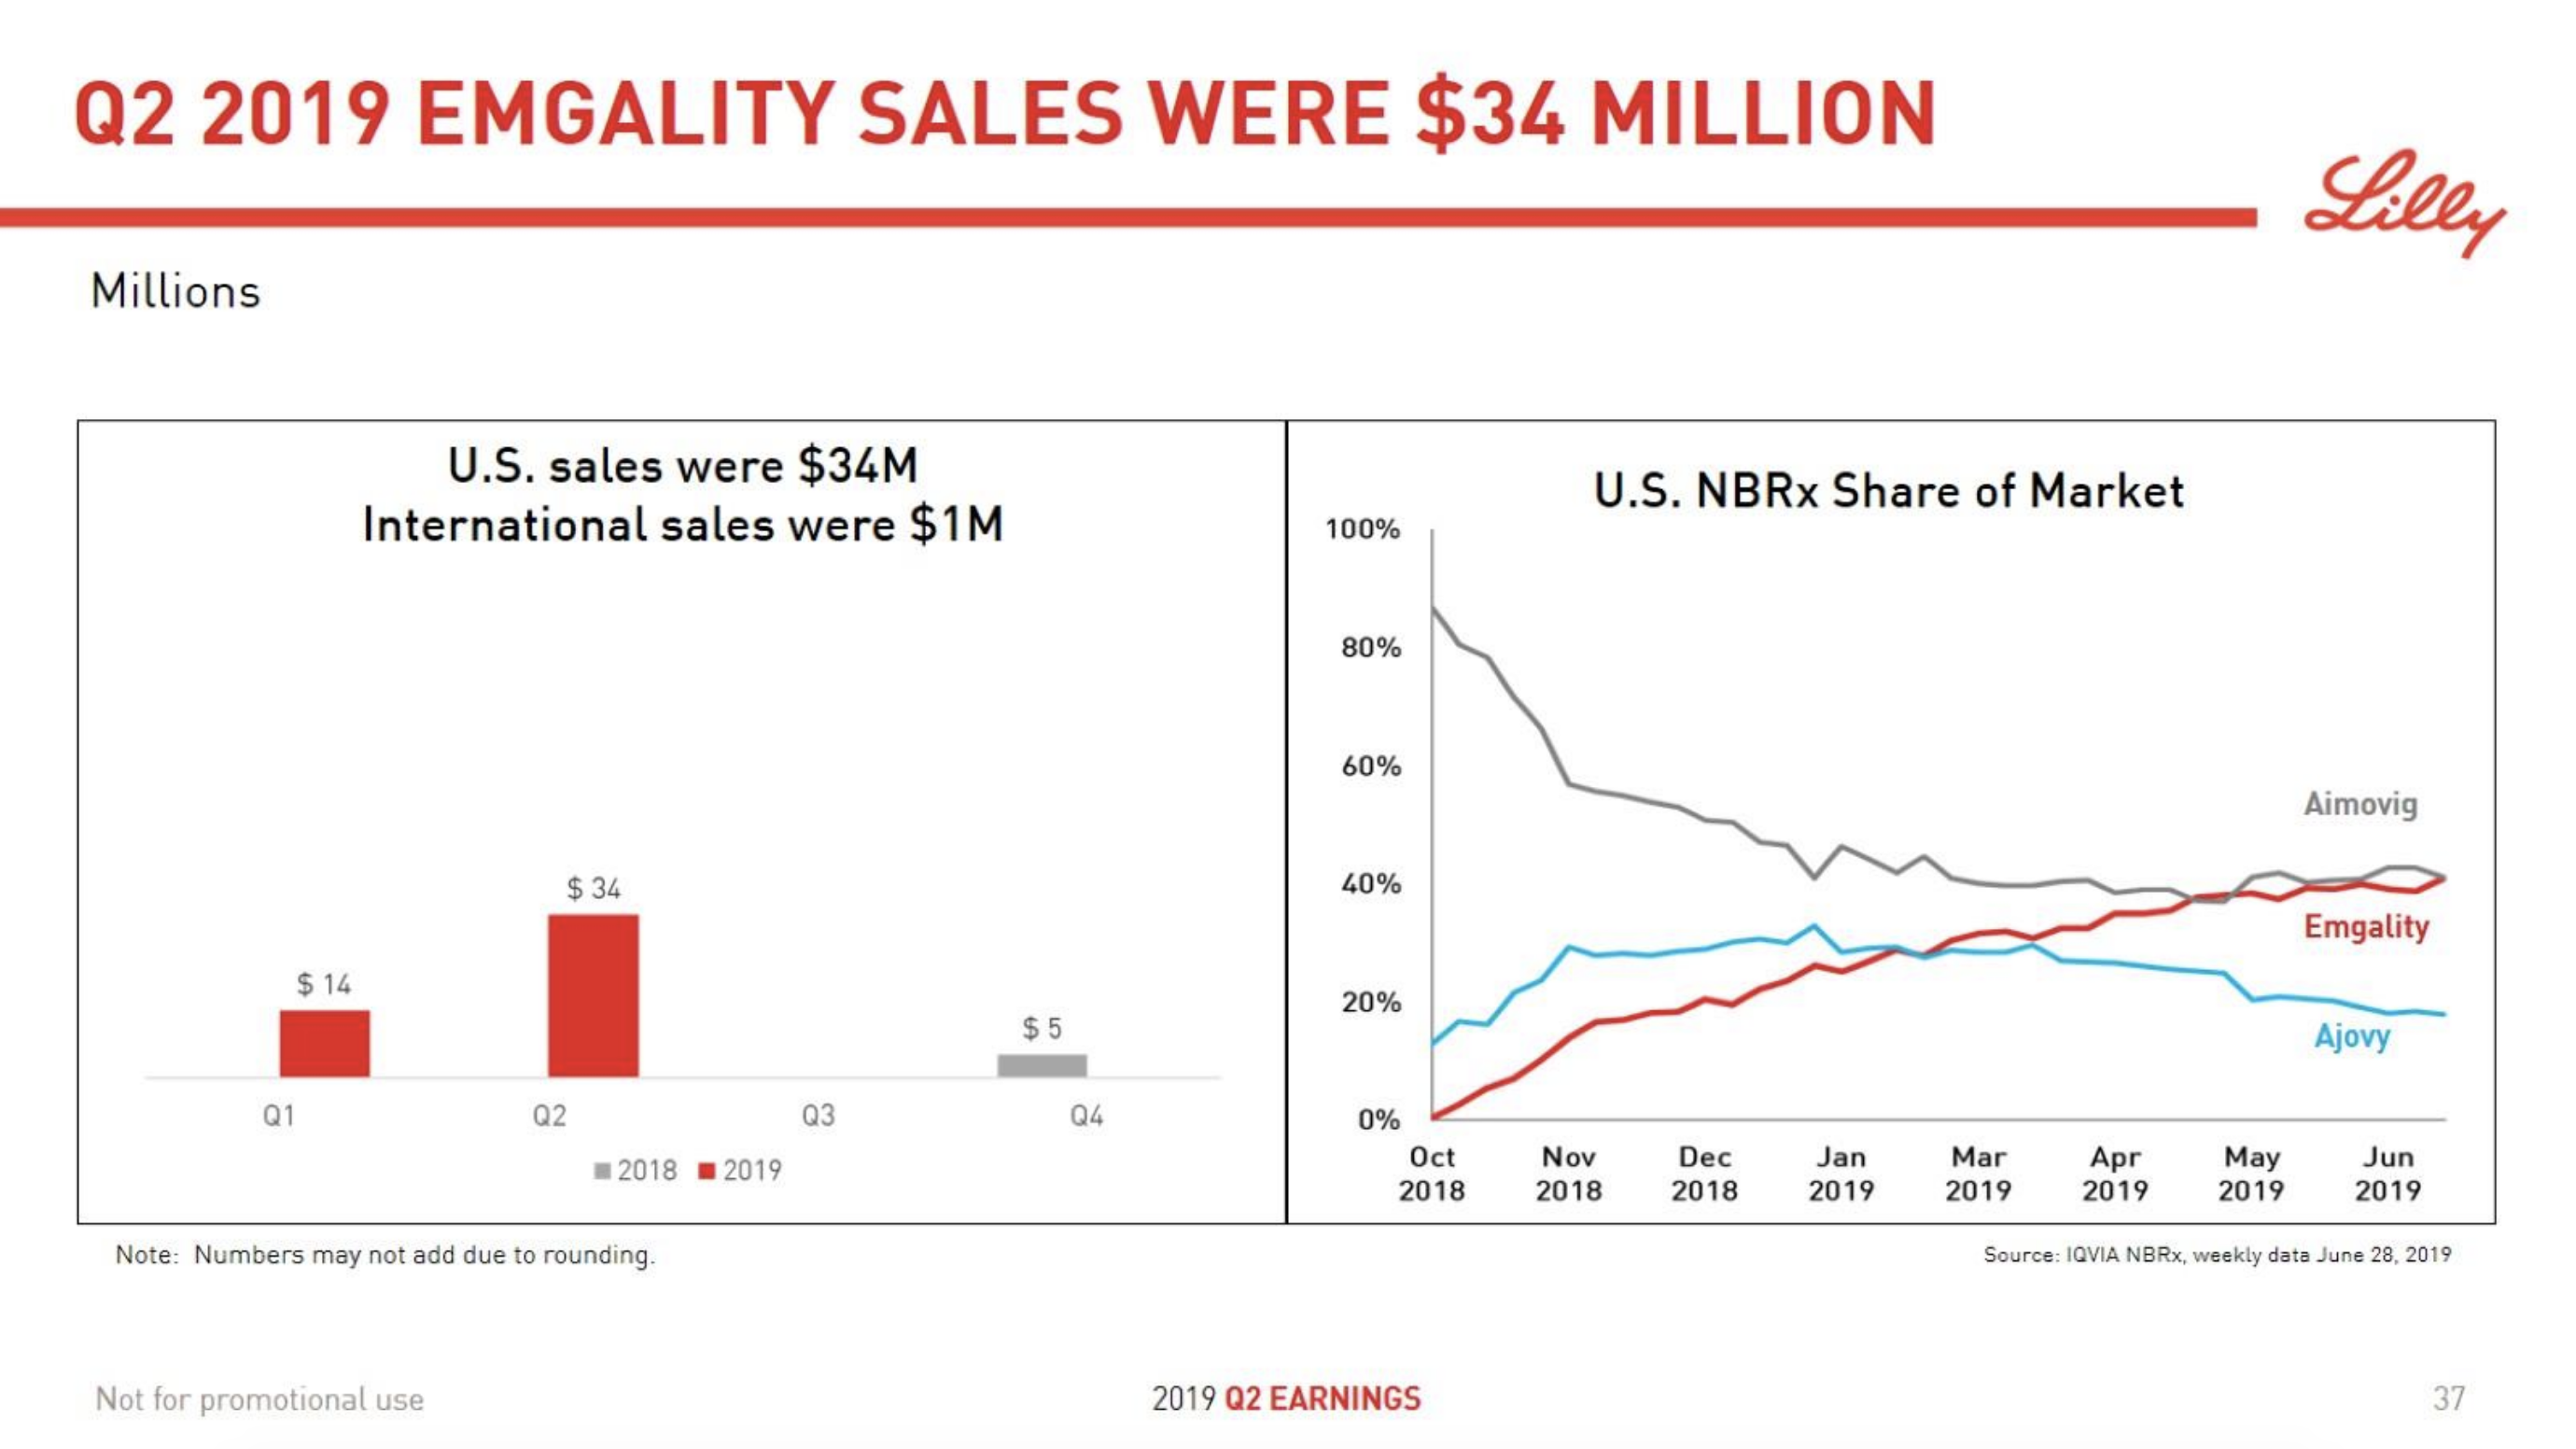
$34M Lilly Emgality® (Galcanezumab)
For the second quarter of 2019, Emgality generated worldwide revenue of $34.3 million, an increase of $20.1 million compared with the first quarter of 2019. U.S. revenue was $33.8 million, an increase of $21.7 million compared with the first quarter of 2019. Emgality launched in certain international markets in the first quarter of 2019 and generated revenue outside of the U.S. of $0.5 million in the second quarter of 2019.
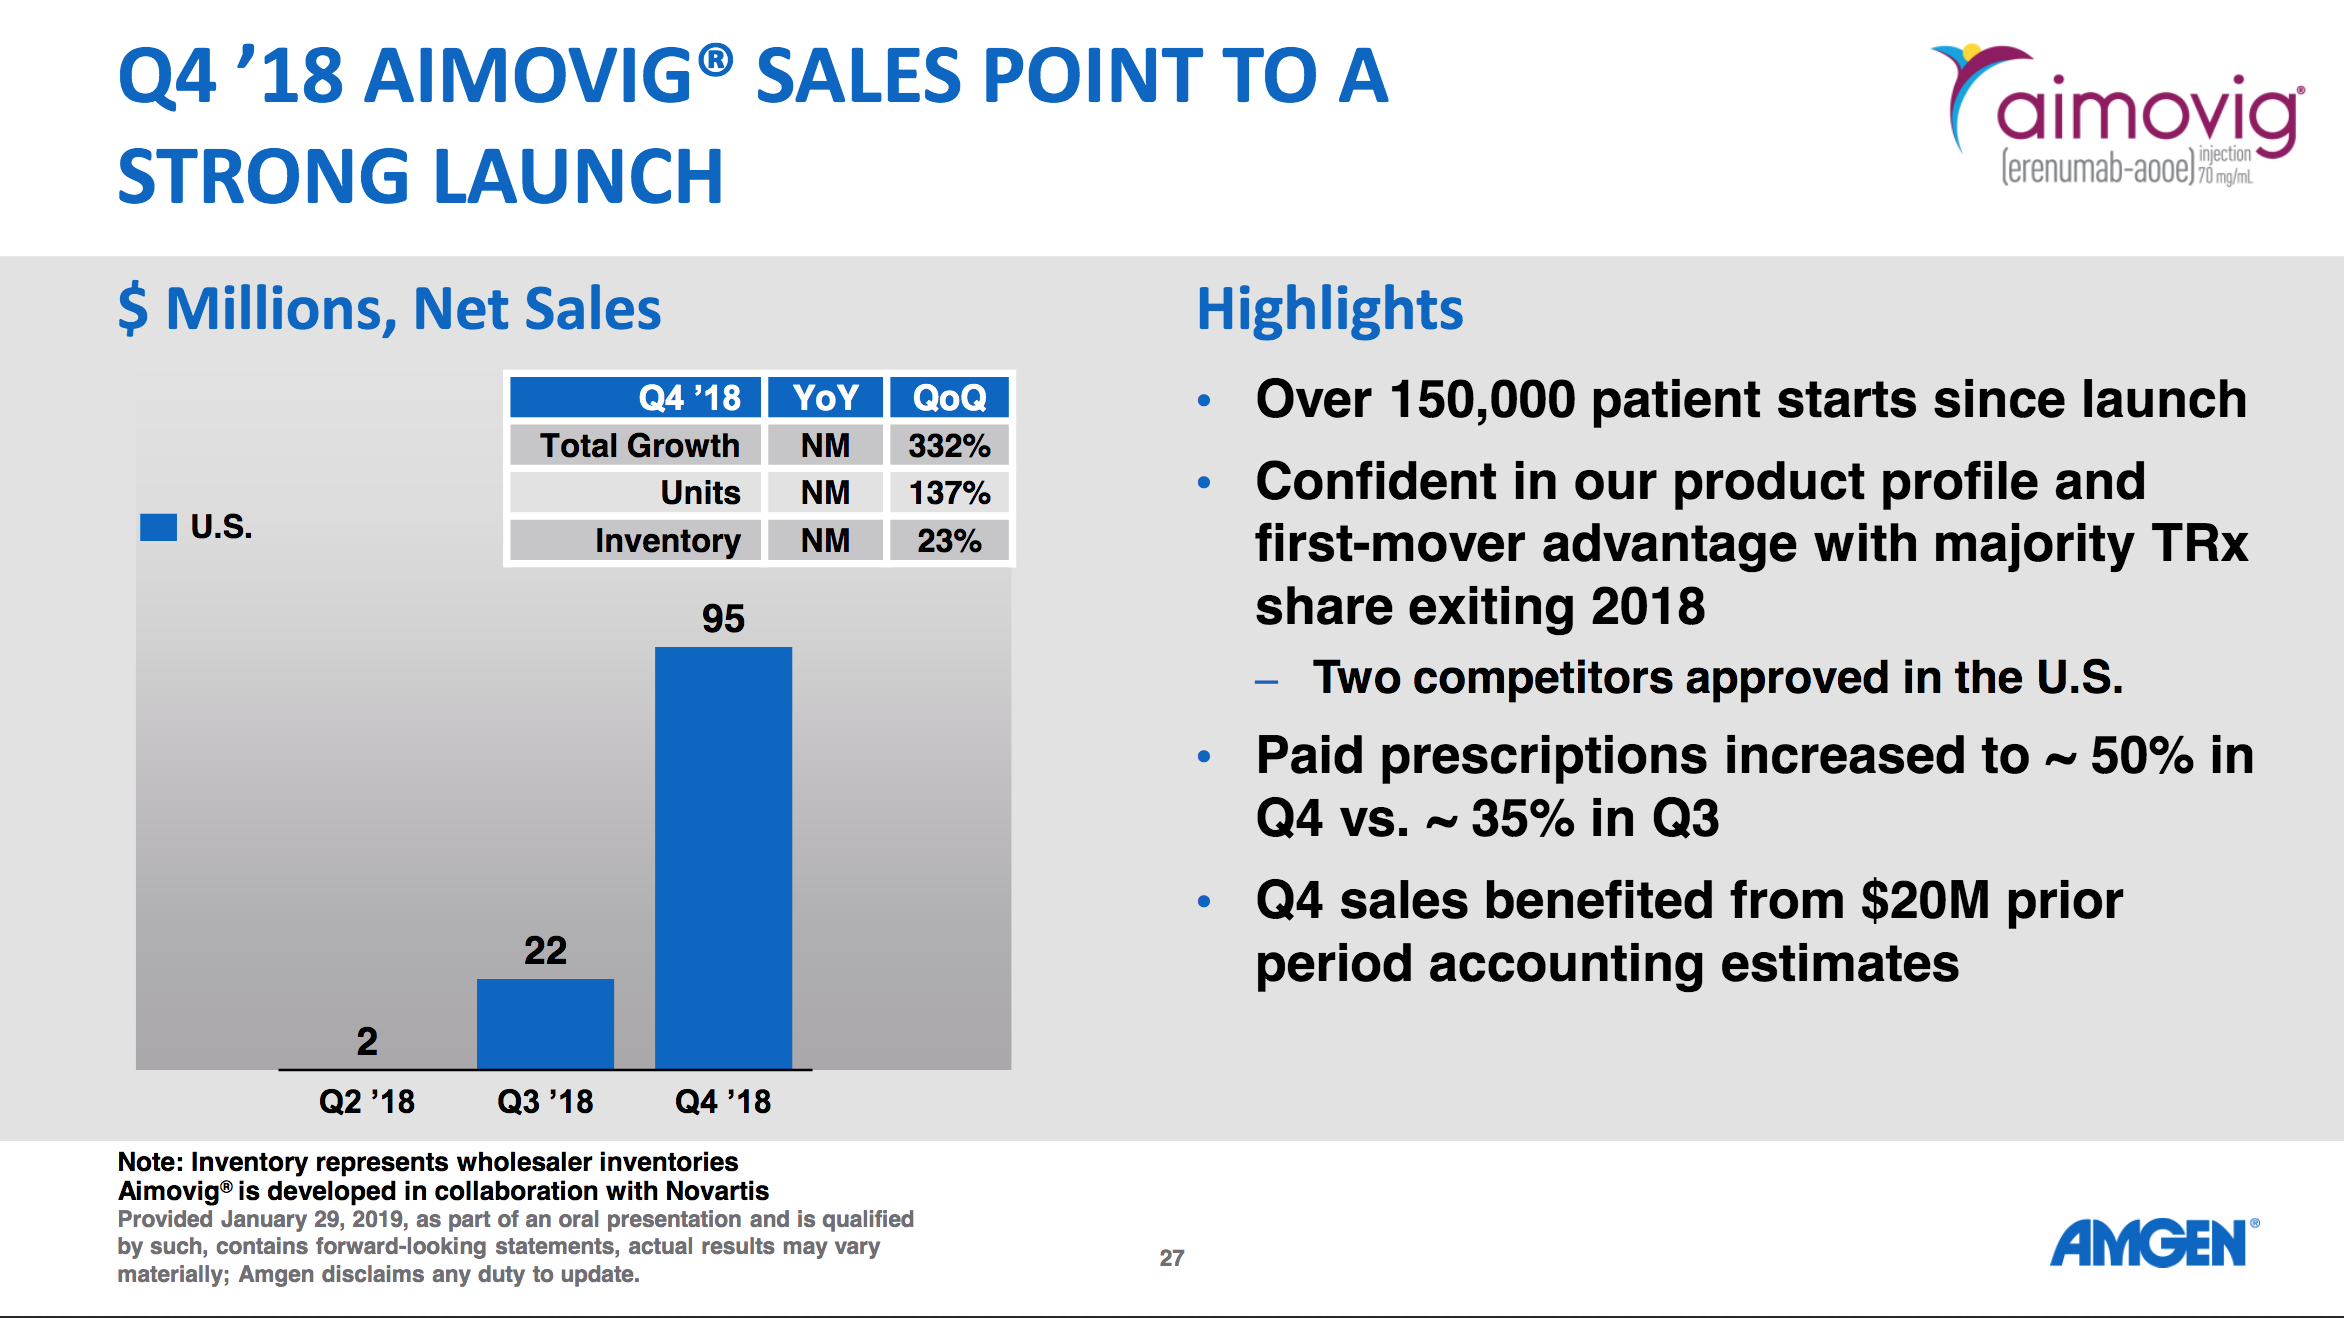
$83M Amgen Aimovig® (Erenumab)
Aimovig was launched in the U.S. in the second quarter of 2018 and generated $83 million in sales in the second quarter of 2019.
Below are important announcements regarding clinical studies and links to these studies.
On August 21st Teva announced that Fremanezumab data in The Lancet demonstrate clinically meaningful reduction in monthly migraine days versus placebo for patients with difficult-to-treat migraine.
On August 5th Lilly announced positive results for Emgality® (galcanezumab) from the CONQUER study in patients who failed previous migraine preventive treatments.
On May 2nd Amgen announced it would highlight extensive long-term safety and efficacy data of Aimovig® (erenumab) across the spectrum of migraine at the American Academy of Neurology annual meeting.
Below are slides and excerpts from earnings call transcripts.
We are very happy about the strong launch we’ve had of AJOVY. We still have above 20% TRx share in U.S., and we have just started the launches in Europe. We’ve seen a moderate decline in the NBRx share. We think it’s related to a couple of factors. One being the fact that we’ve stopped the full pay-down on all scripts, which means that some scripts where we are not covered actually do get declined at the pharmacy level. And we also see that, in some cases, the patients do prefer an auto-injector, and therefore, of course, we are very eagerly awaiting the approval and the launch of our own auto-injector for AJOVY.
And of course, we’re anxiously awaiting the approval of our auto-injection device and the launch of that device which we expect in the next six months. That will be a second stimulus, really, a second phase of our launch, and we expect a significant boost to our new-to-brand and our TRx share as a result of that.
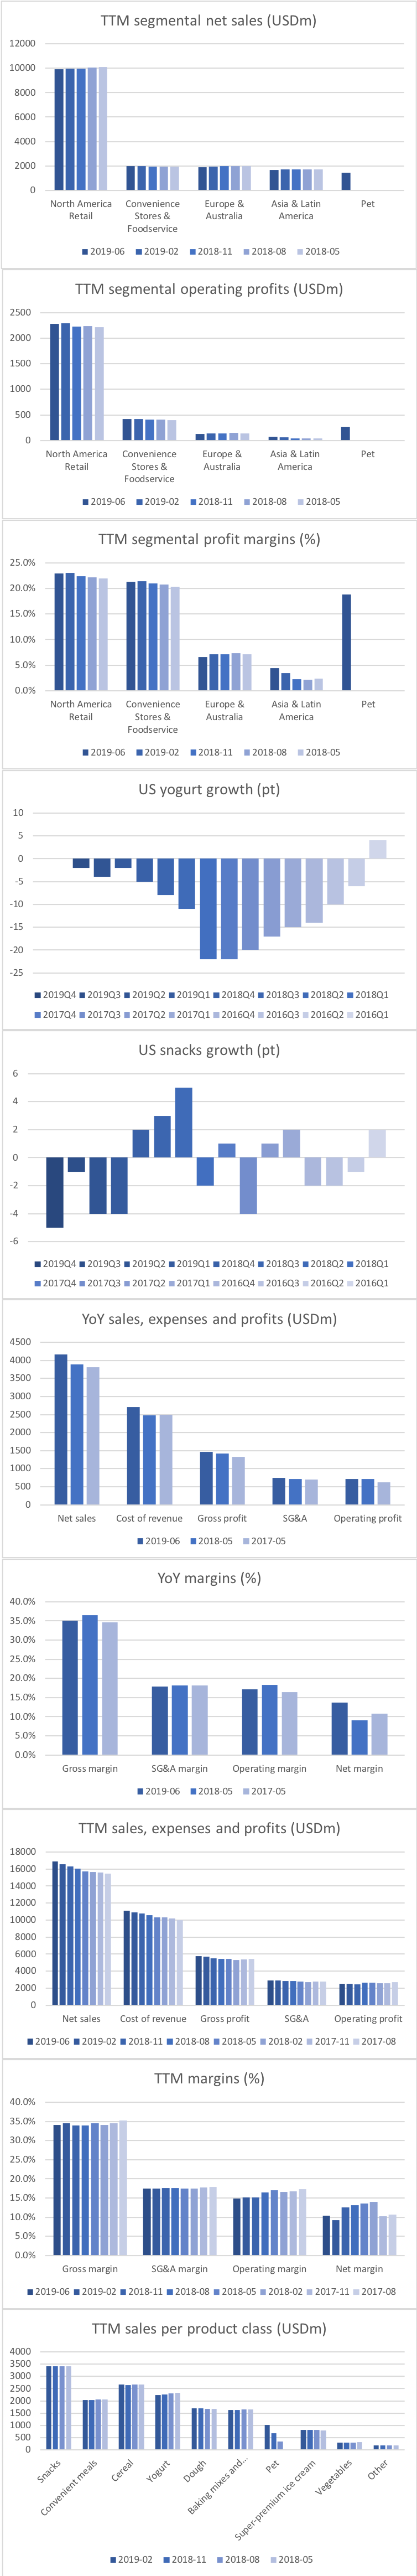
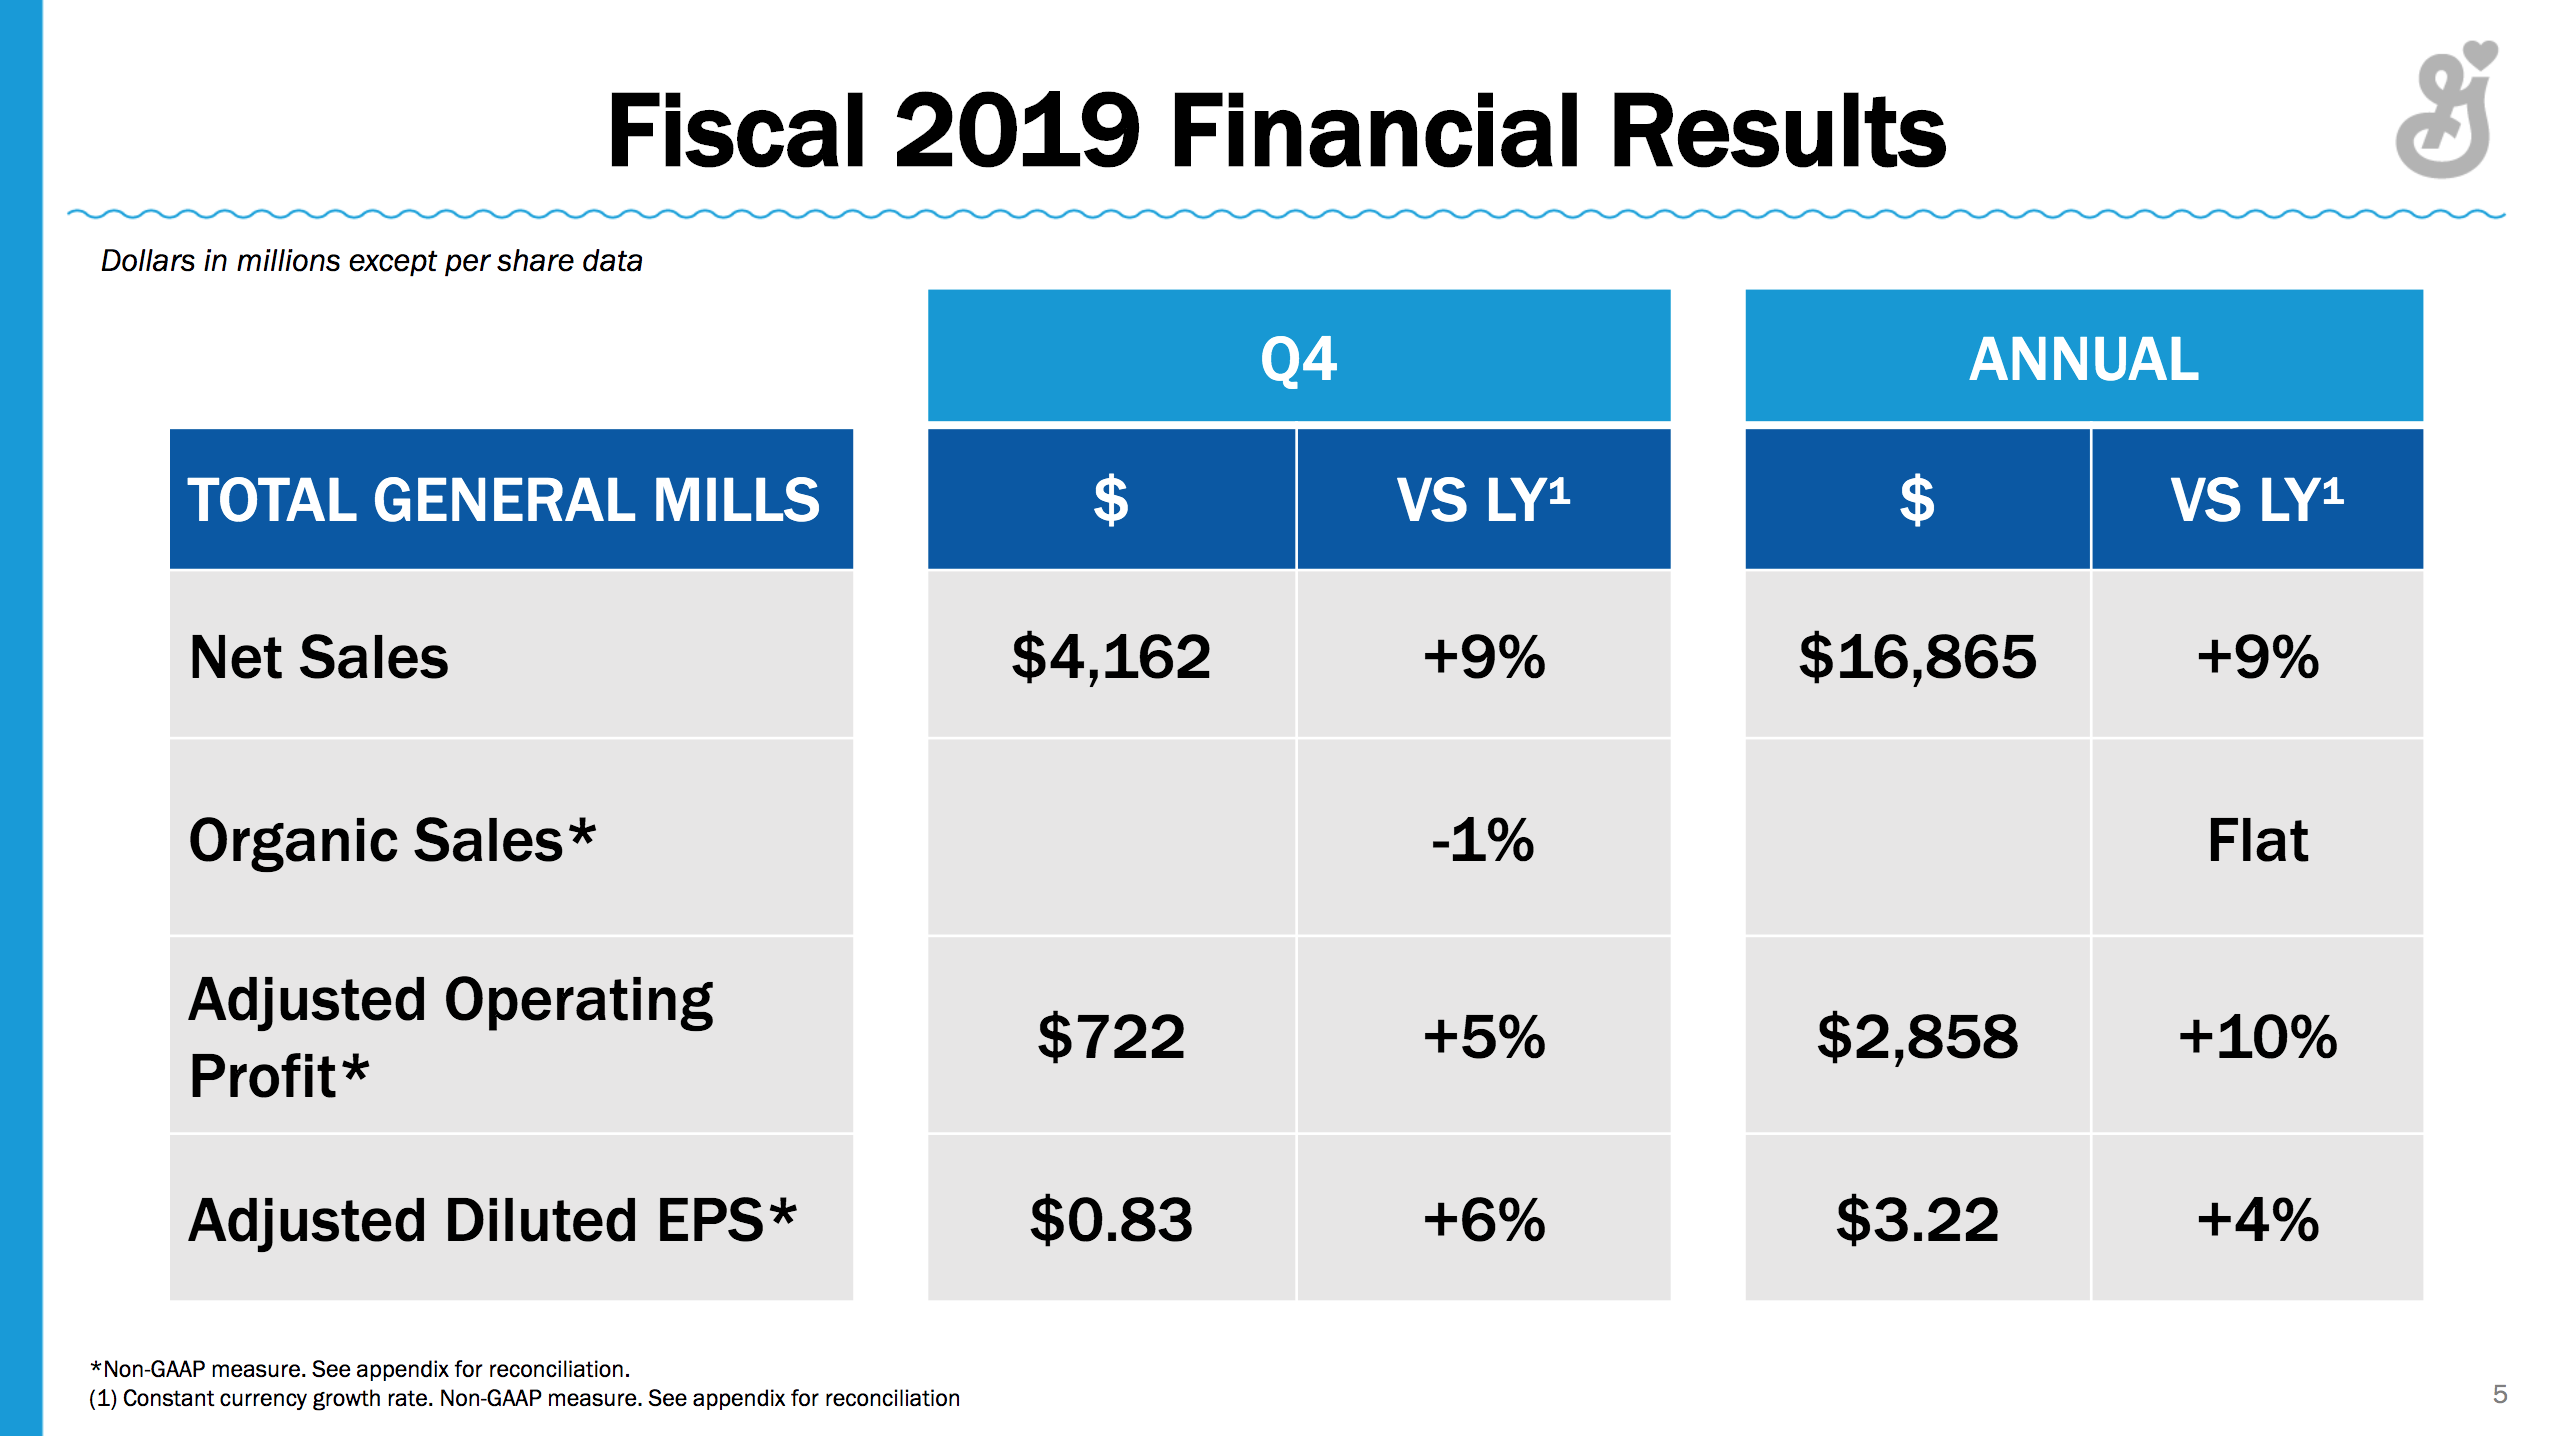
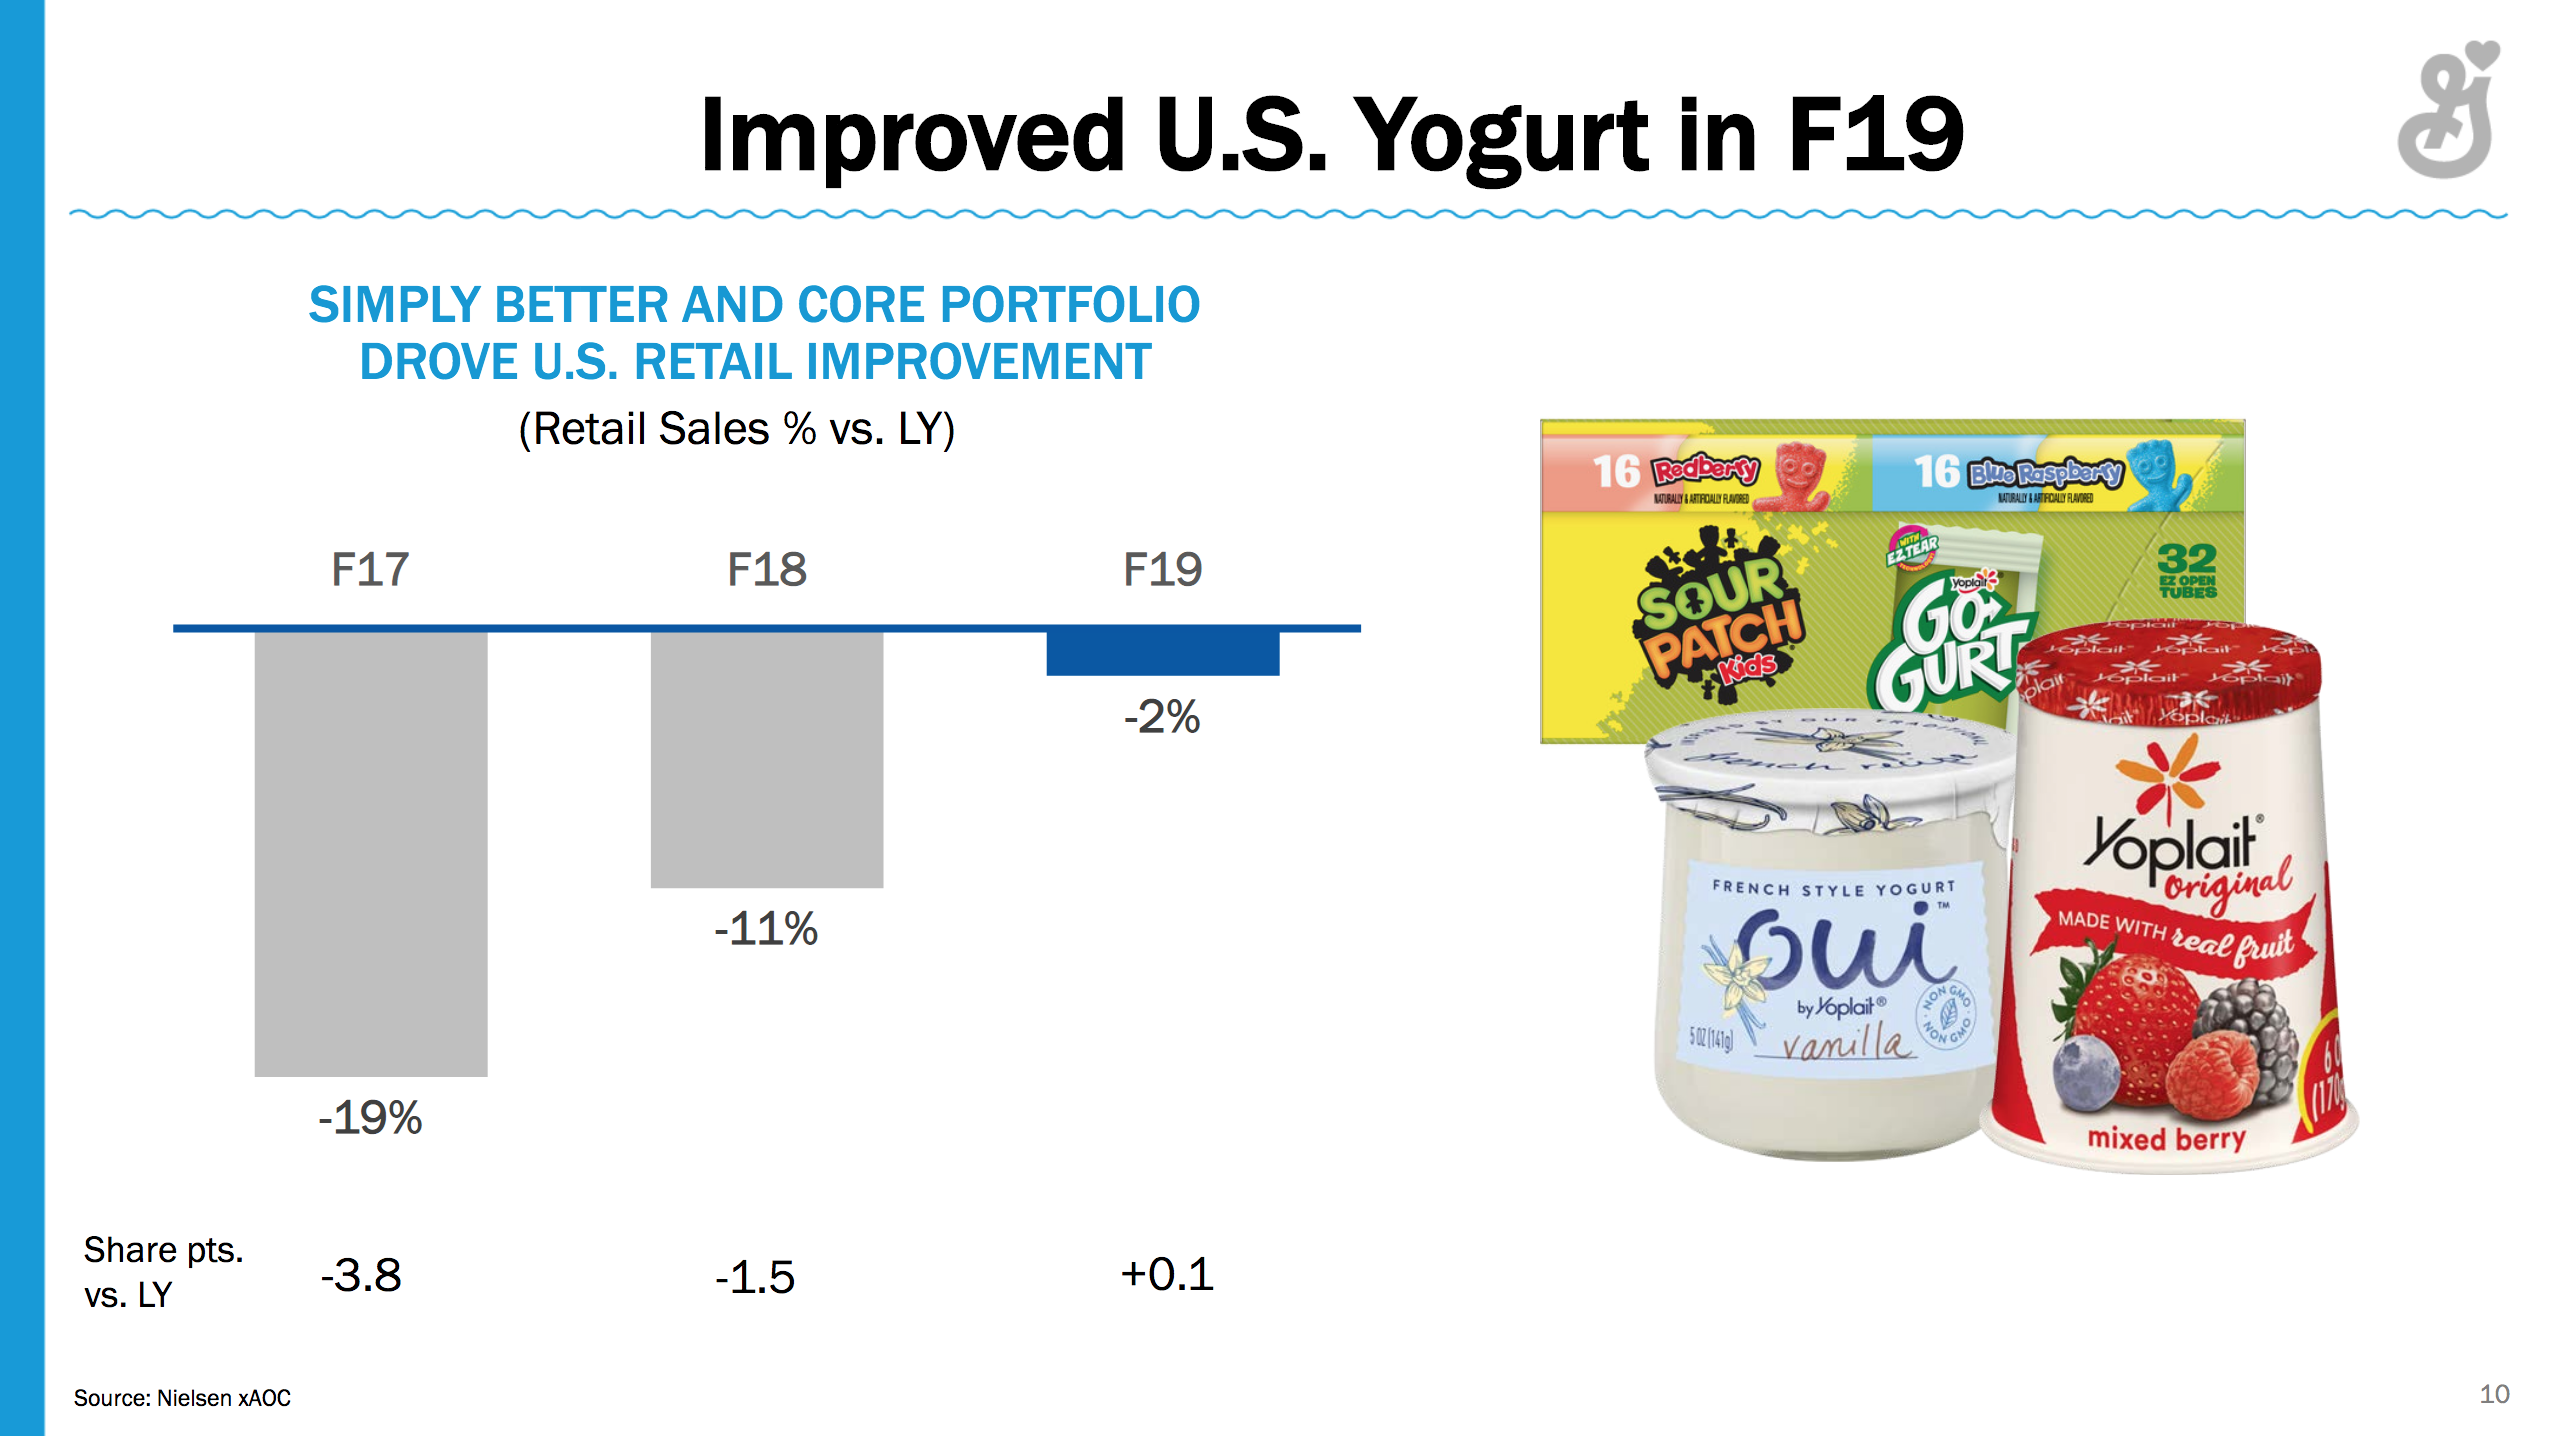
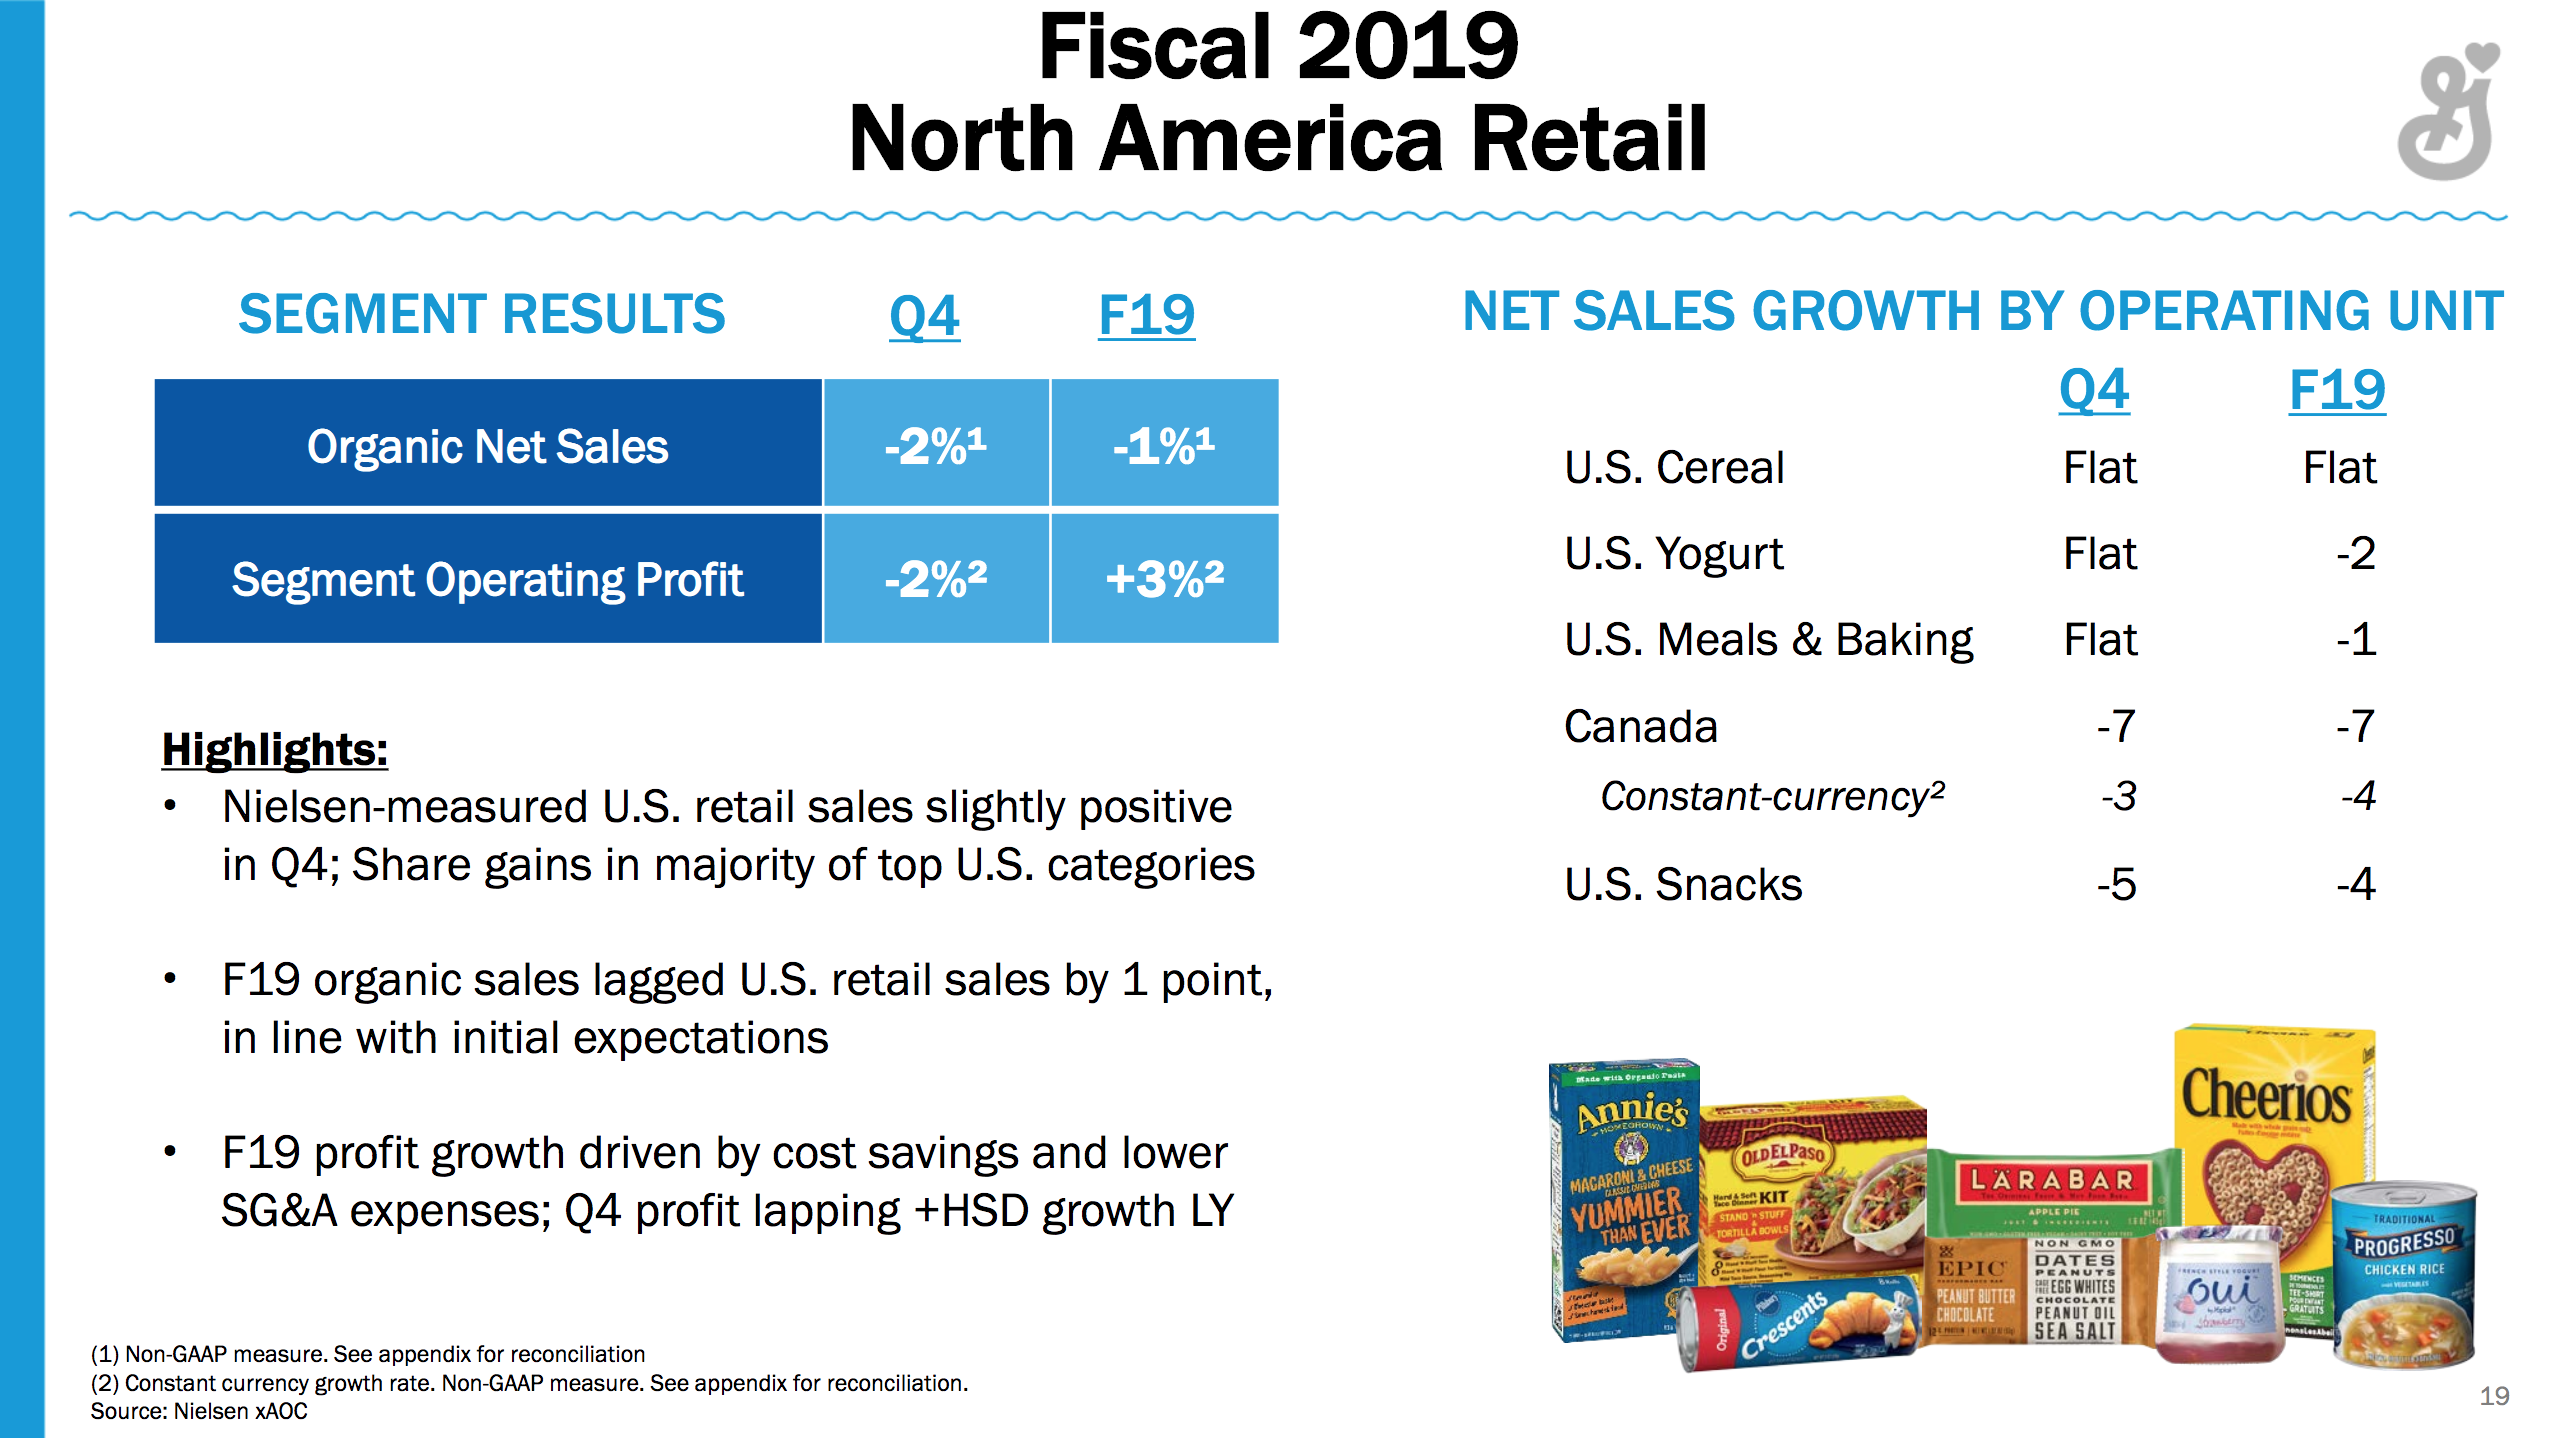
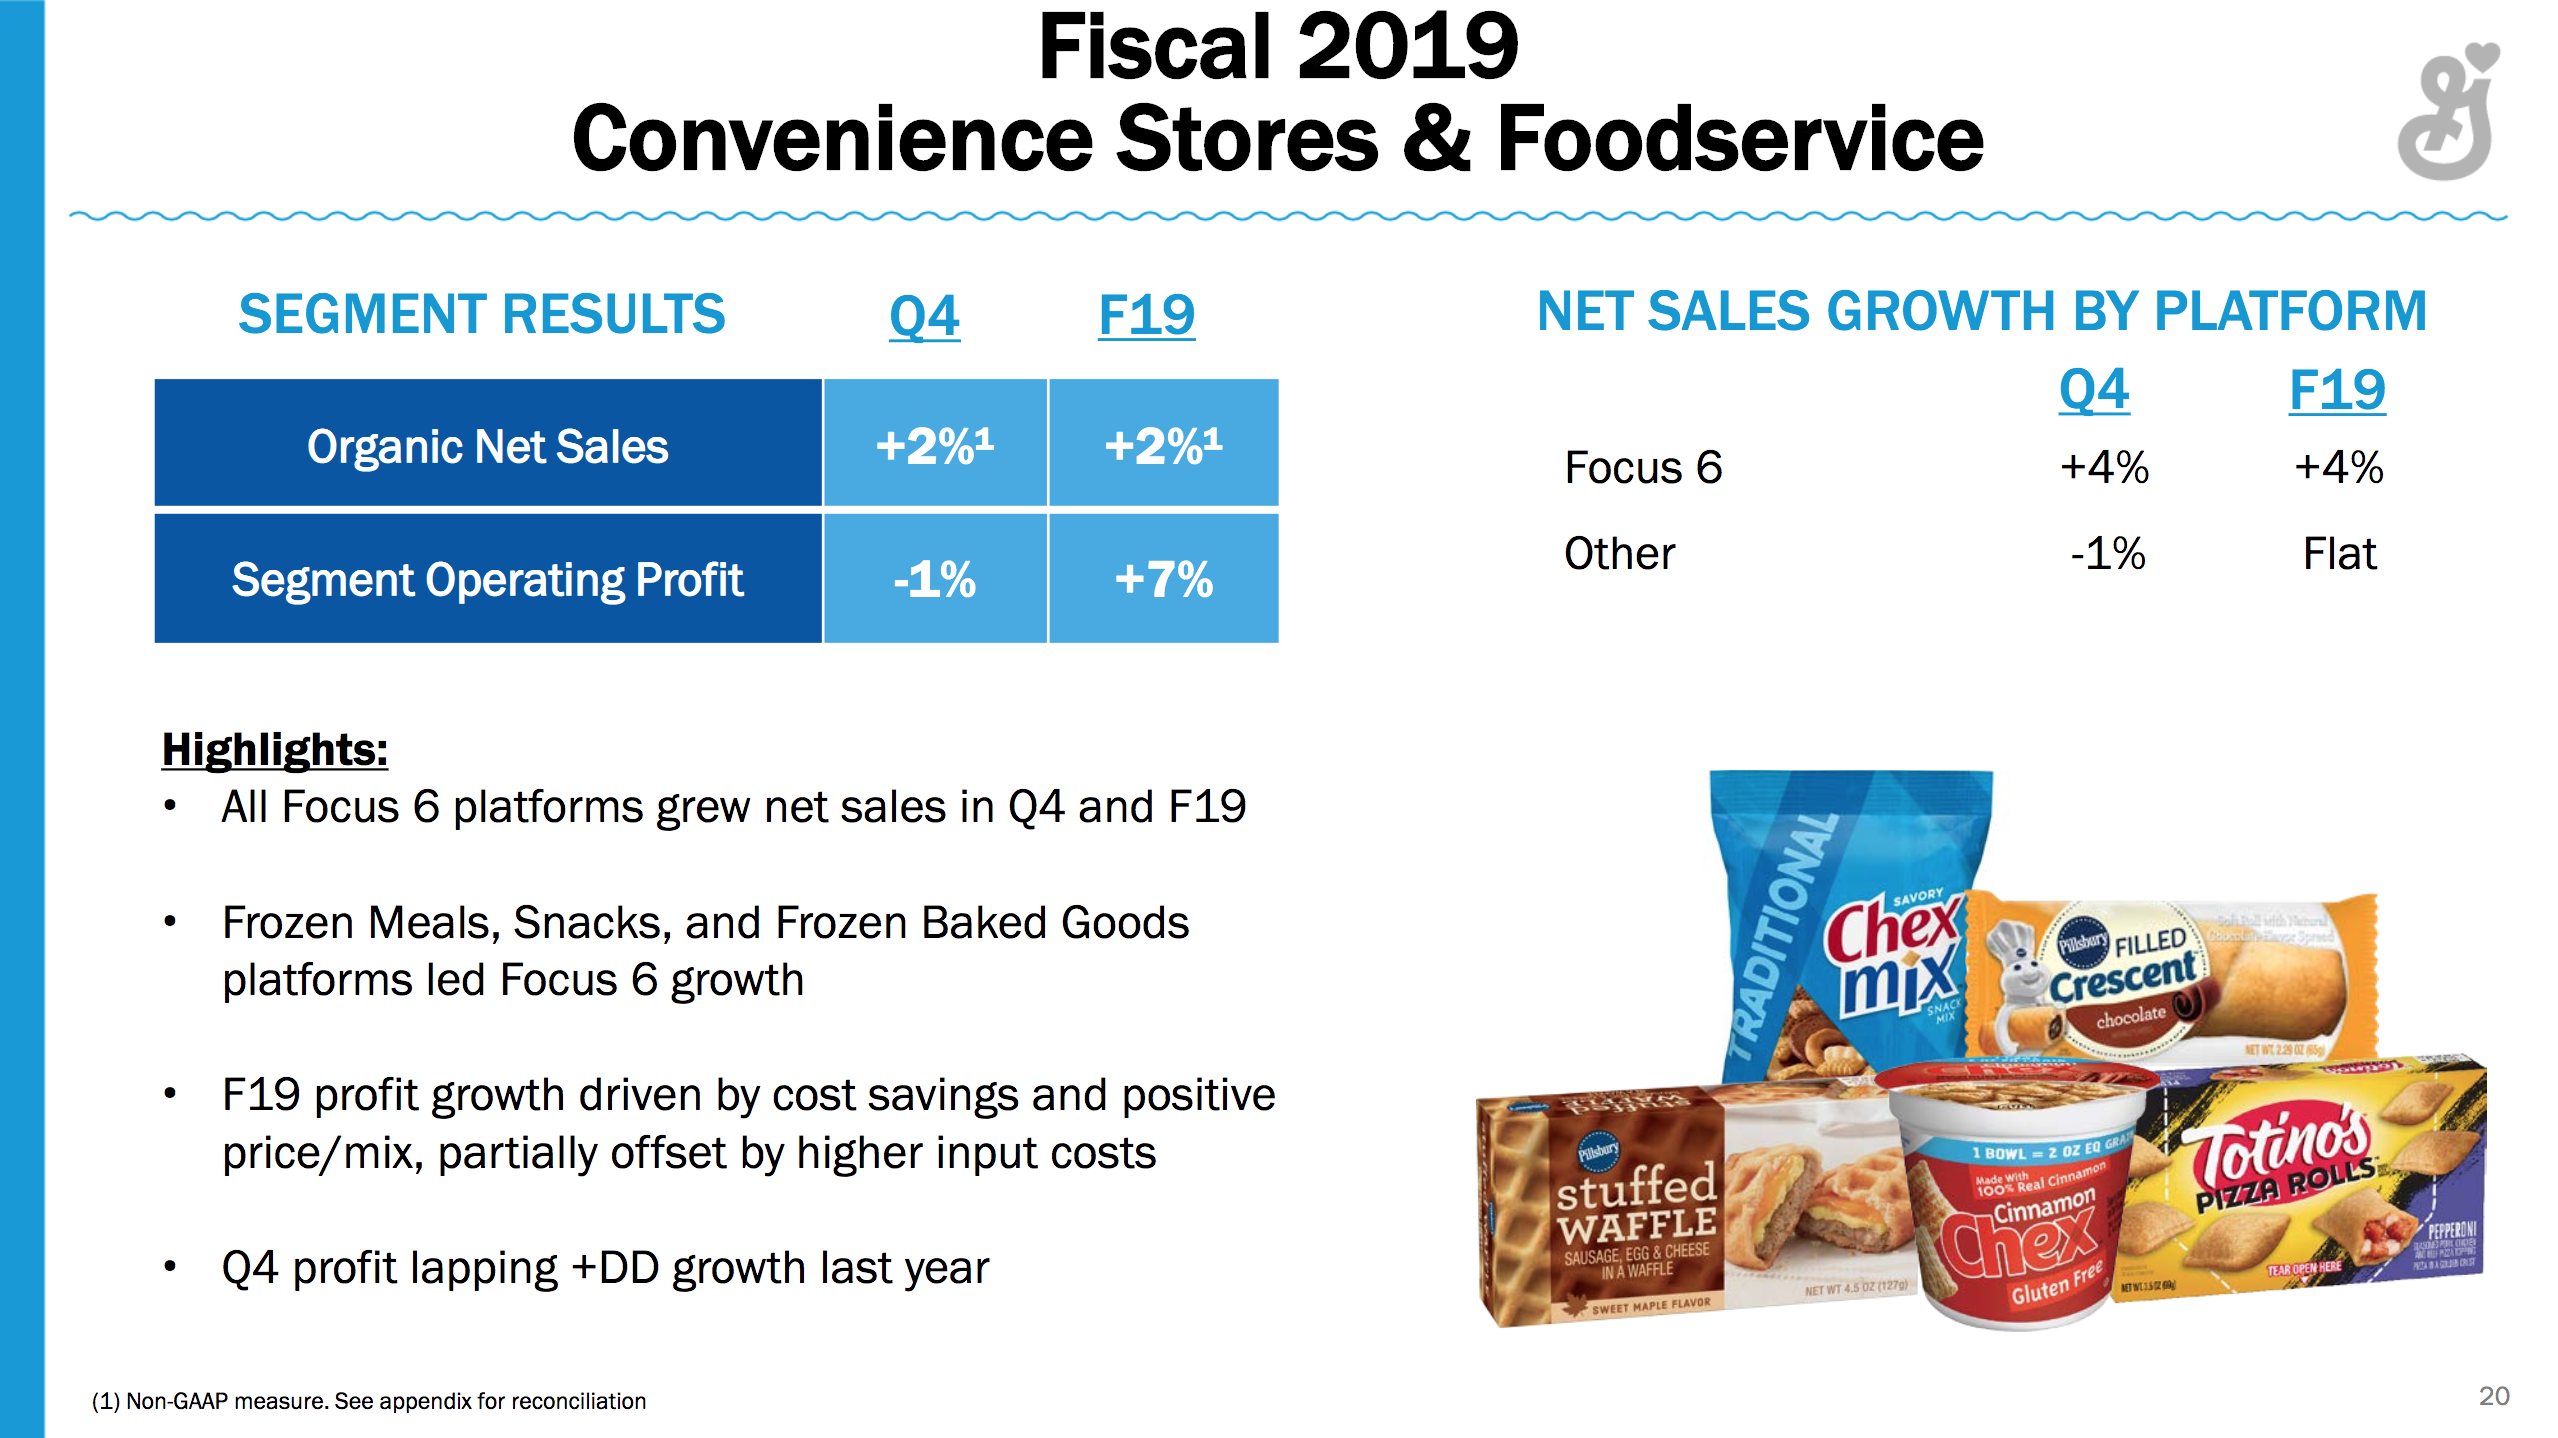
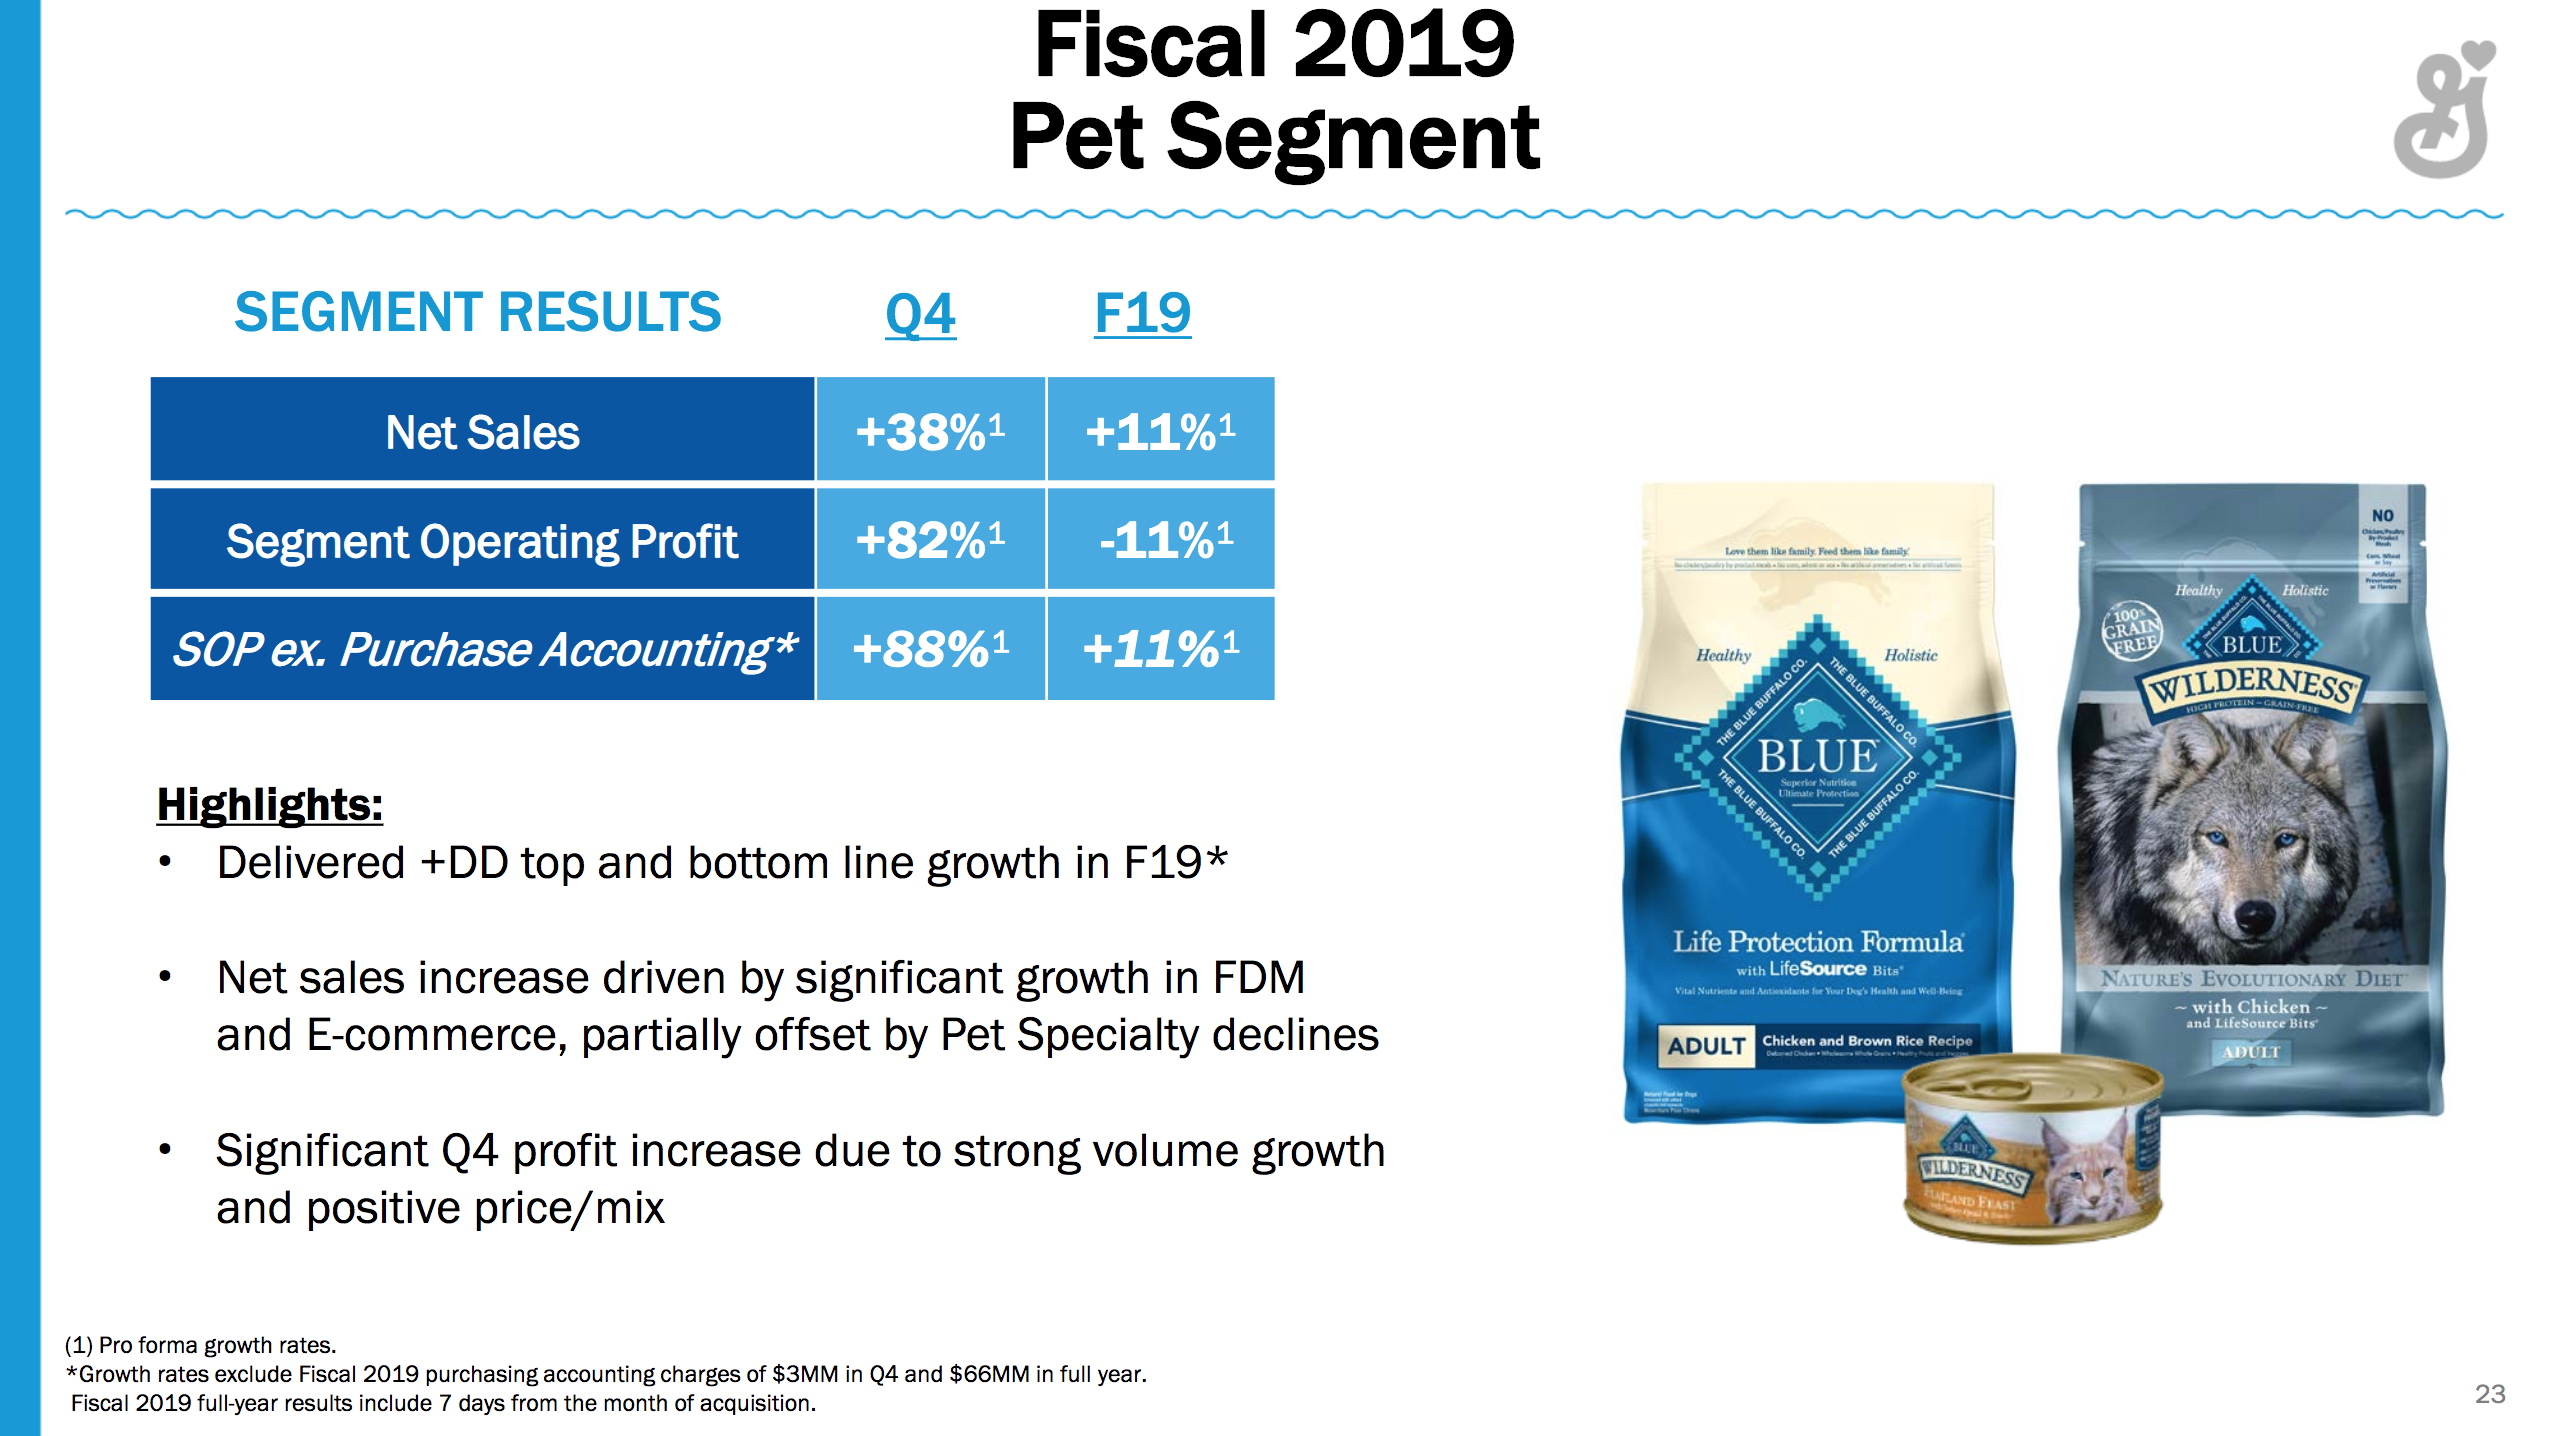
General Mills ($GIS) issued a press release on their quarterly earnings. Sale of yogurt in the US has stabilised after several consecutive quarters of market share losses to Chobani. Sales in the pet segment are up by 11% on an annual basis (and 38% on a quarterly YoY basis) following the acquisition of Blue Buffalo. Snacks however are down by 5%; hot snacks gaining market share and fruit snacks losing market share. That combined with the share price reaching fair valuation might have sent the stock price down by as much as 9.6% at one point during the day. The stock price closed down 4.4% at $51.31. The fair value is probably somewhere in the mid 50s.
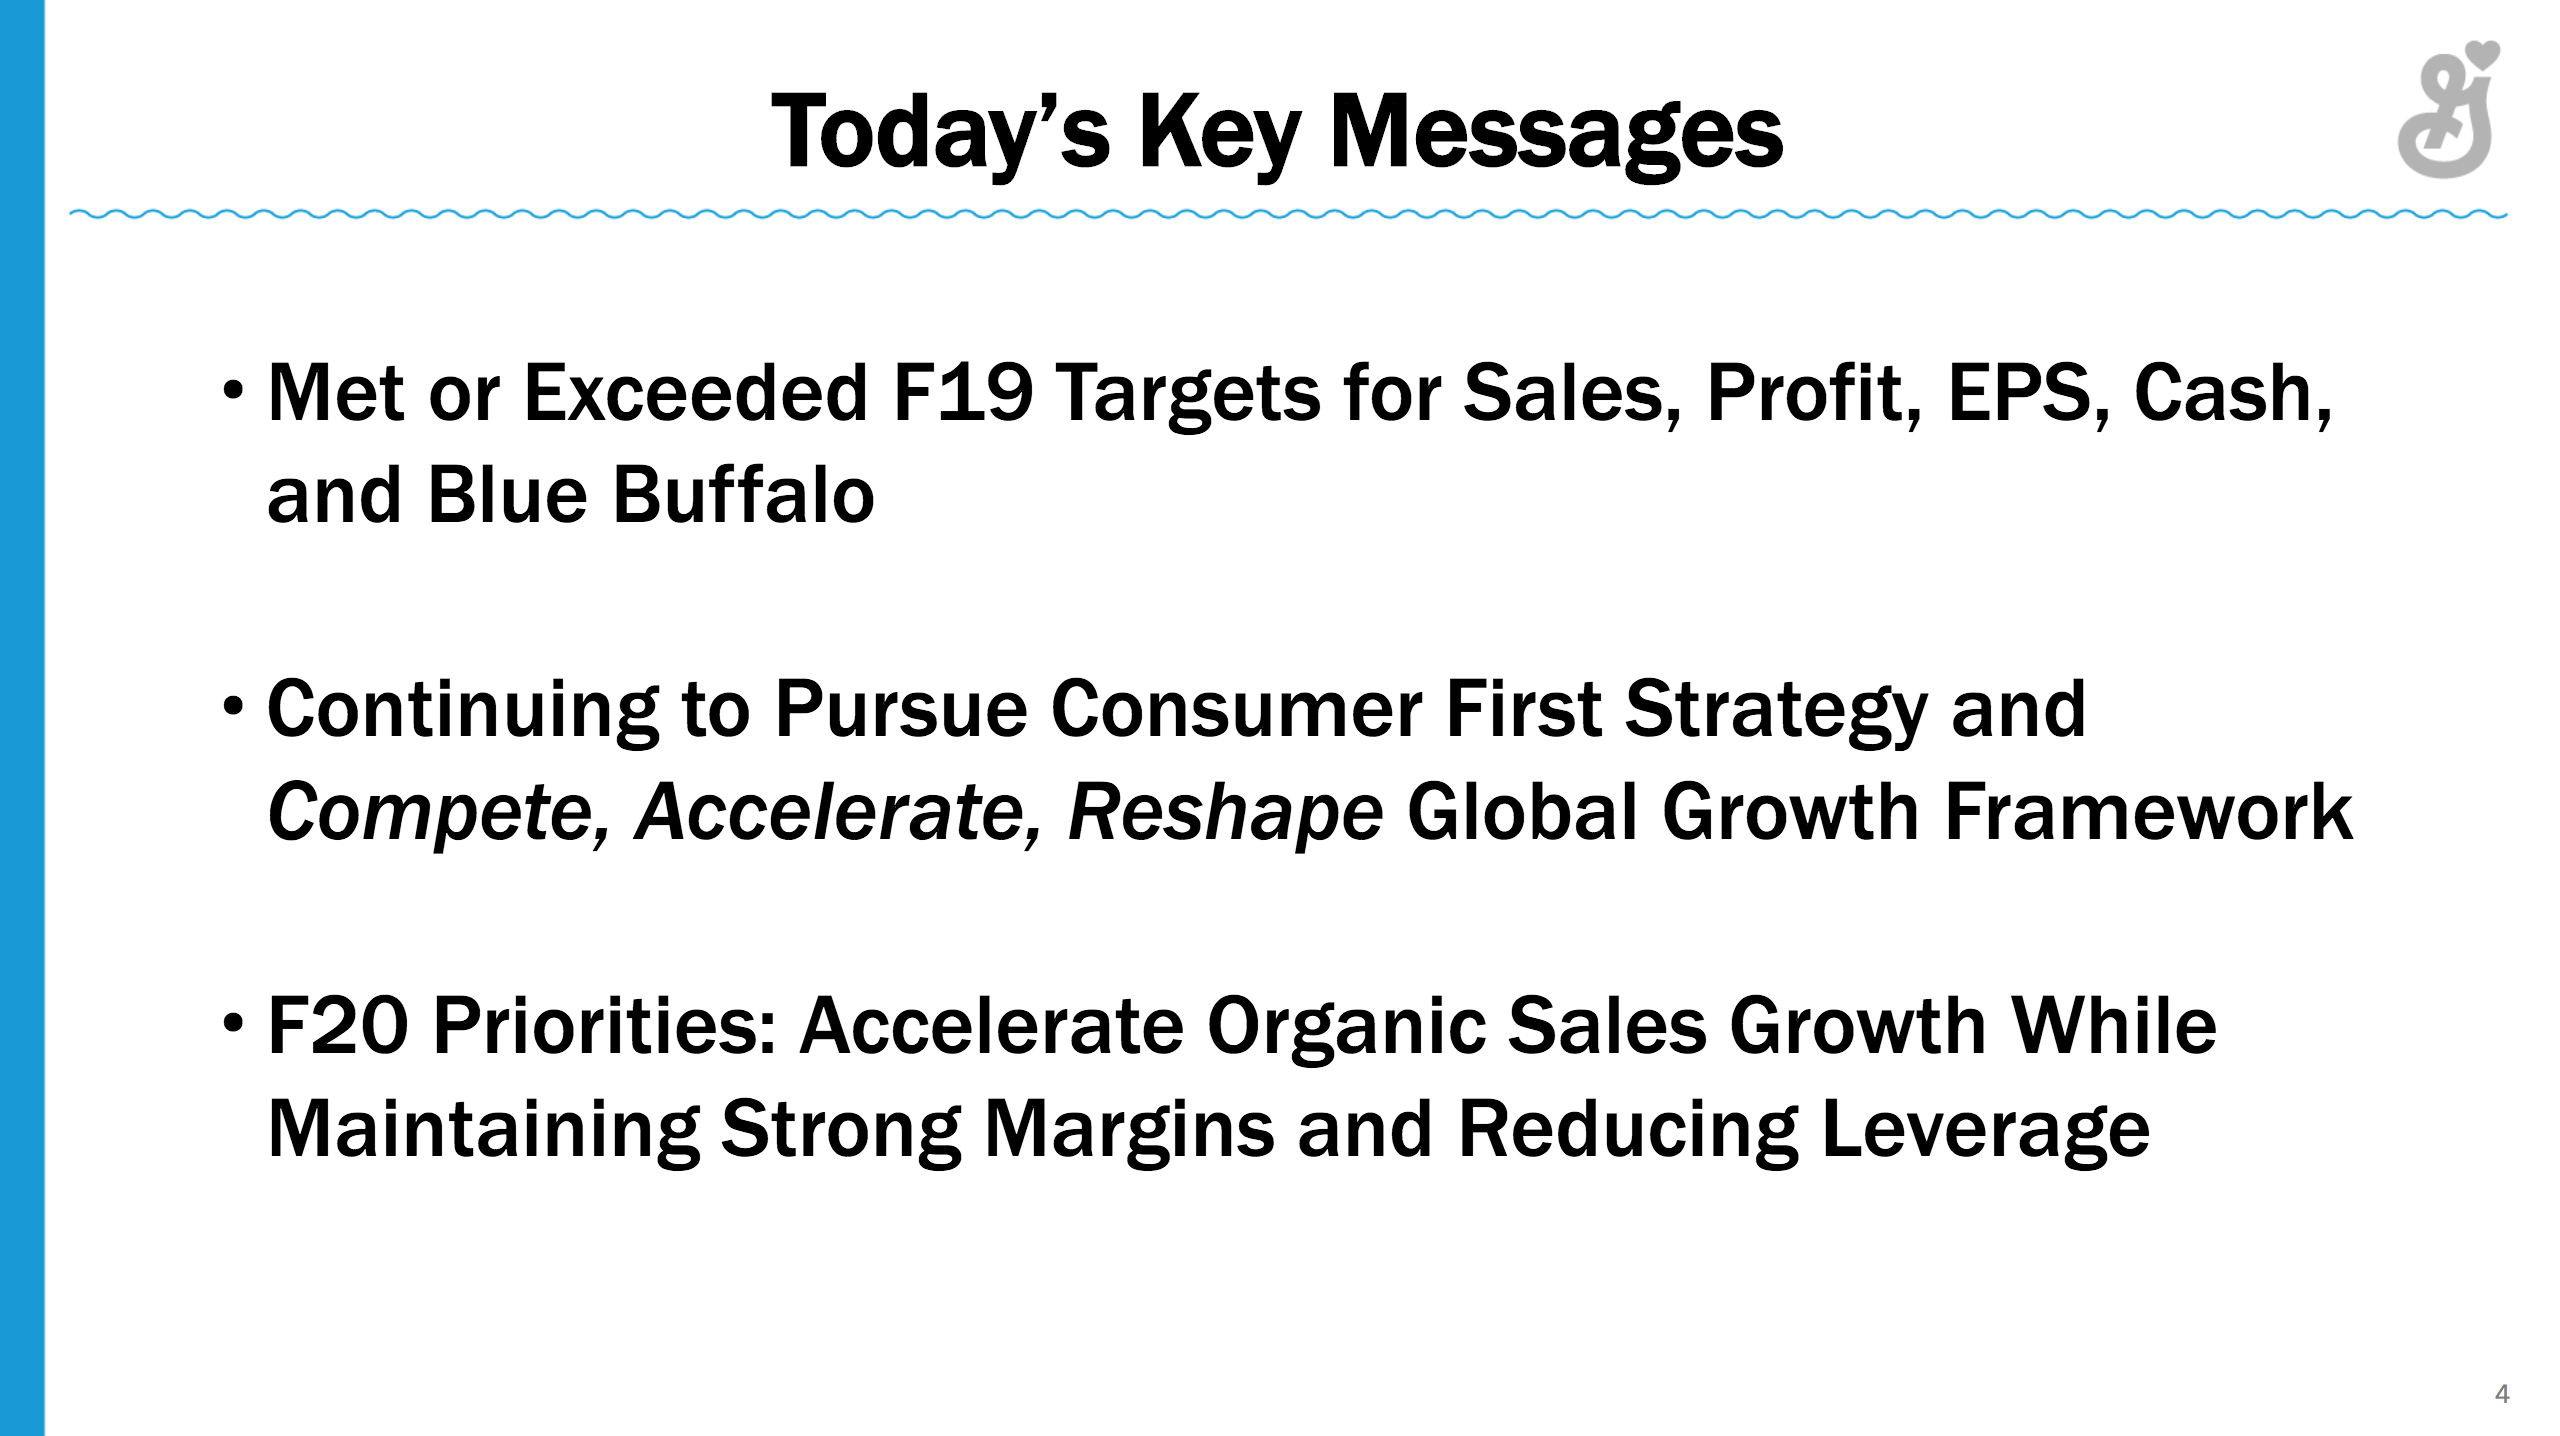
The CEO Jeff Harmening had the following comments in the press release and during the earnings call:
“I’m pleased to say thatwe executed well, successfully transitioned Blue Buffalo into our portfolio, and delivered our financial commitmentsin fiscal 2019.”
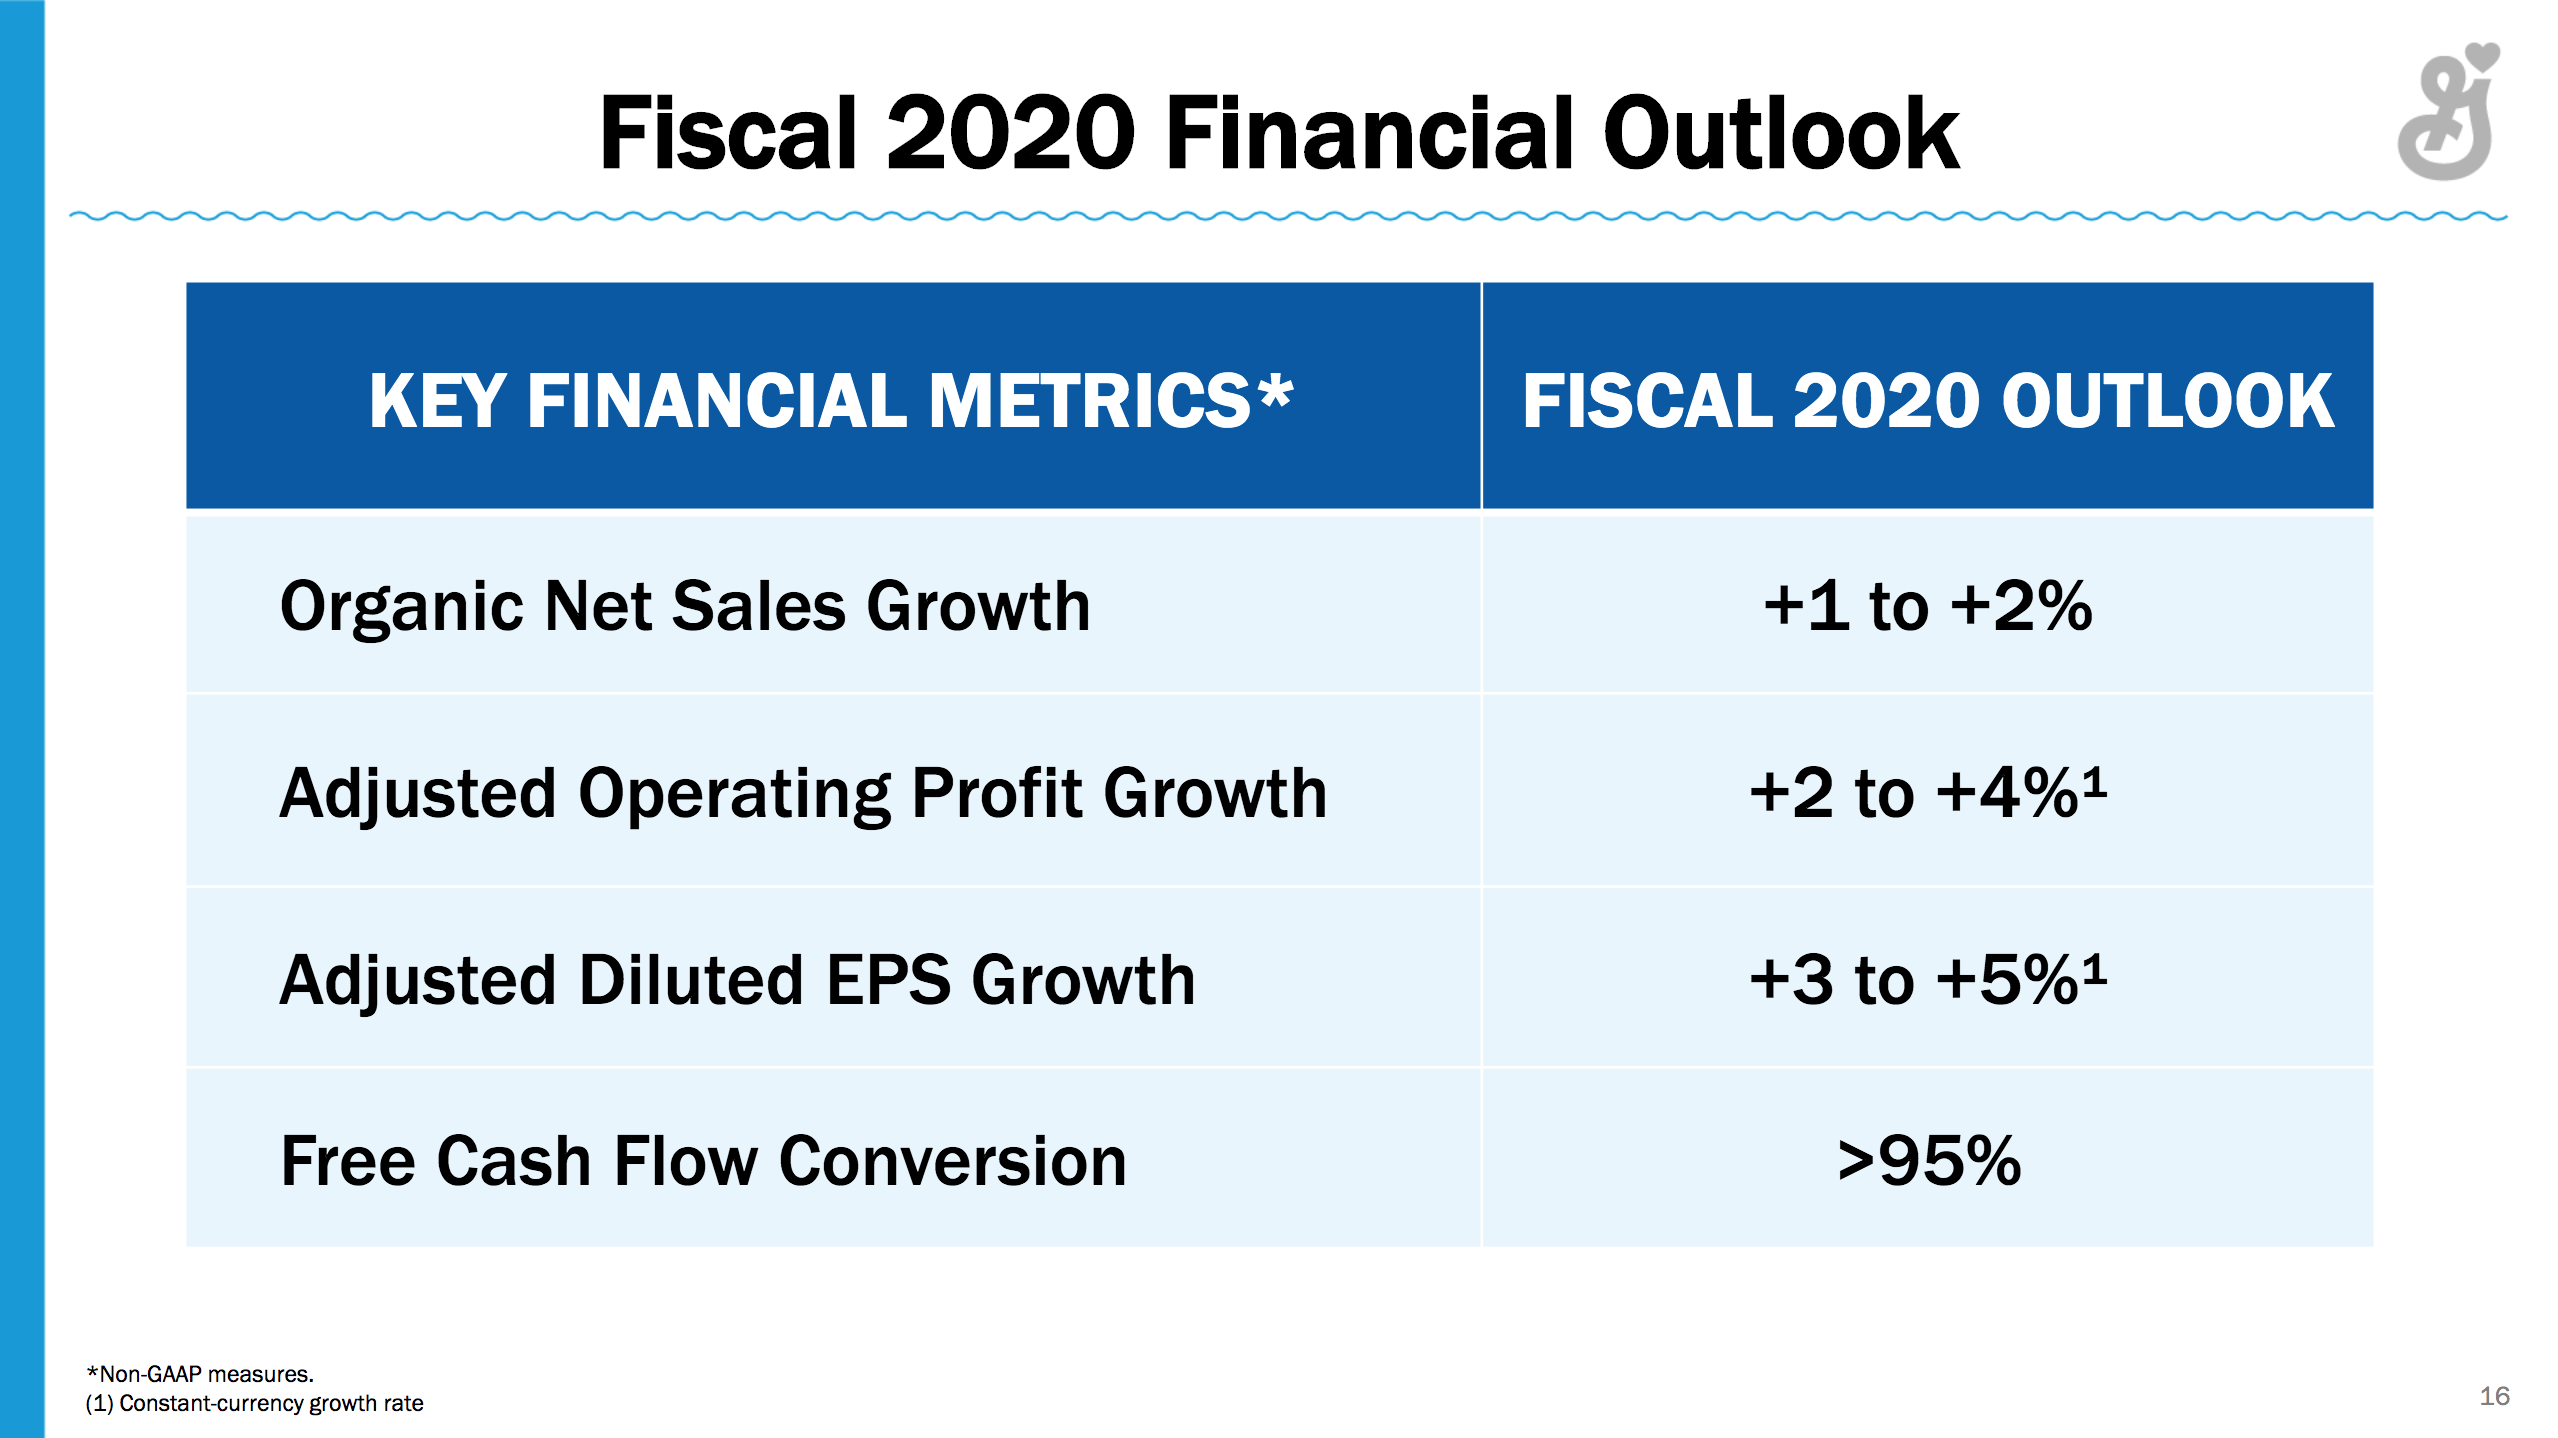
“We’ll look to improve our performance again in fiscal 2020, and we have plans in place to accelerate our organic sales growth while maintaining our strong marginsand cash discipline.”
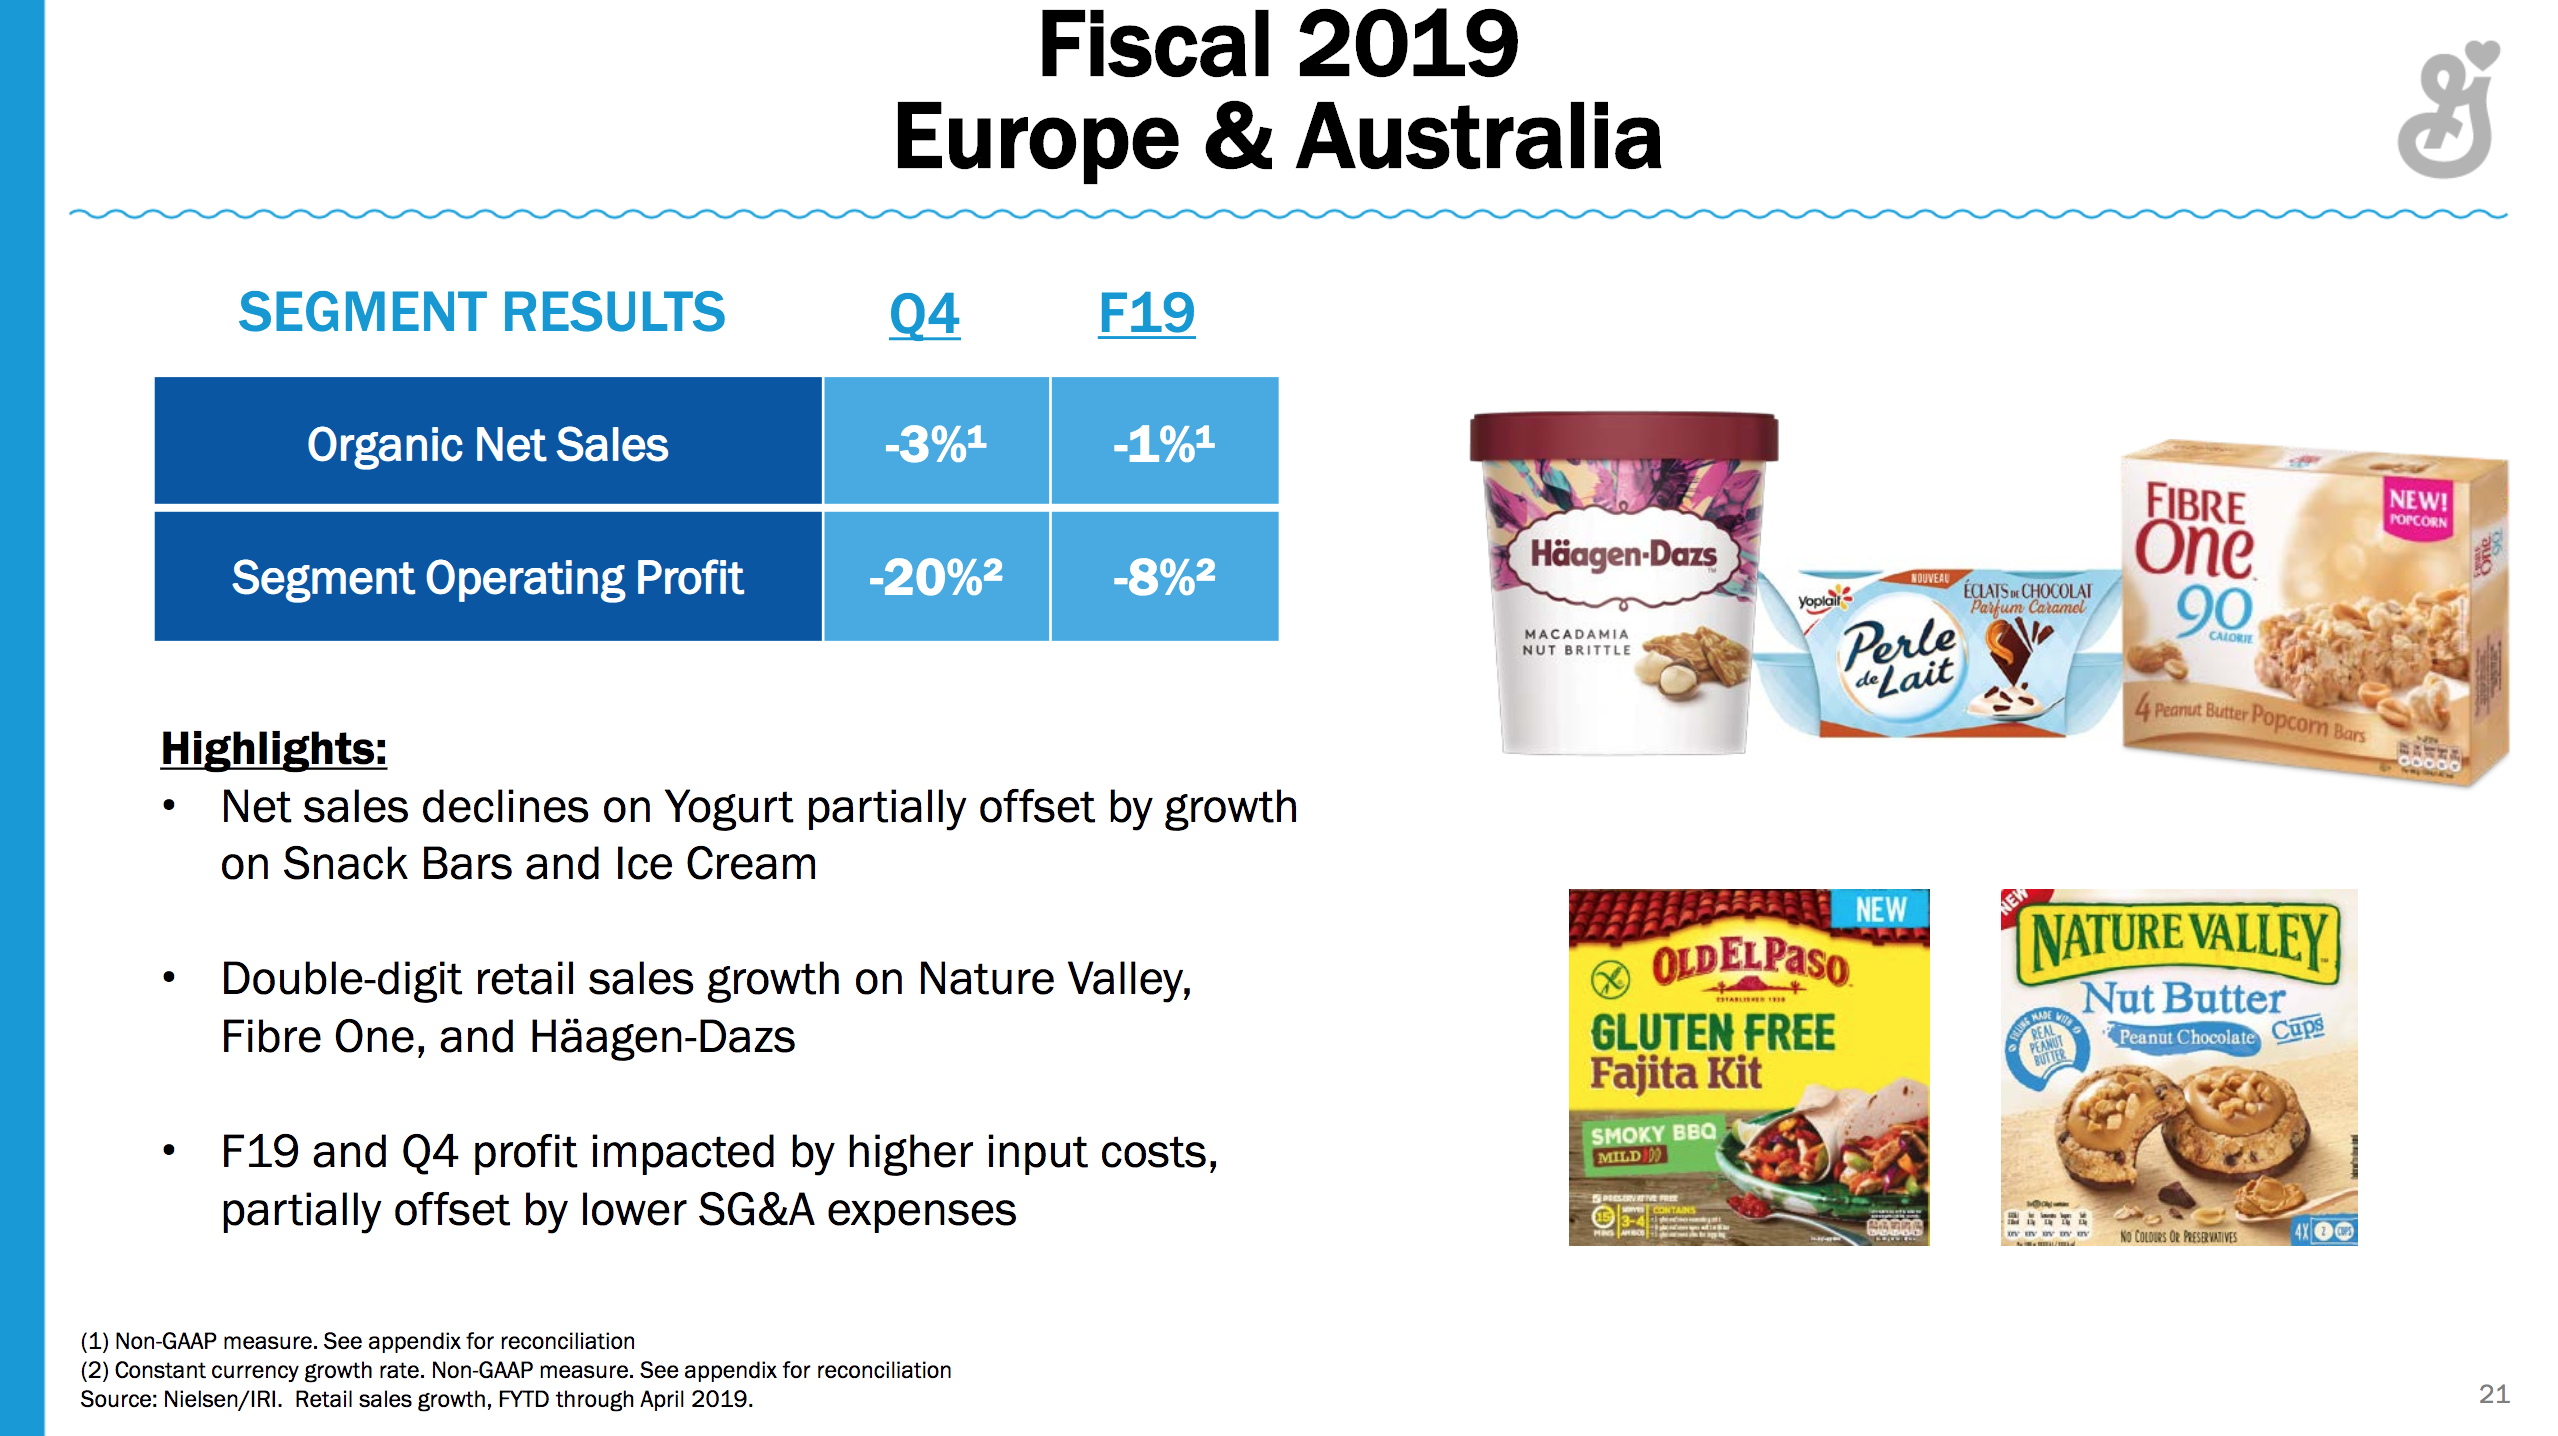
“We are very focused and frankly not satisfied with the performance on both Nature Valley and Fiber One, and that’s really what we need to turn around in the coming year.”
Reuters: General Mills sales hit by low demand for Nature Valley, Fiber One bars
Bloomberg: General Mills Slumps as Sales Fall Short of Market Expectations
The jewelry company Pandora has issued a press release regarding their quarterly results with the comments below from the new CEO and the CFO.
Alexander Lacik, CEO:
“I’m very excited to join Pandora. We have some very strong fundamentals in terms of a world-class supply chain, a strong product proposition as well as a deep reaching distribution network that gives consumers all around the globe quality access to Pandora. The brand as well as the company has reached a point of maturity and it is not without some serious challenges. The recently announced transformation programme NOW, which I fully support, is a great transition into the future.“
Anders Boyer, CFO:
“Programme NOW is progressing rapidly and is creating a real transformation of our business, culture and organisation. As expected, the first quarter was characterised by continued weak like-for-like further burdened by our deliberate commercial reset. While the first quarter emphasises the need for our planned brand re-launch, it is encouraging to see that our initial commercial pilots and marketing tests to Reignite a Passion for Pandora show good results.”
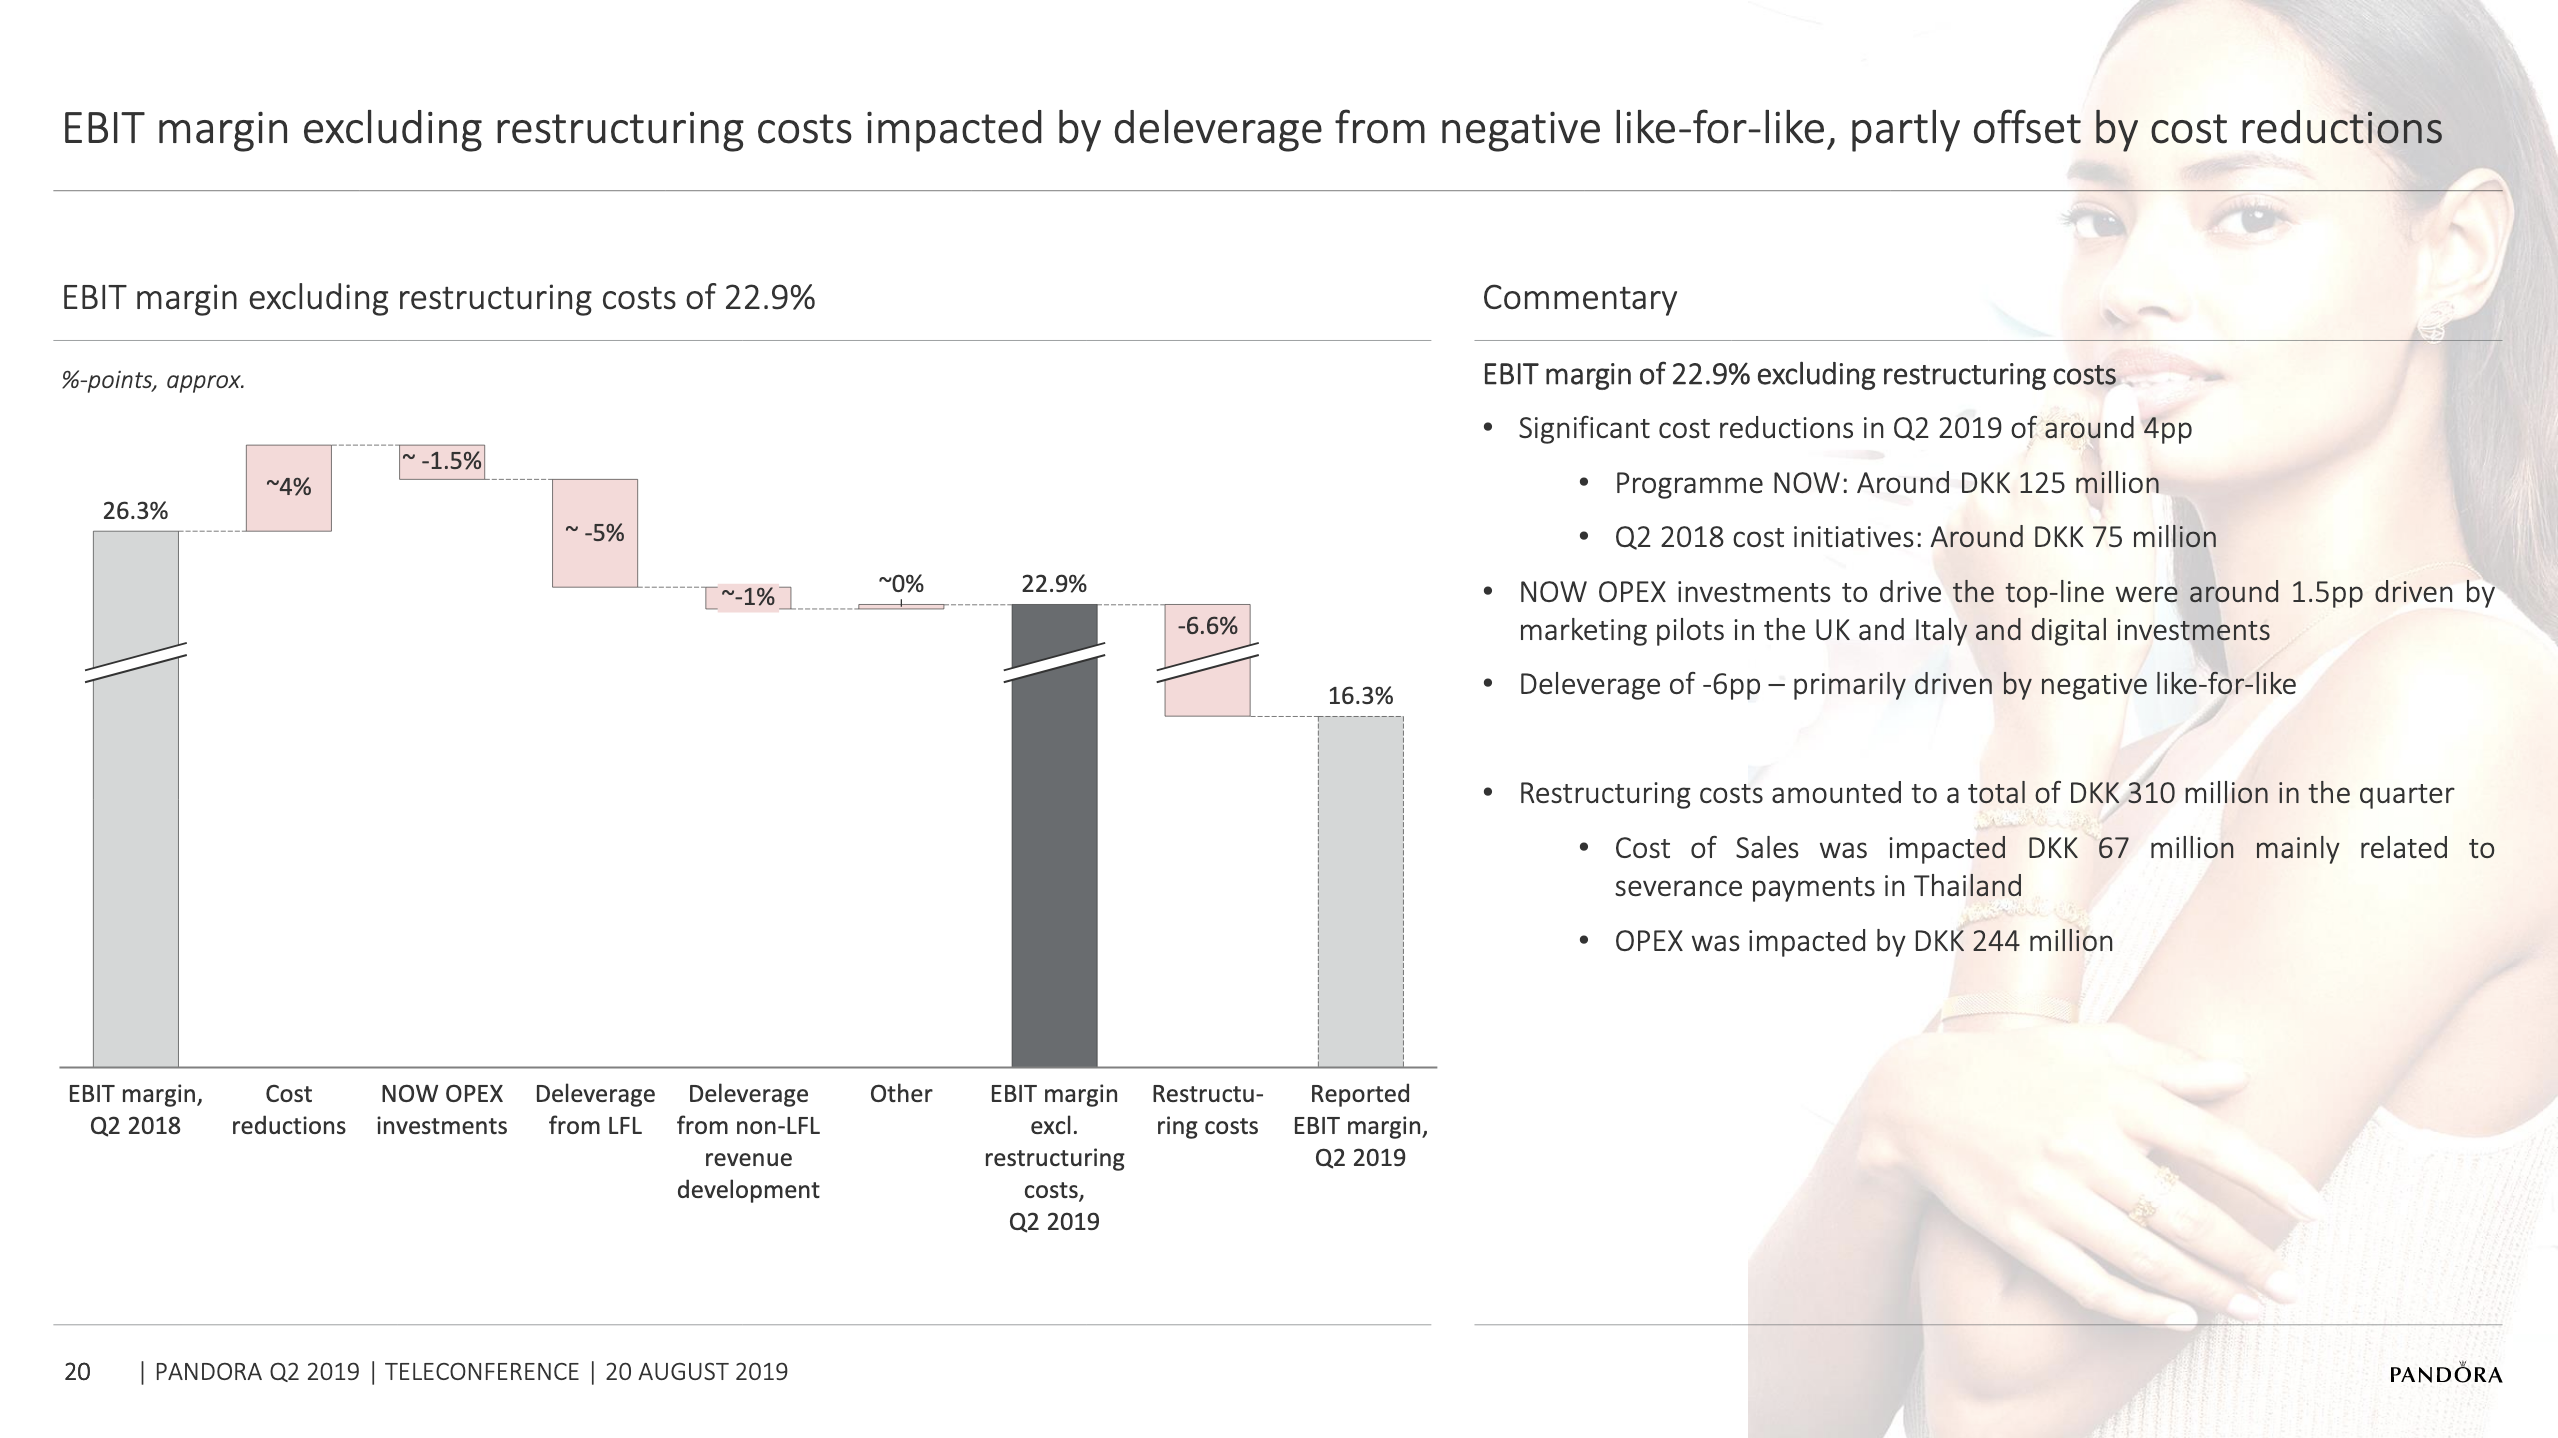
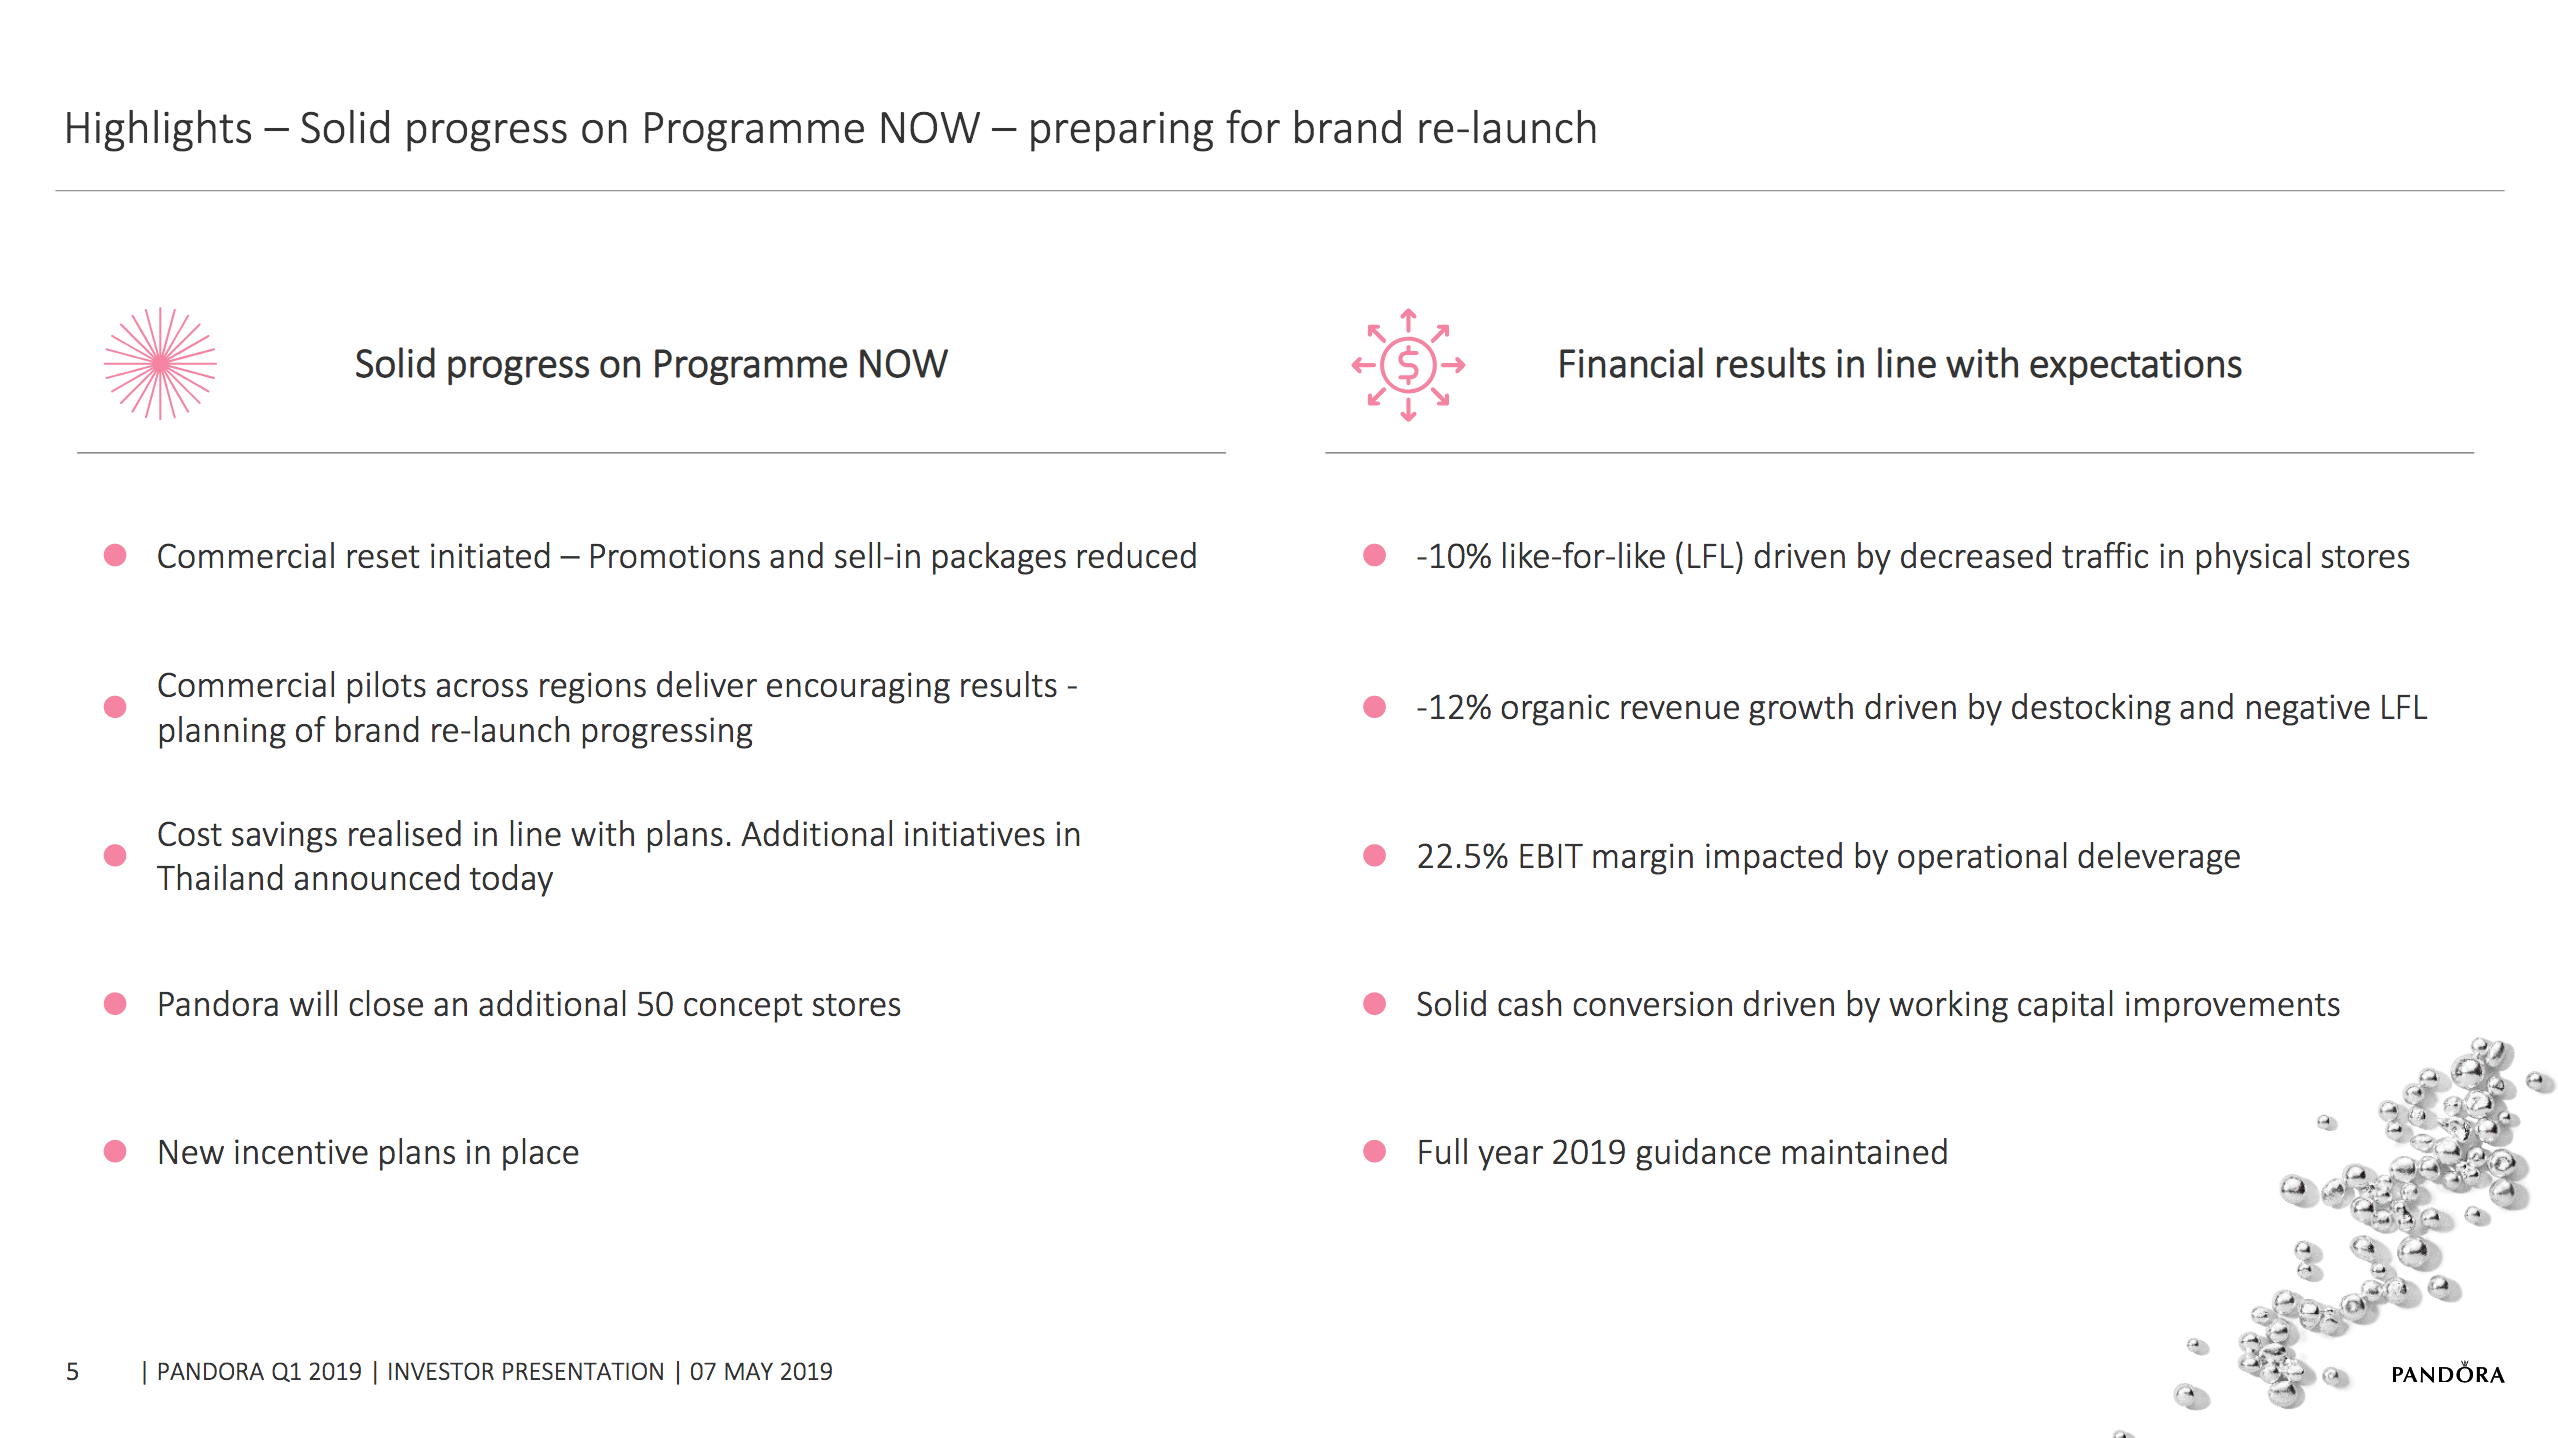
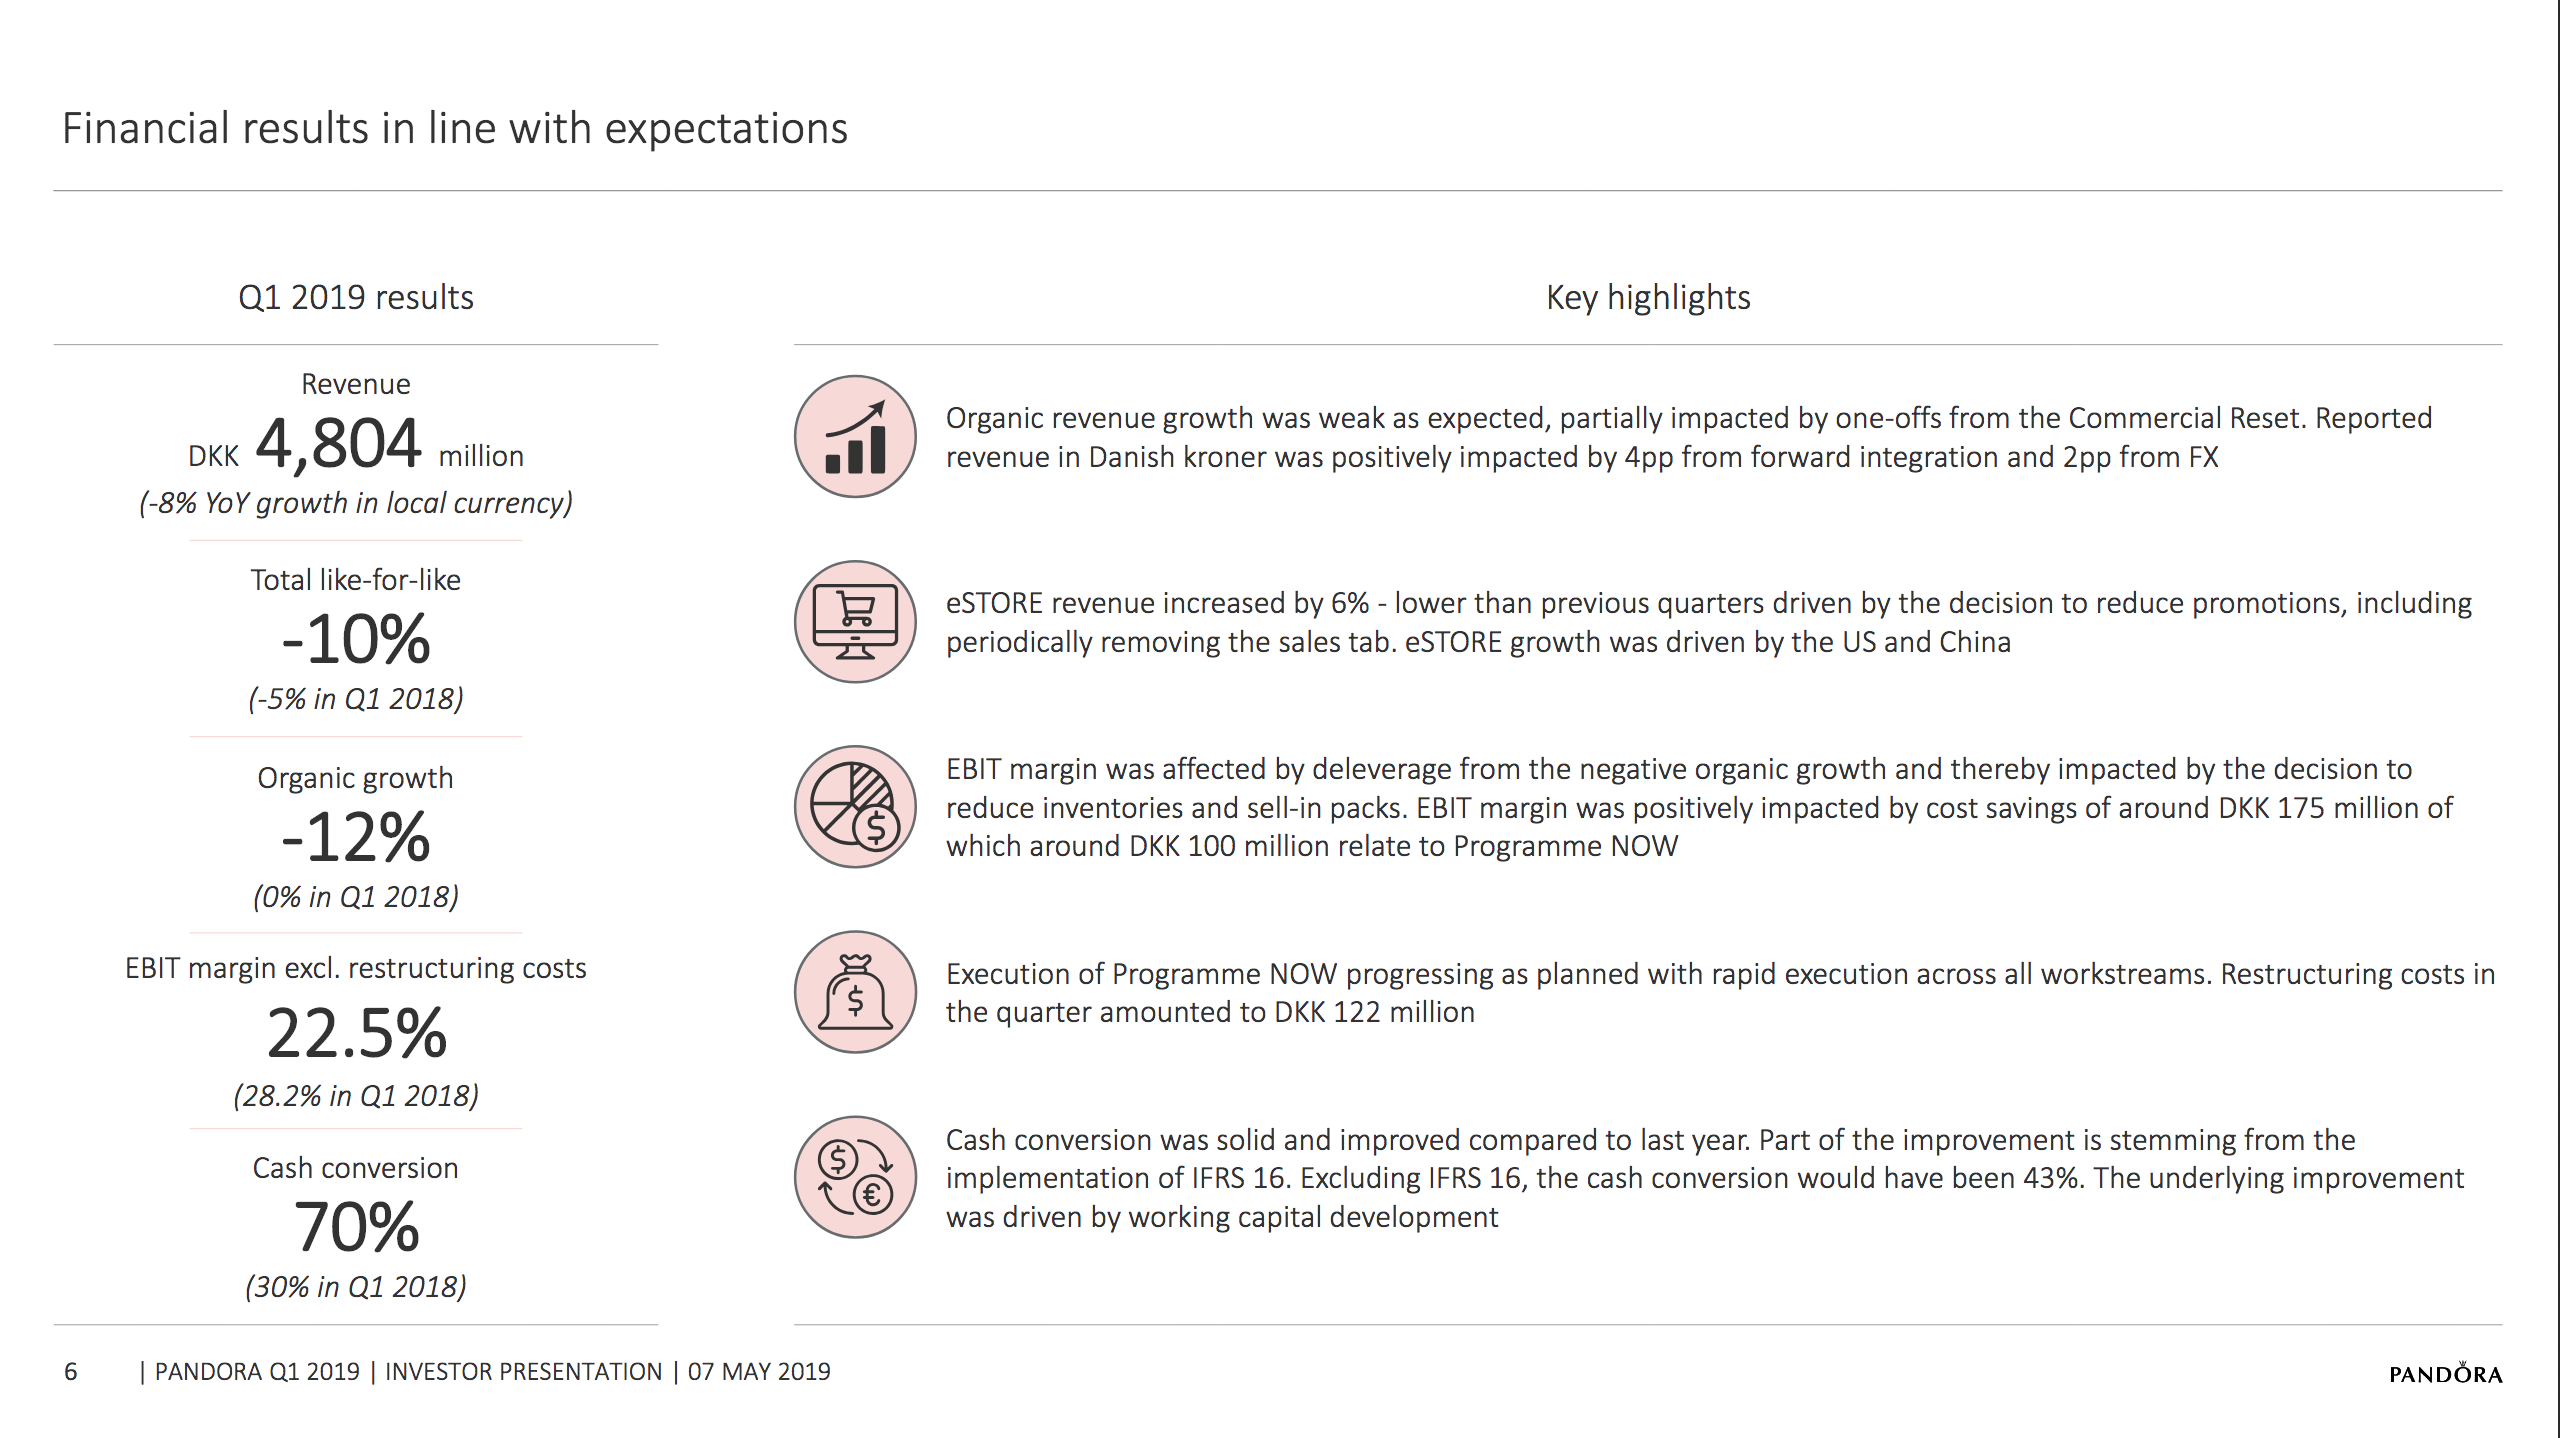
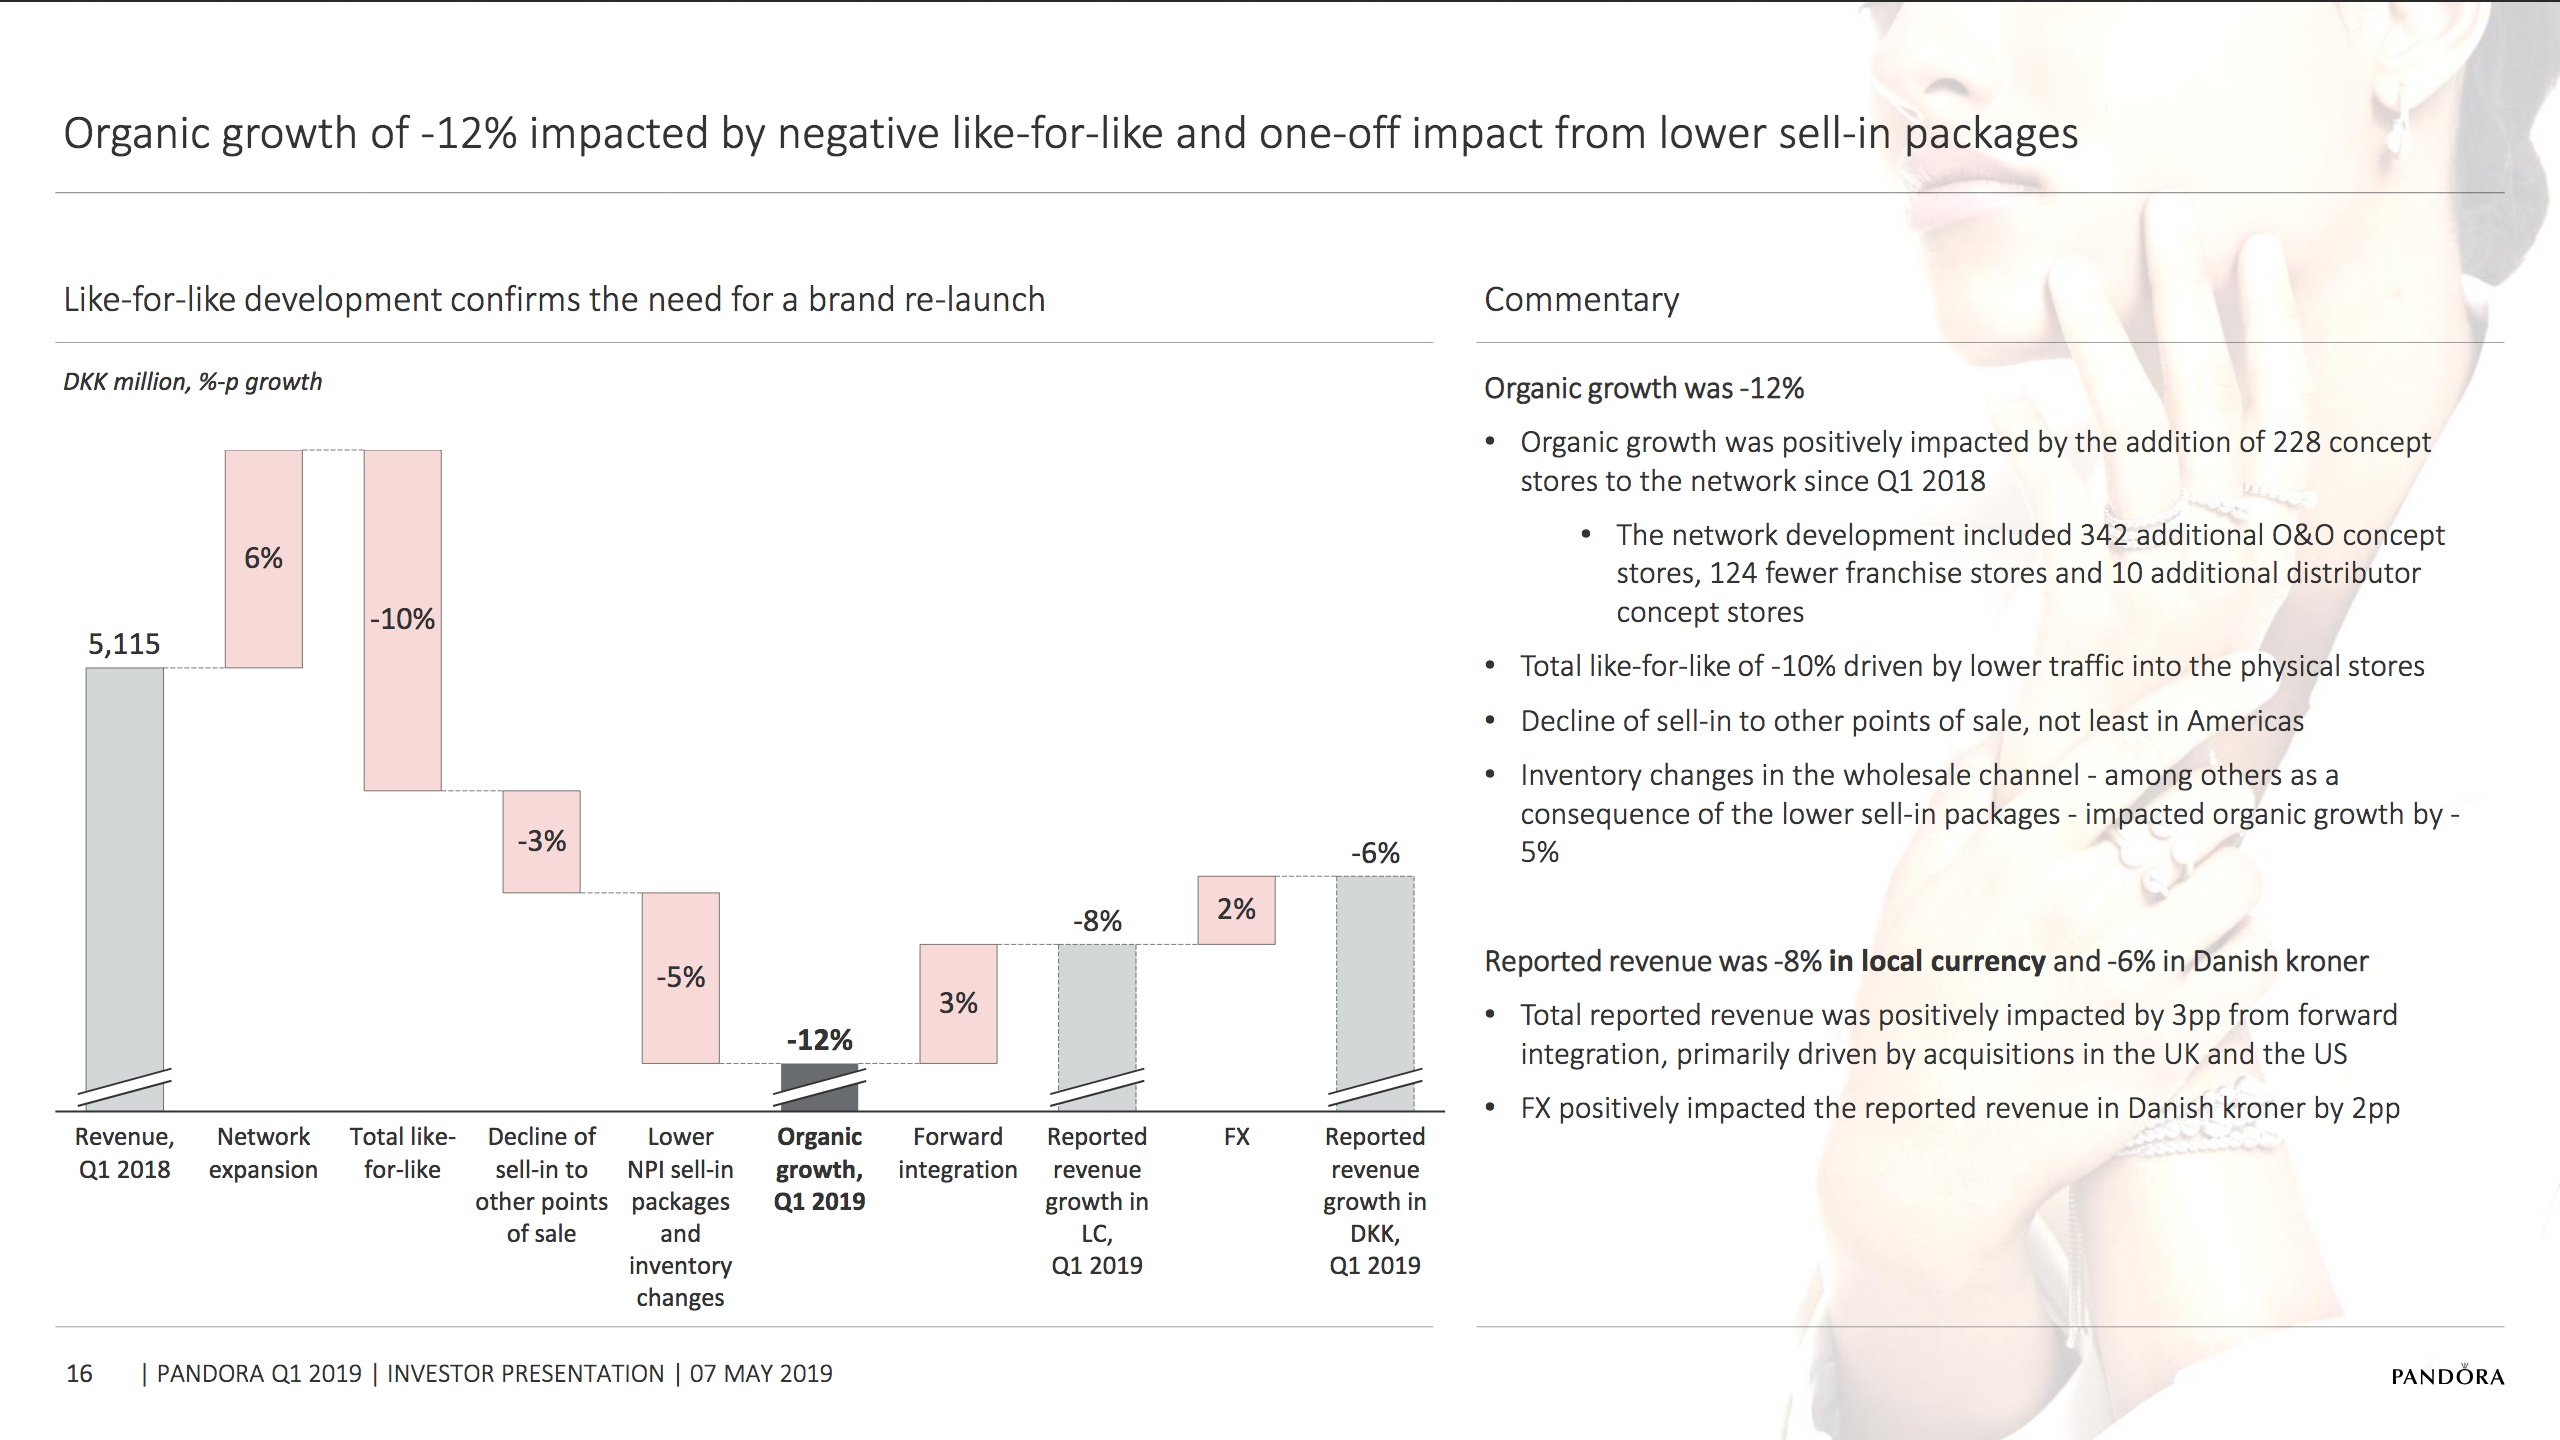
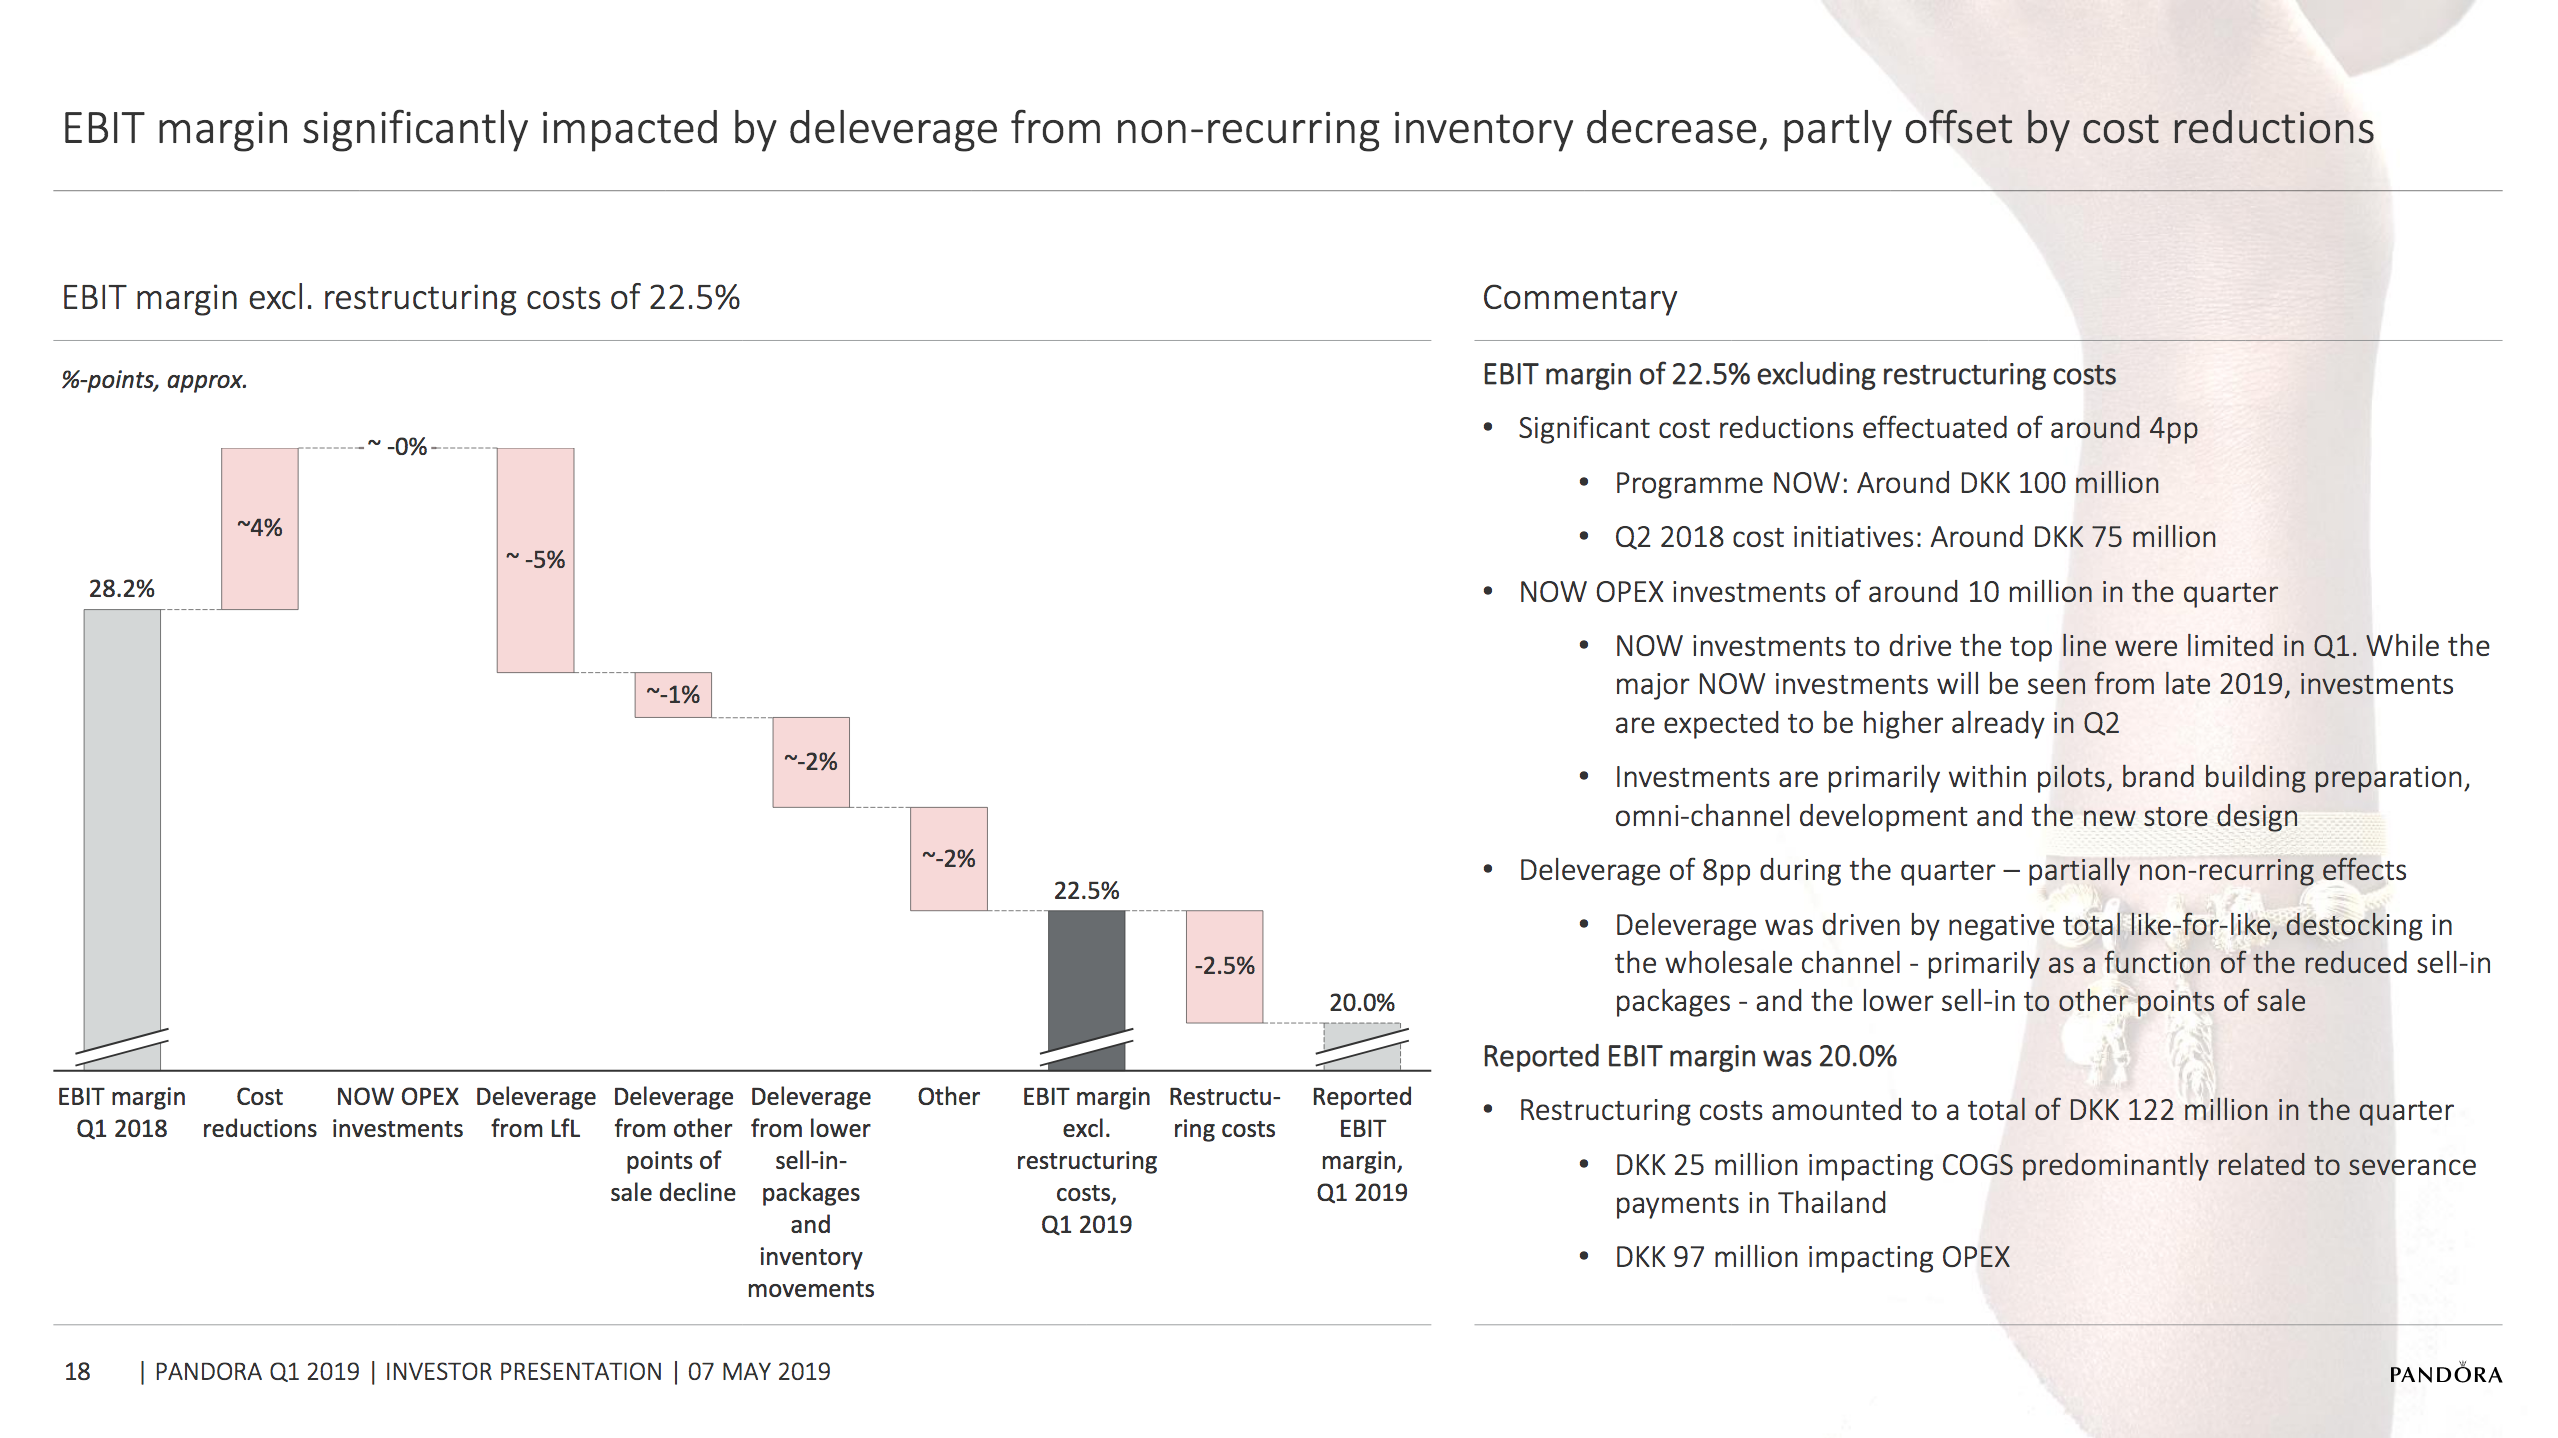
Below are two slides from the earnings call with the highlights of the quarter and two slides with waterfall charts visualising the organic growth and the EBIT margin for the quarter.
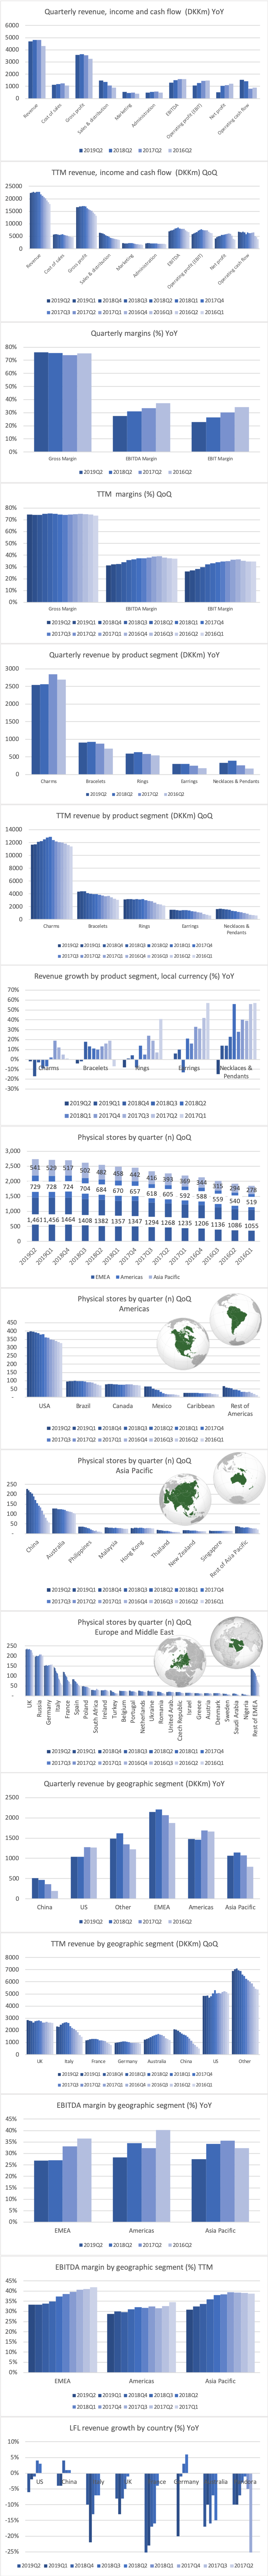
Various financial metrics are summarised below. Revenue is shrinking (-6%), gross profit is decreasing (-6%) despite COGS being reduced (-6%) and operating profit is down (-25% excluding restructuring costs) in part due to SG&A being up (+5%); administrative expenses are down (-8%), but sales and distribution is up (+13%). The gross margin is relatively unchanged at 75.9%, but the EBITDA margin is down from 32.6% to 30.7% and the EBIT margin is down from 28.2% to 22.5% (excluding restructuring costs).
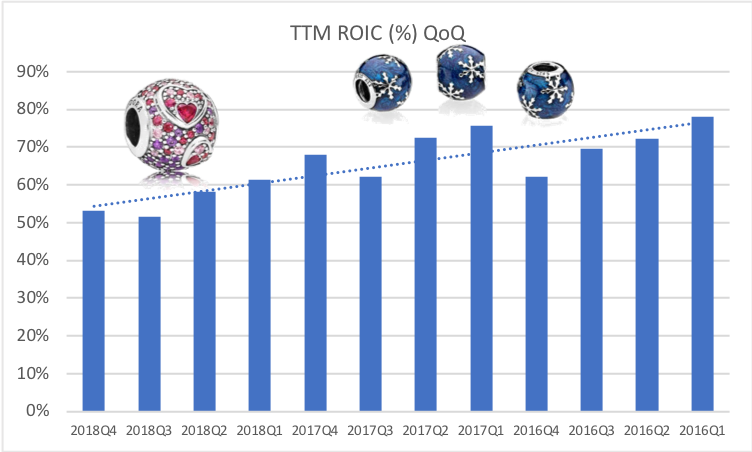
ROIC hit another all time low of 47.6%. Because of a switch from the IAS17 to the IFRS16 accounting standard it was further reduced to 35.2%.
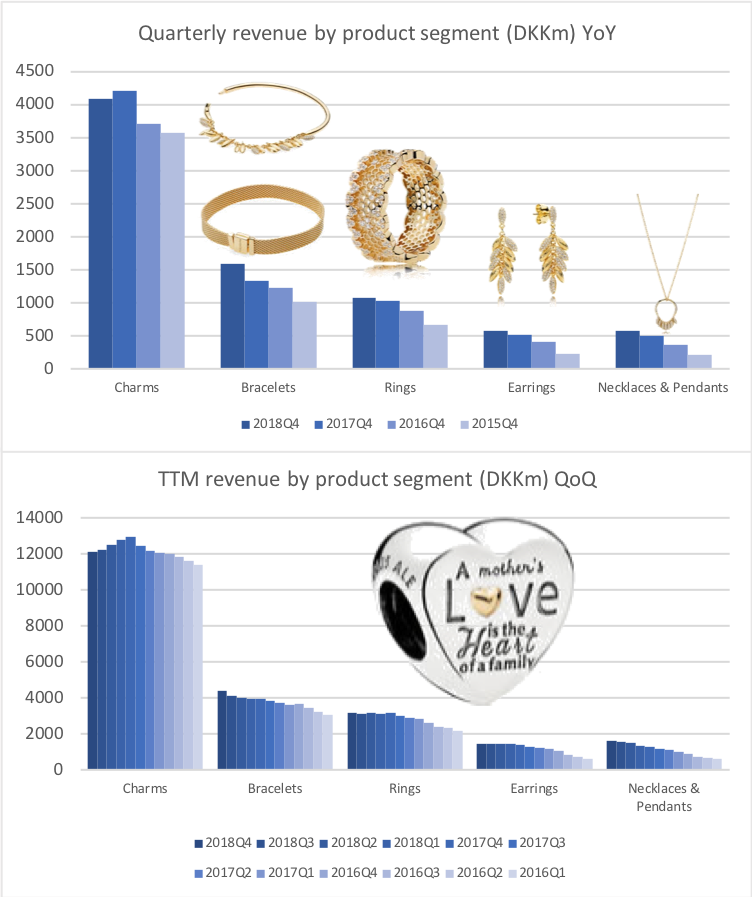
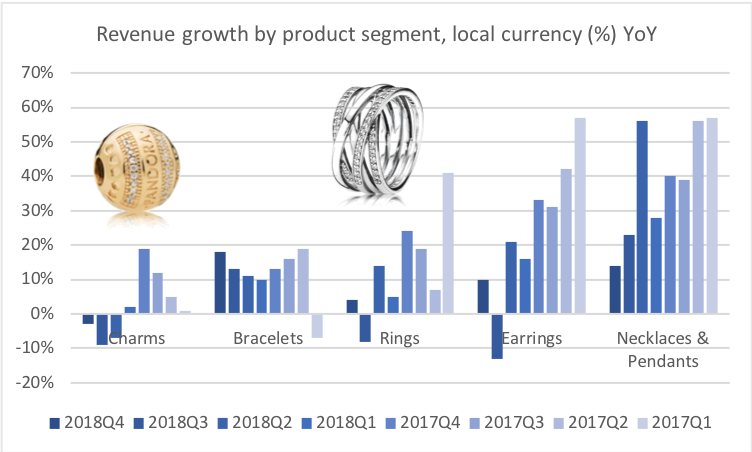
Product segments
Revenue from charms was down from DKK2,854m to DKK2,434m (17.3% YoY). Charms will quite possibly make up less than half of the total revenue at the end of 2019. This diversification of product categories is not necessarily a bad thing, as it can be seen as a natural maturation process of the brand and as a reduction of risk.
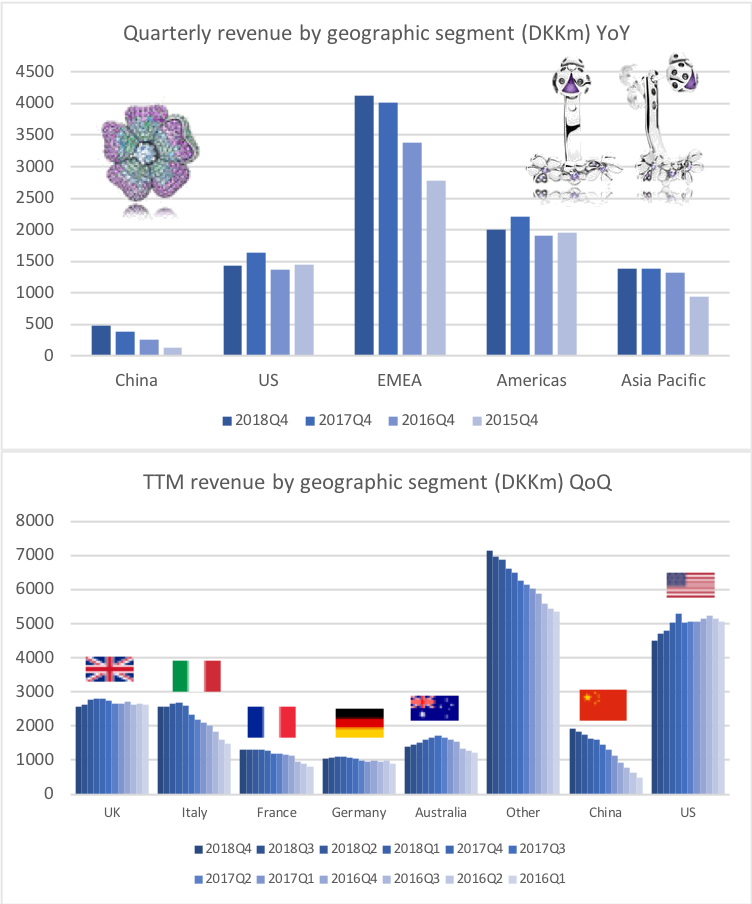
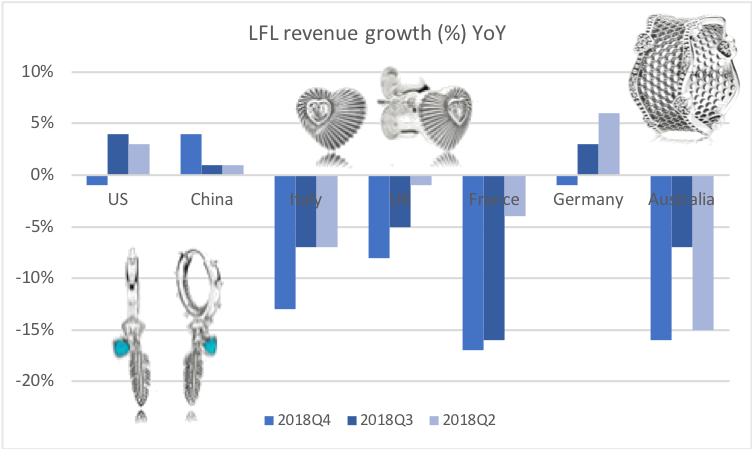
Geographic segments
China is still growing double digit in terms of store openings (+29%) and revenue (+15%), whereas other mature markets seem to be saturated. The same-store-sales growth is negative (-10%). All of the main markets are experiencing negative like-for-like growth; including China (-4%).
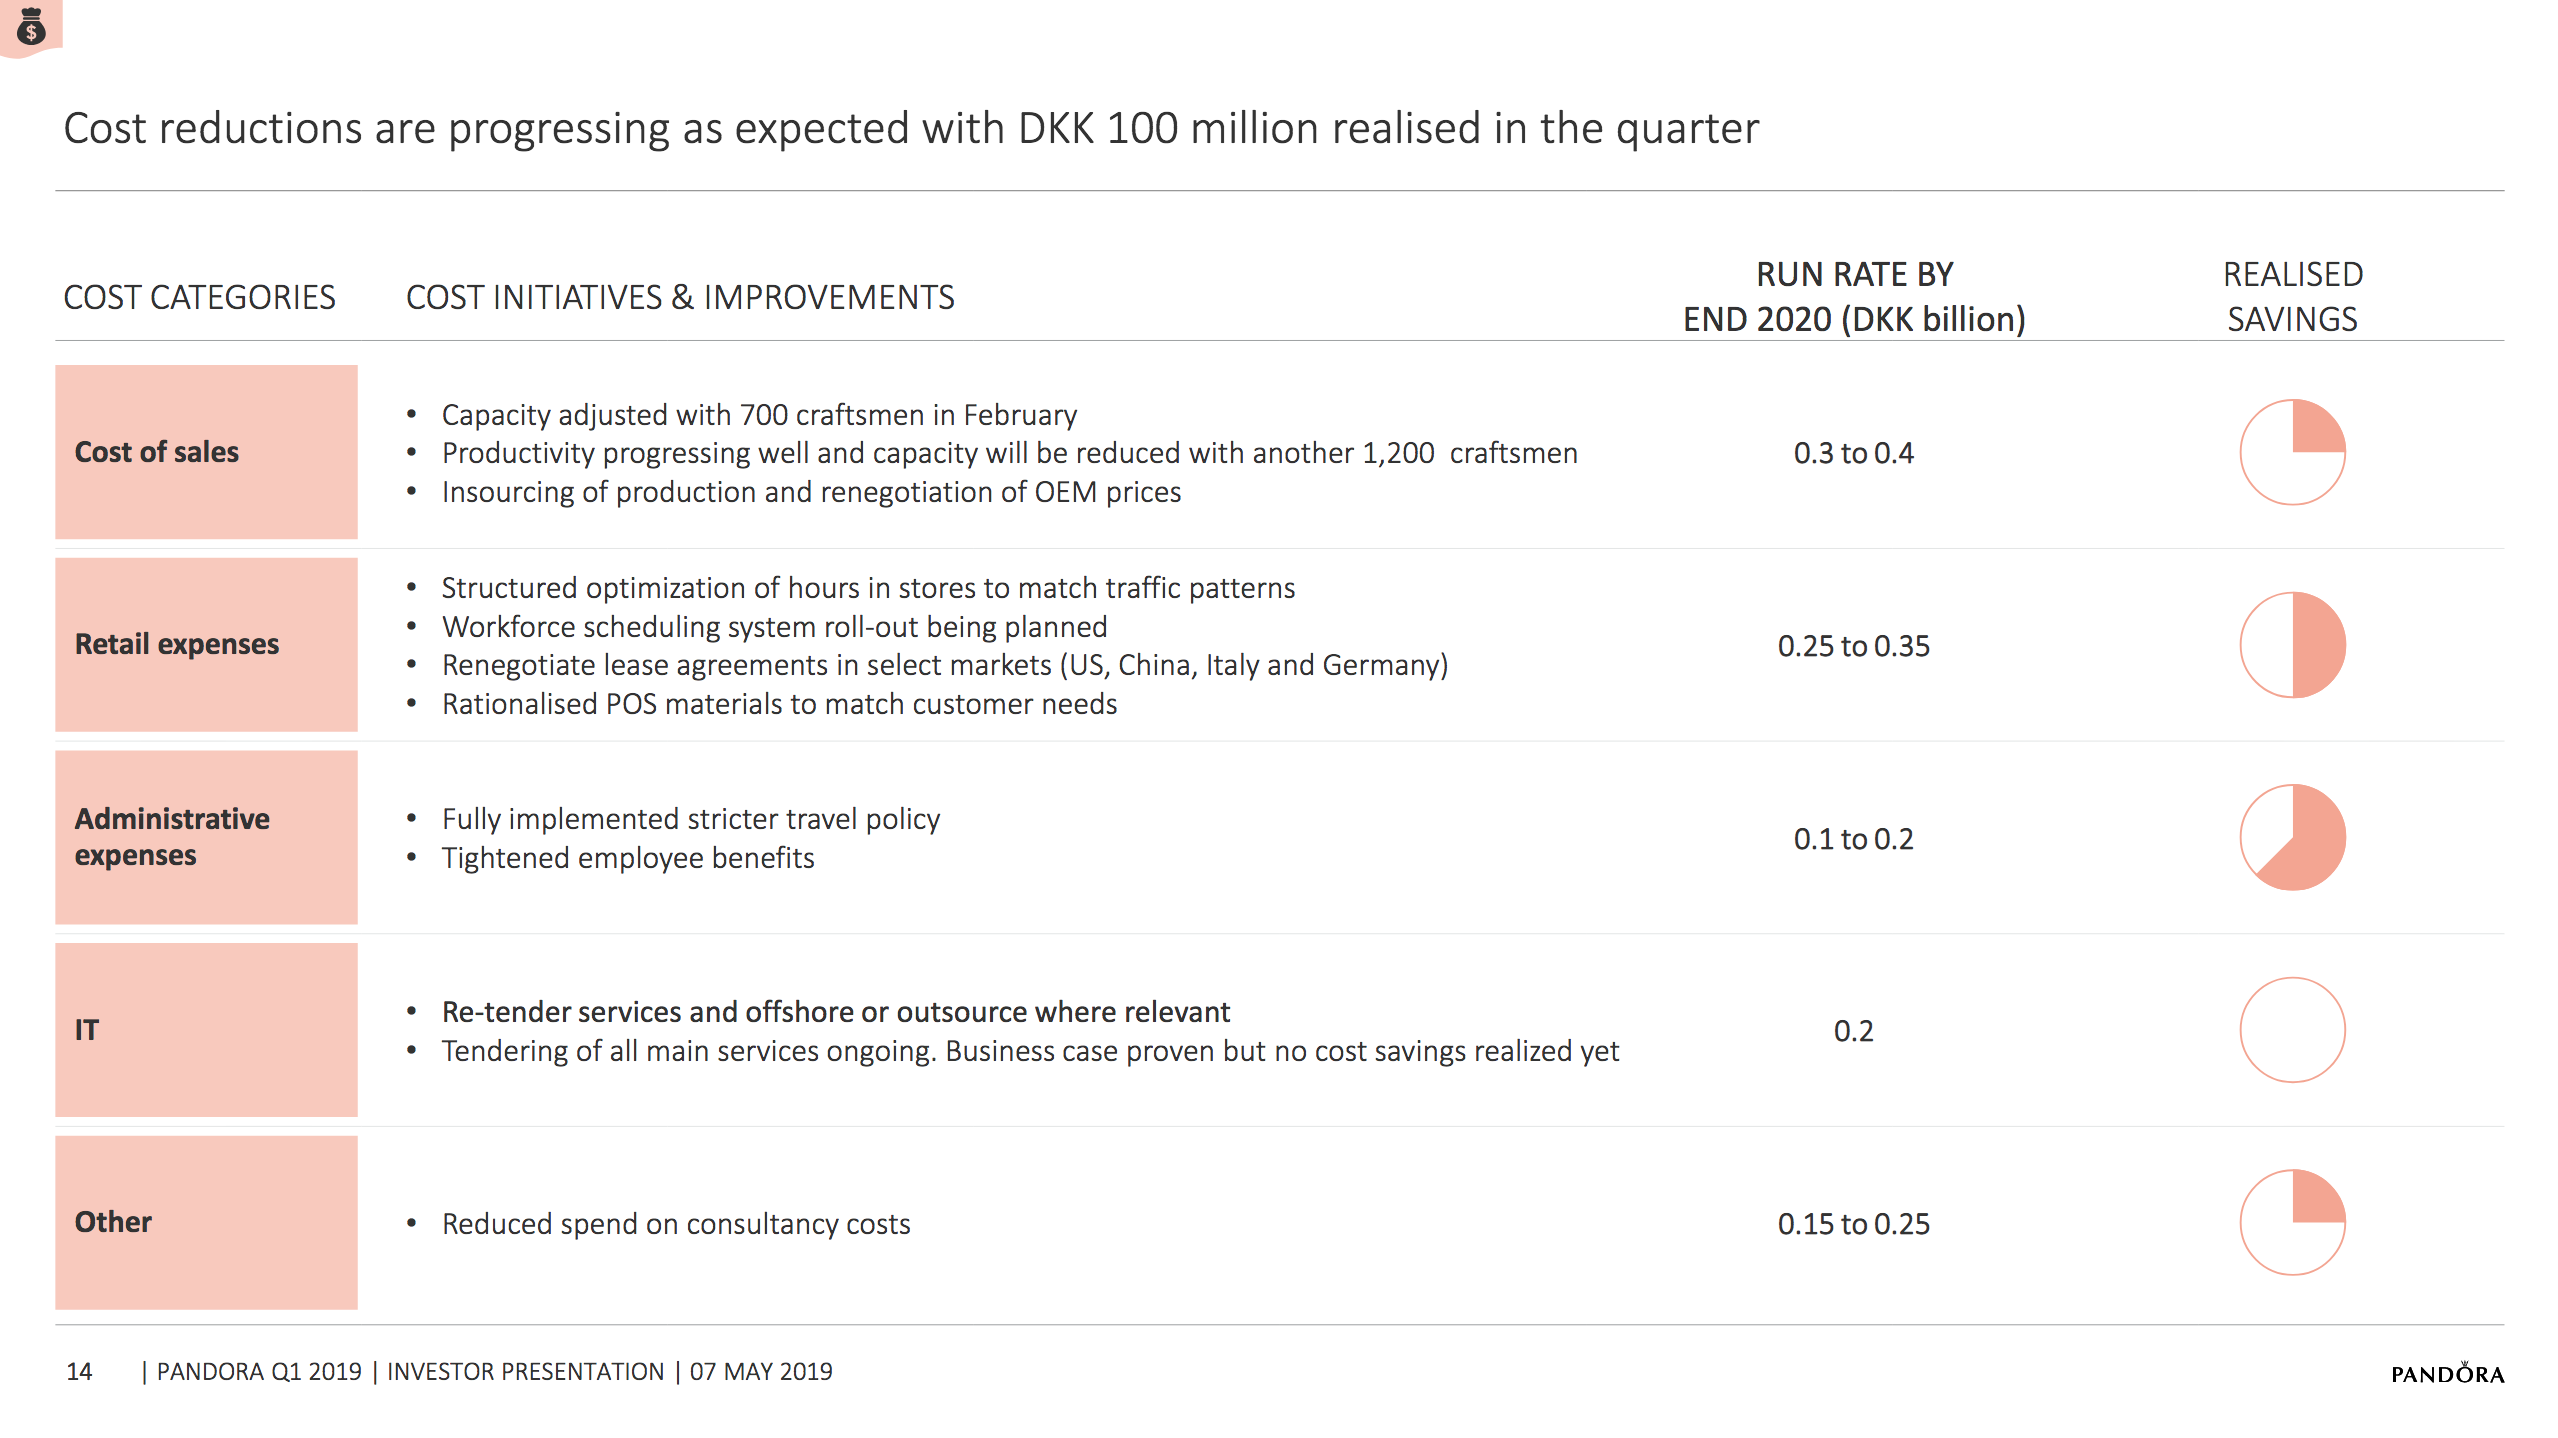
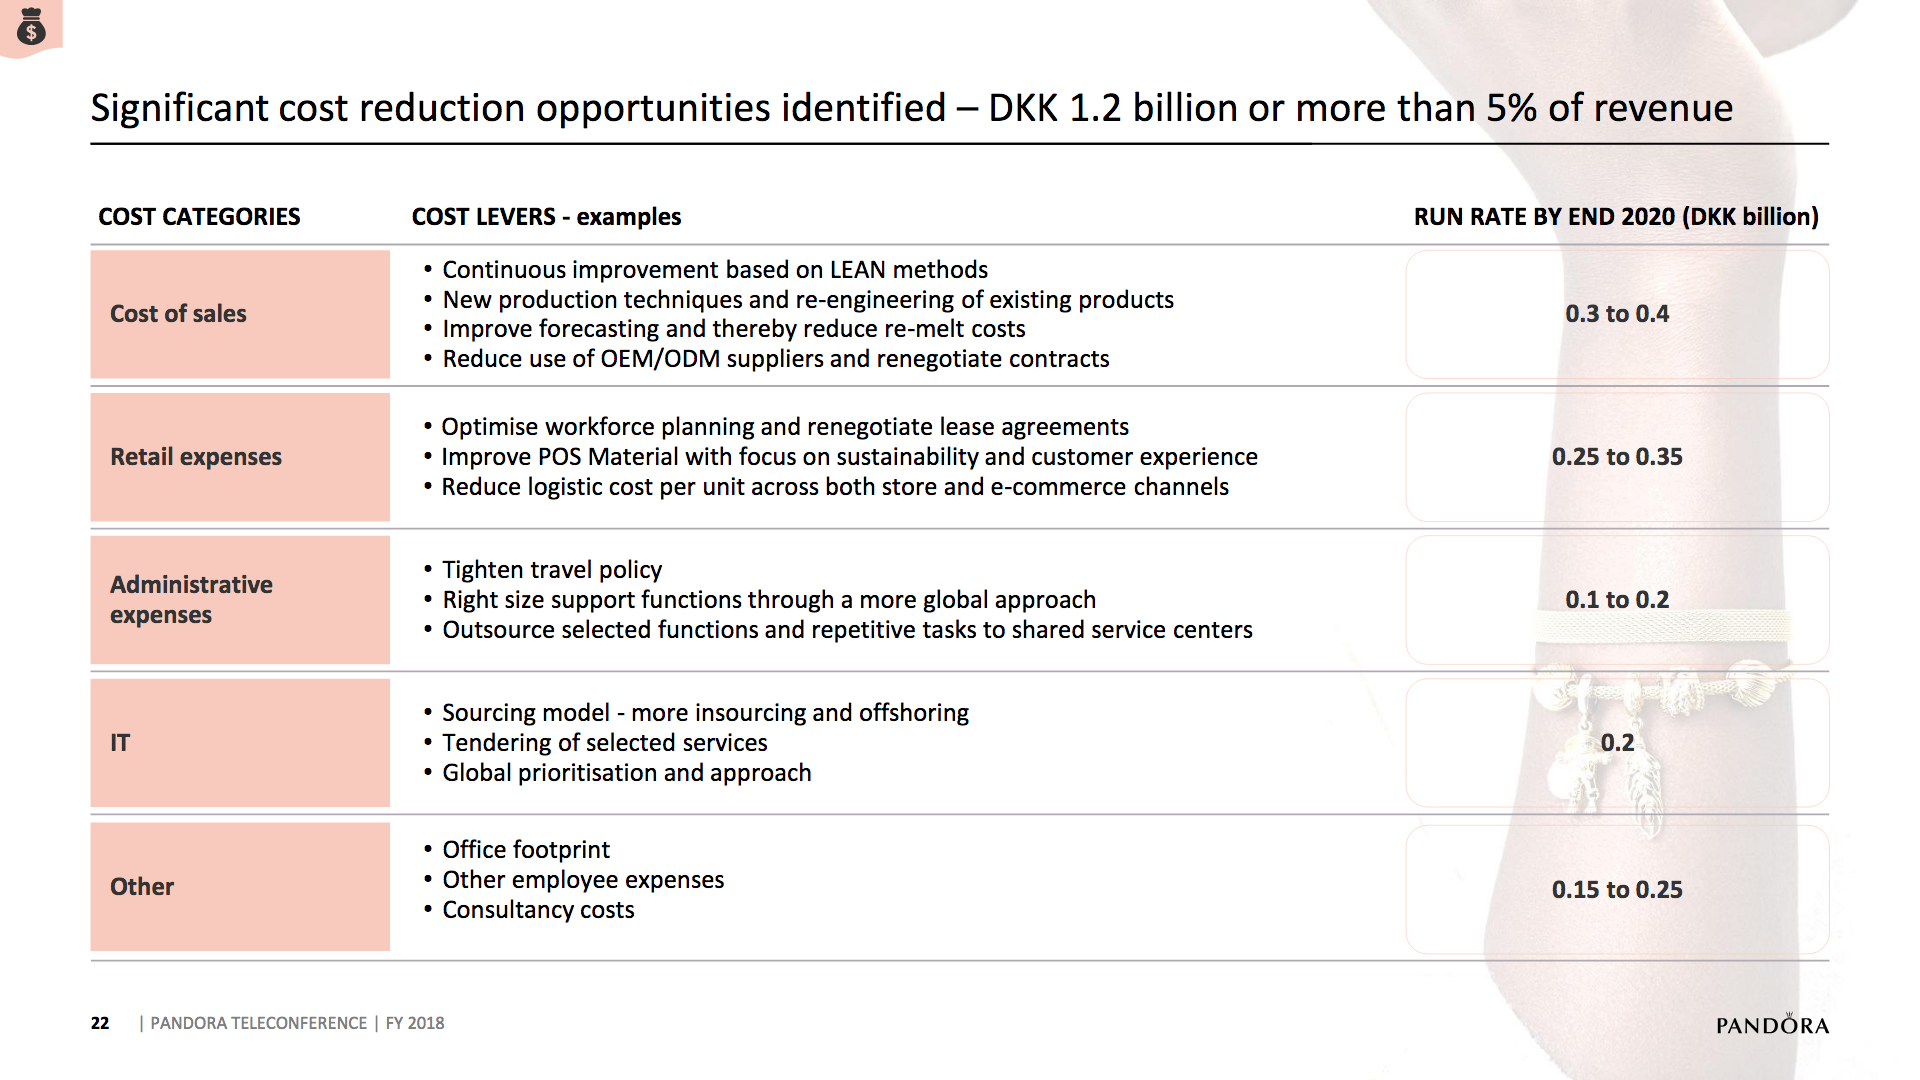
Cost reductions are progressing as expected with DKK100m realised in the quarter. The CFO had the following comment regarding the cost reduction:
As you know, the cost reduction opportunity is quite big. And we target a run rate saving DKK1.2 billion by the end of next year, by the end of 2020. And for ’19 specifically, we expect to realize cost reductions of around DKK600 million. And that comes, as you know, on top of the DKK350 million cost reductions that was announced back in August last year and in connection with the Q2 announcement.
The CFO had the following comment about the restructuring costs, which will include channel buyback
So that’s — we are keeping the DKK1.5 billion — up to DKK1.5 billion in restructuring cost unchanged for that same reason.
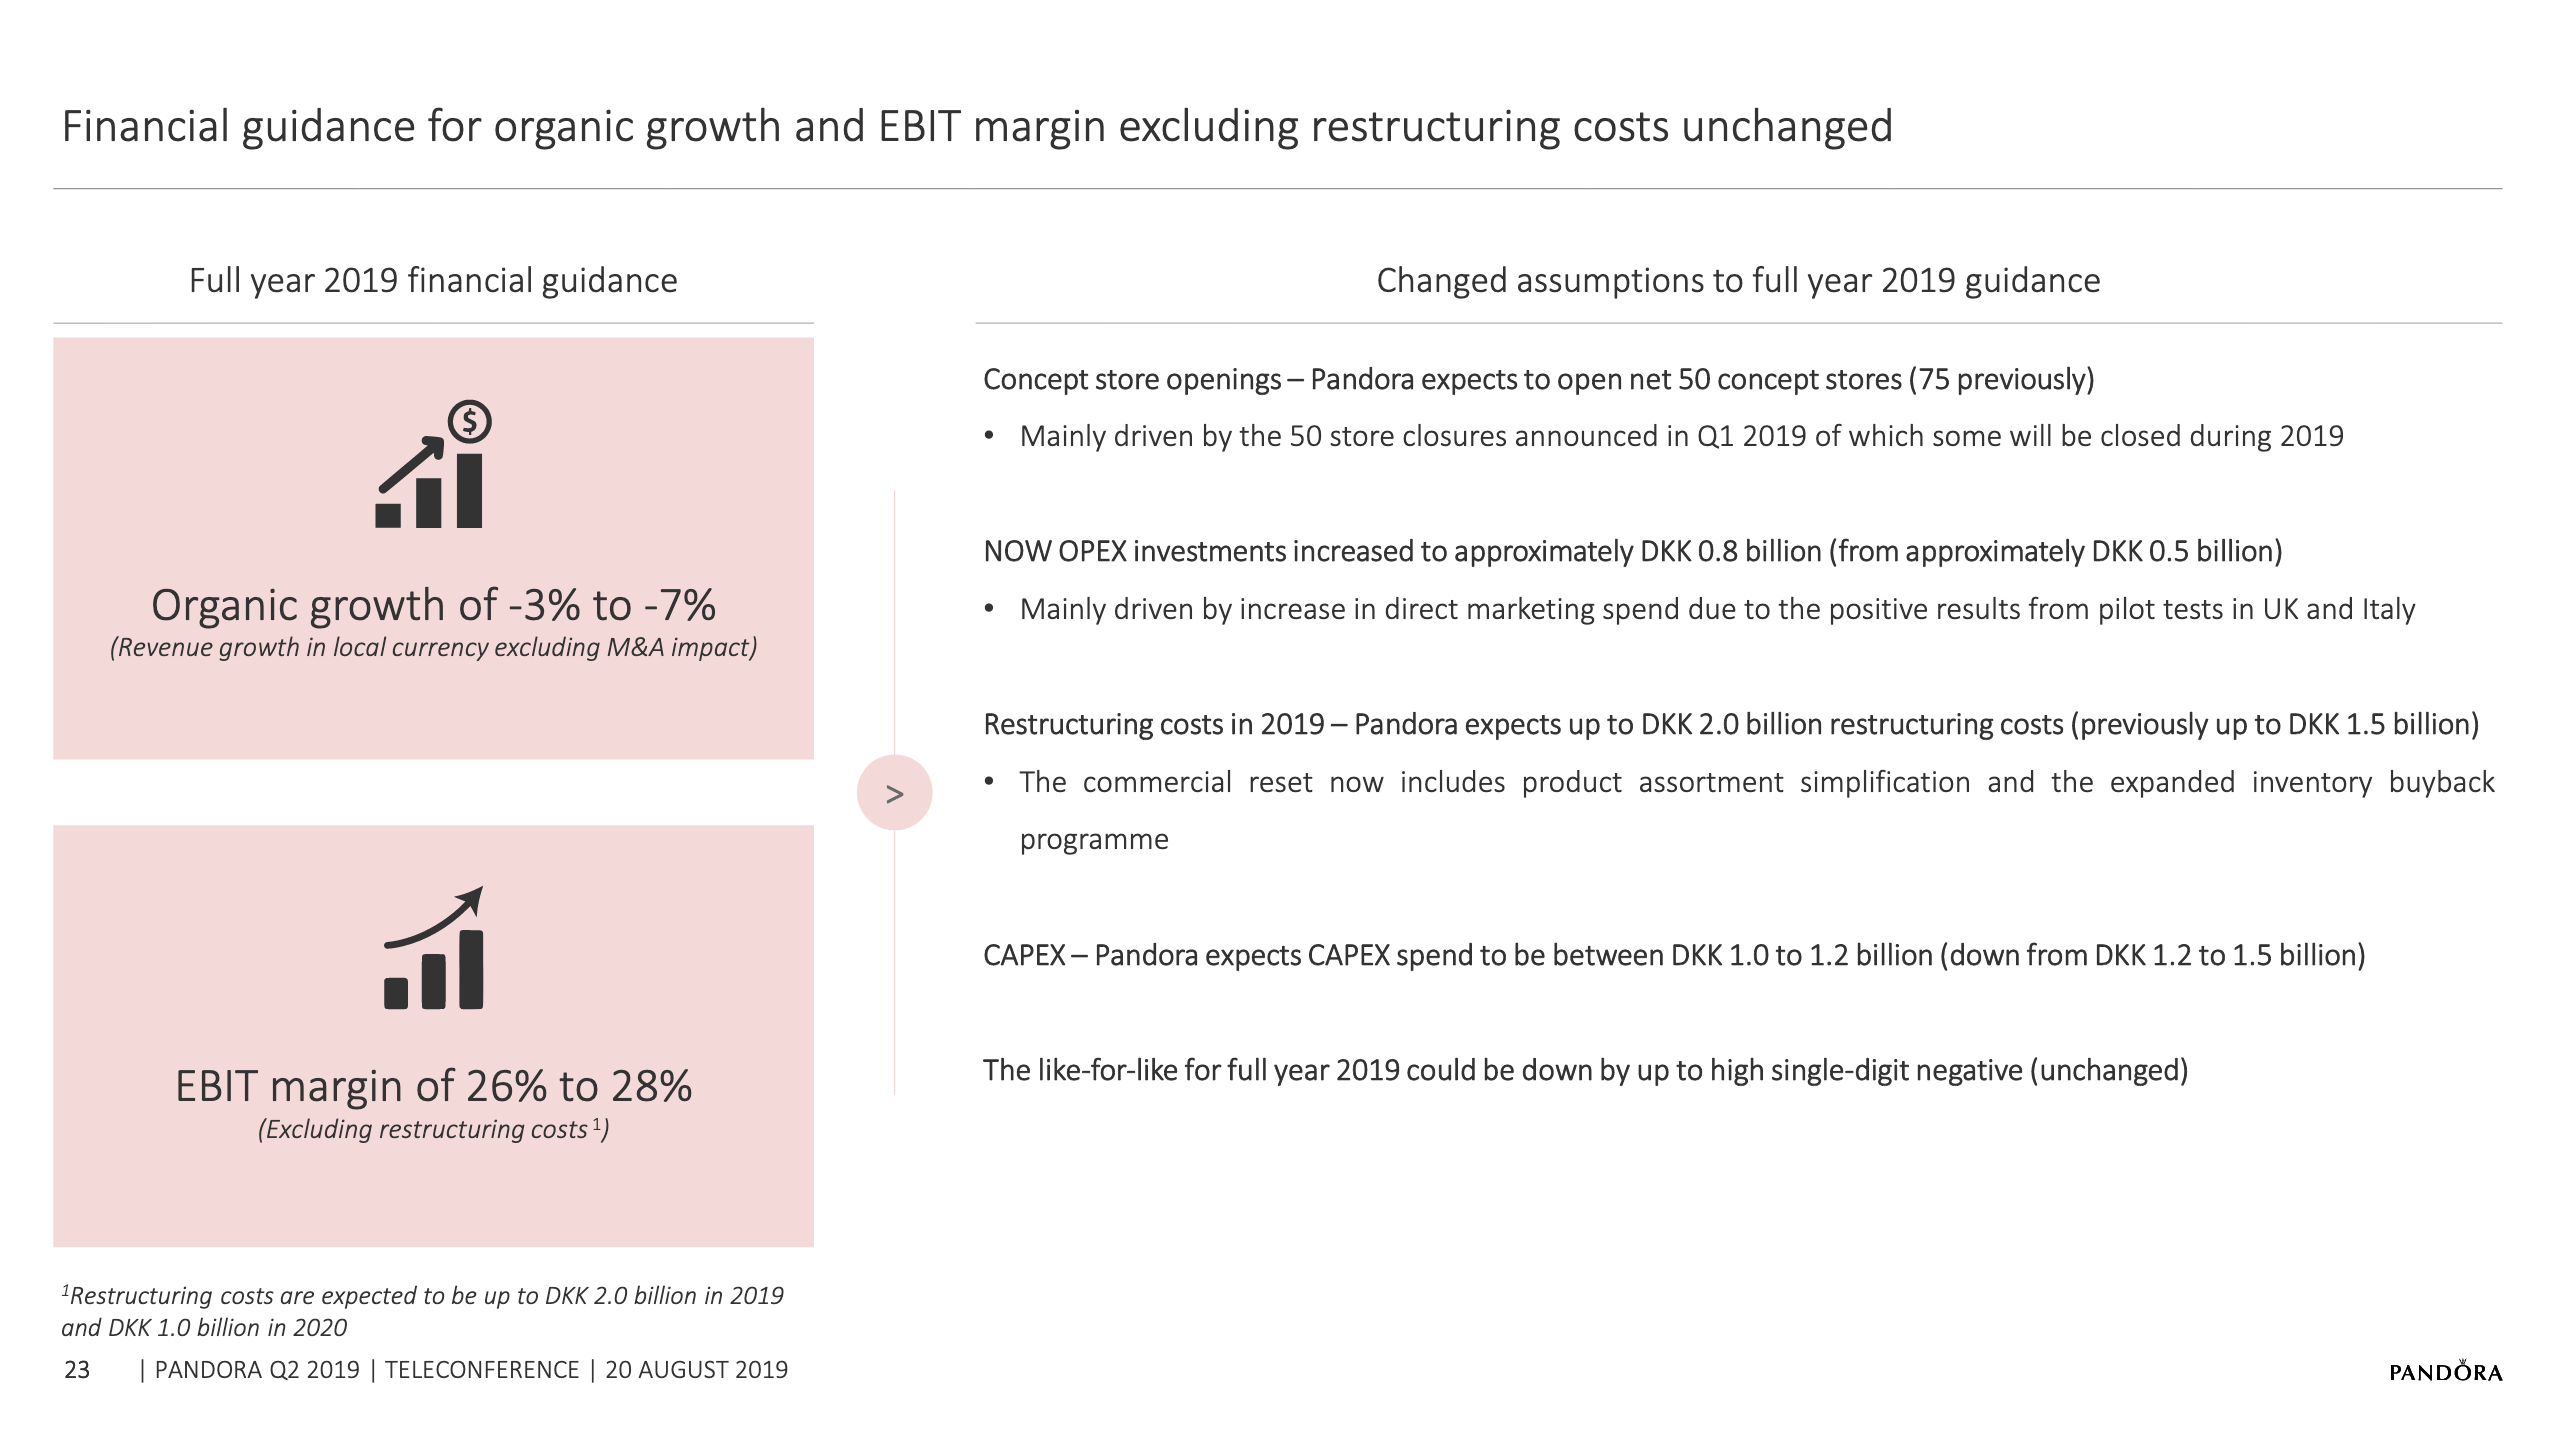
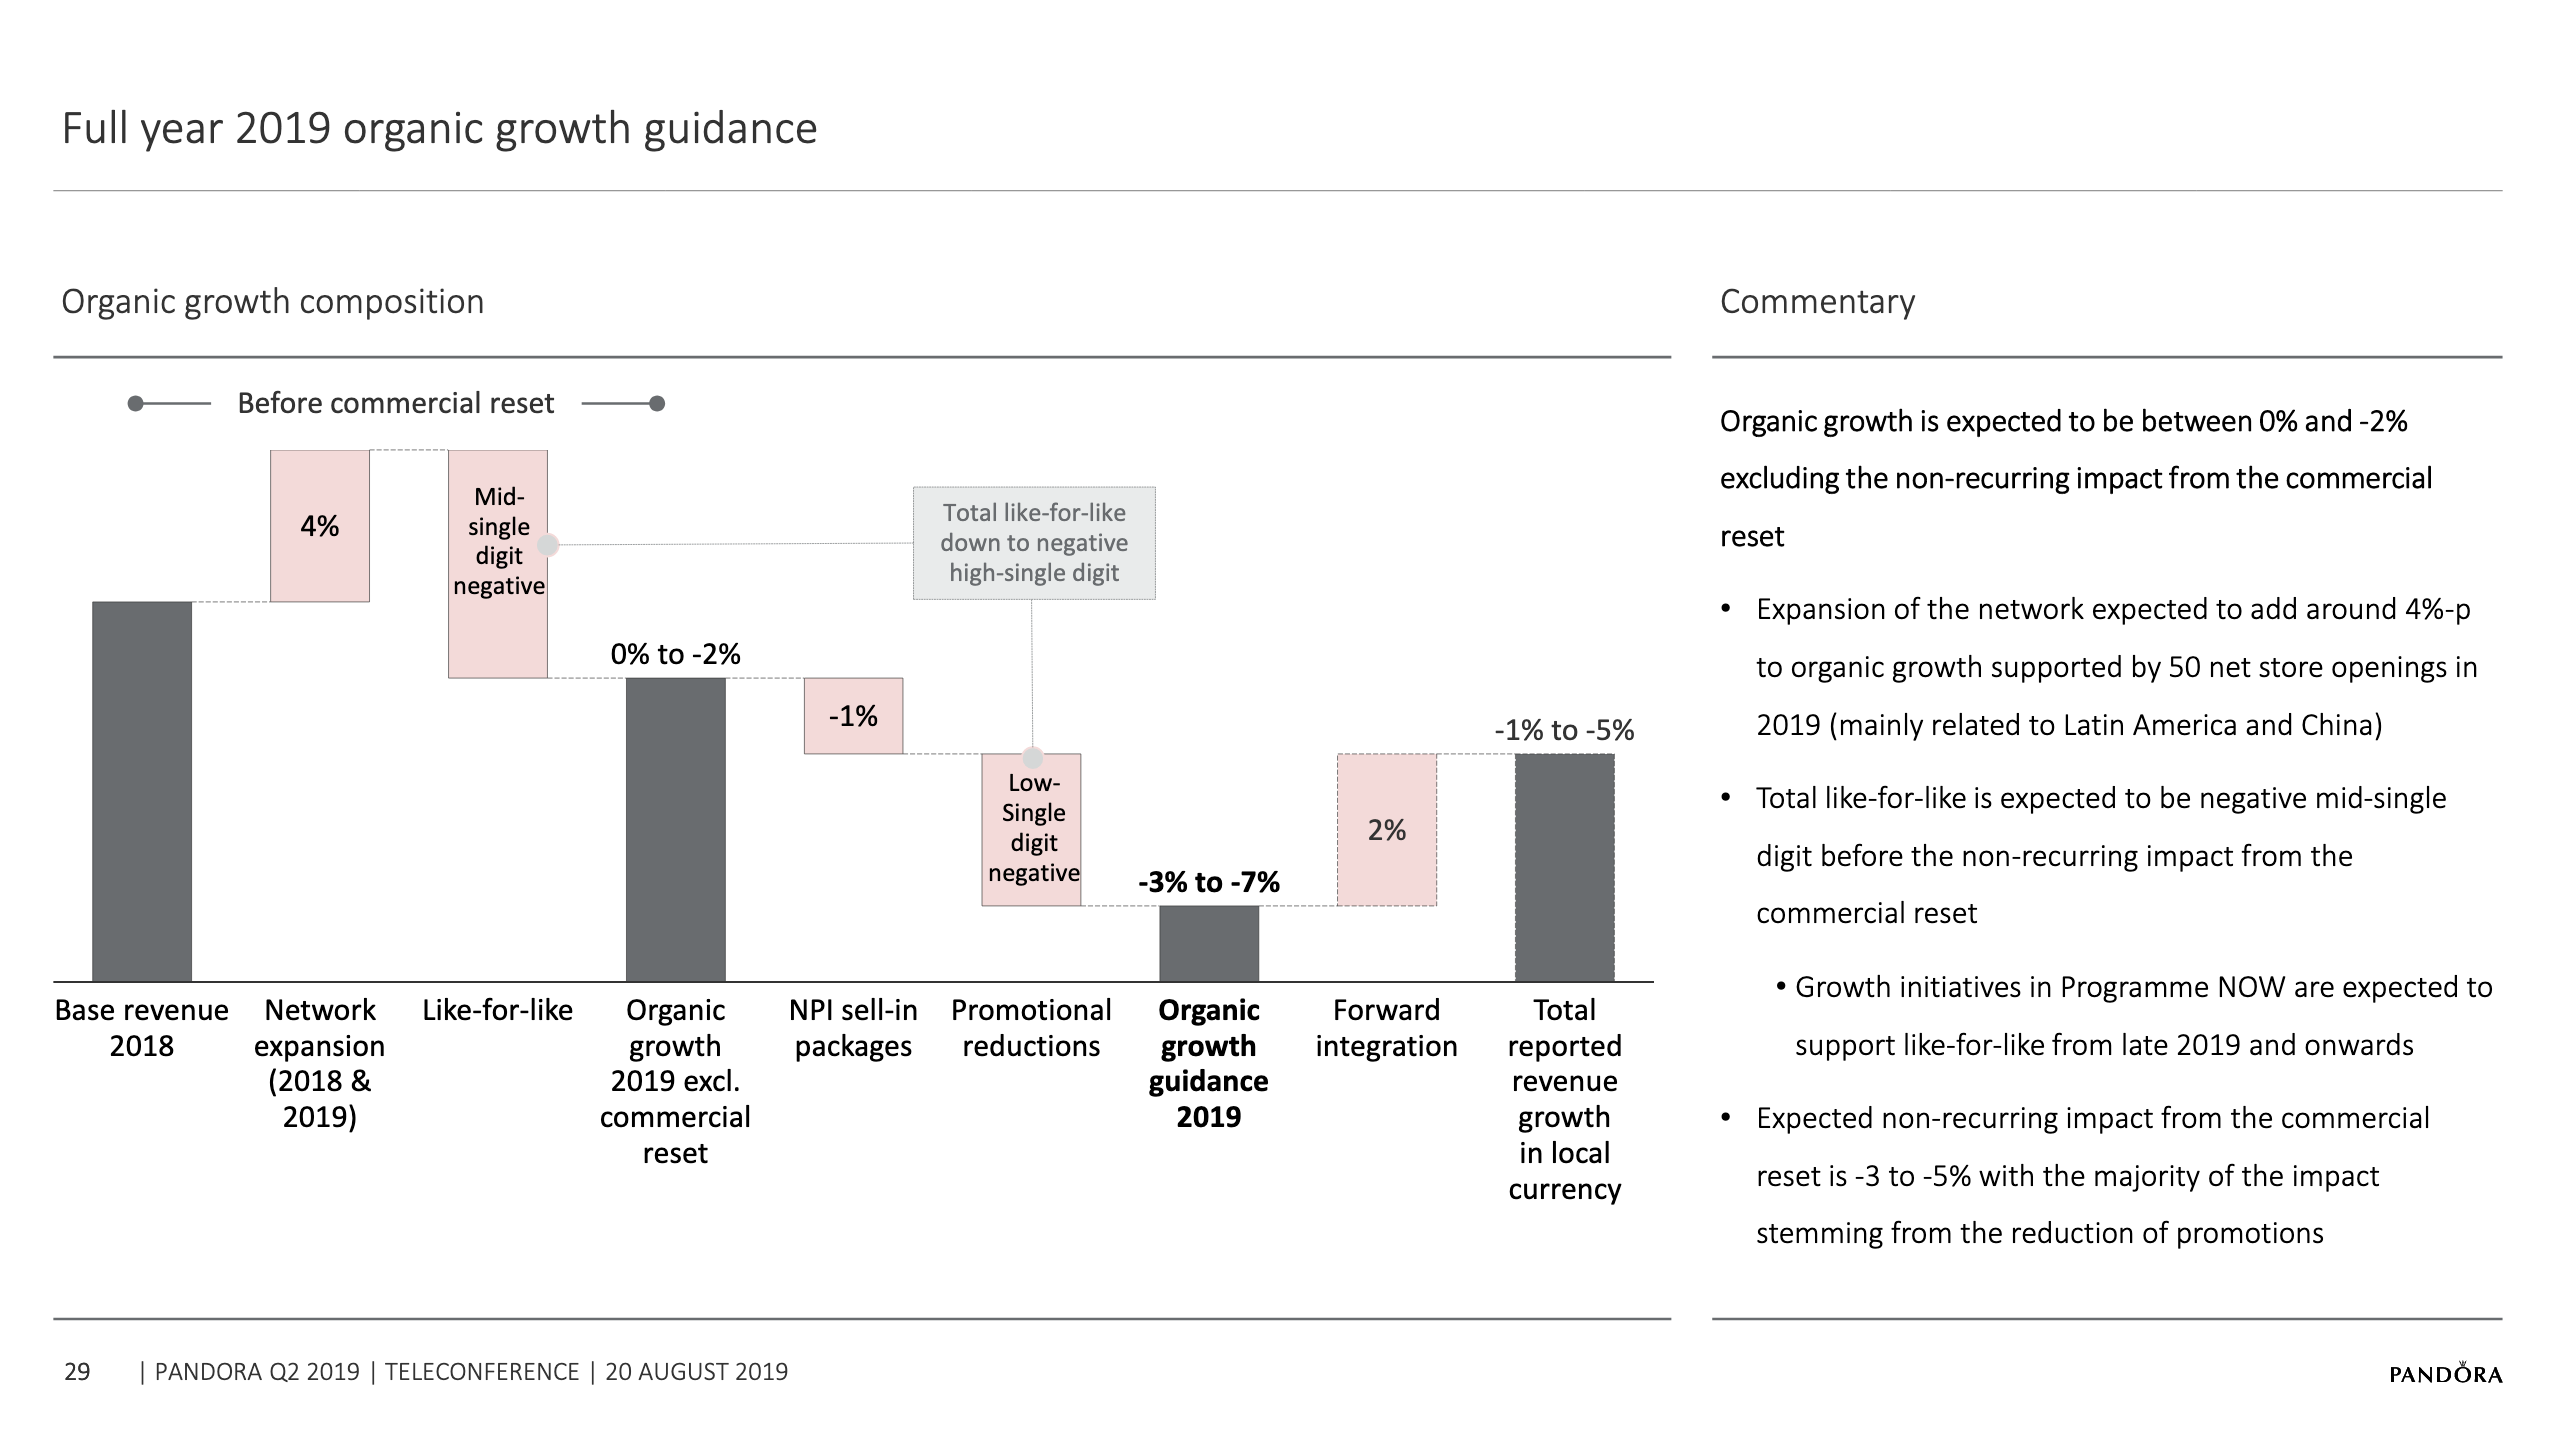
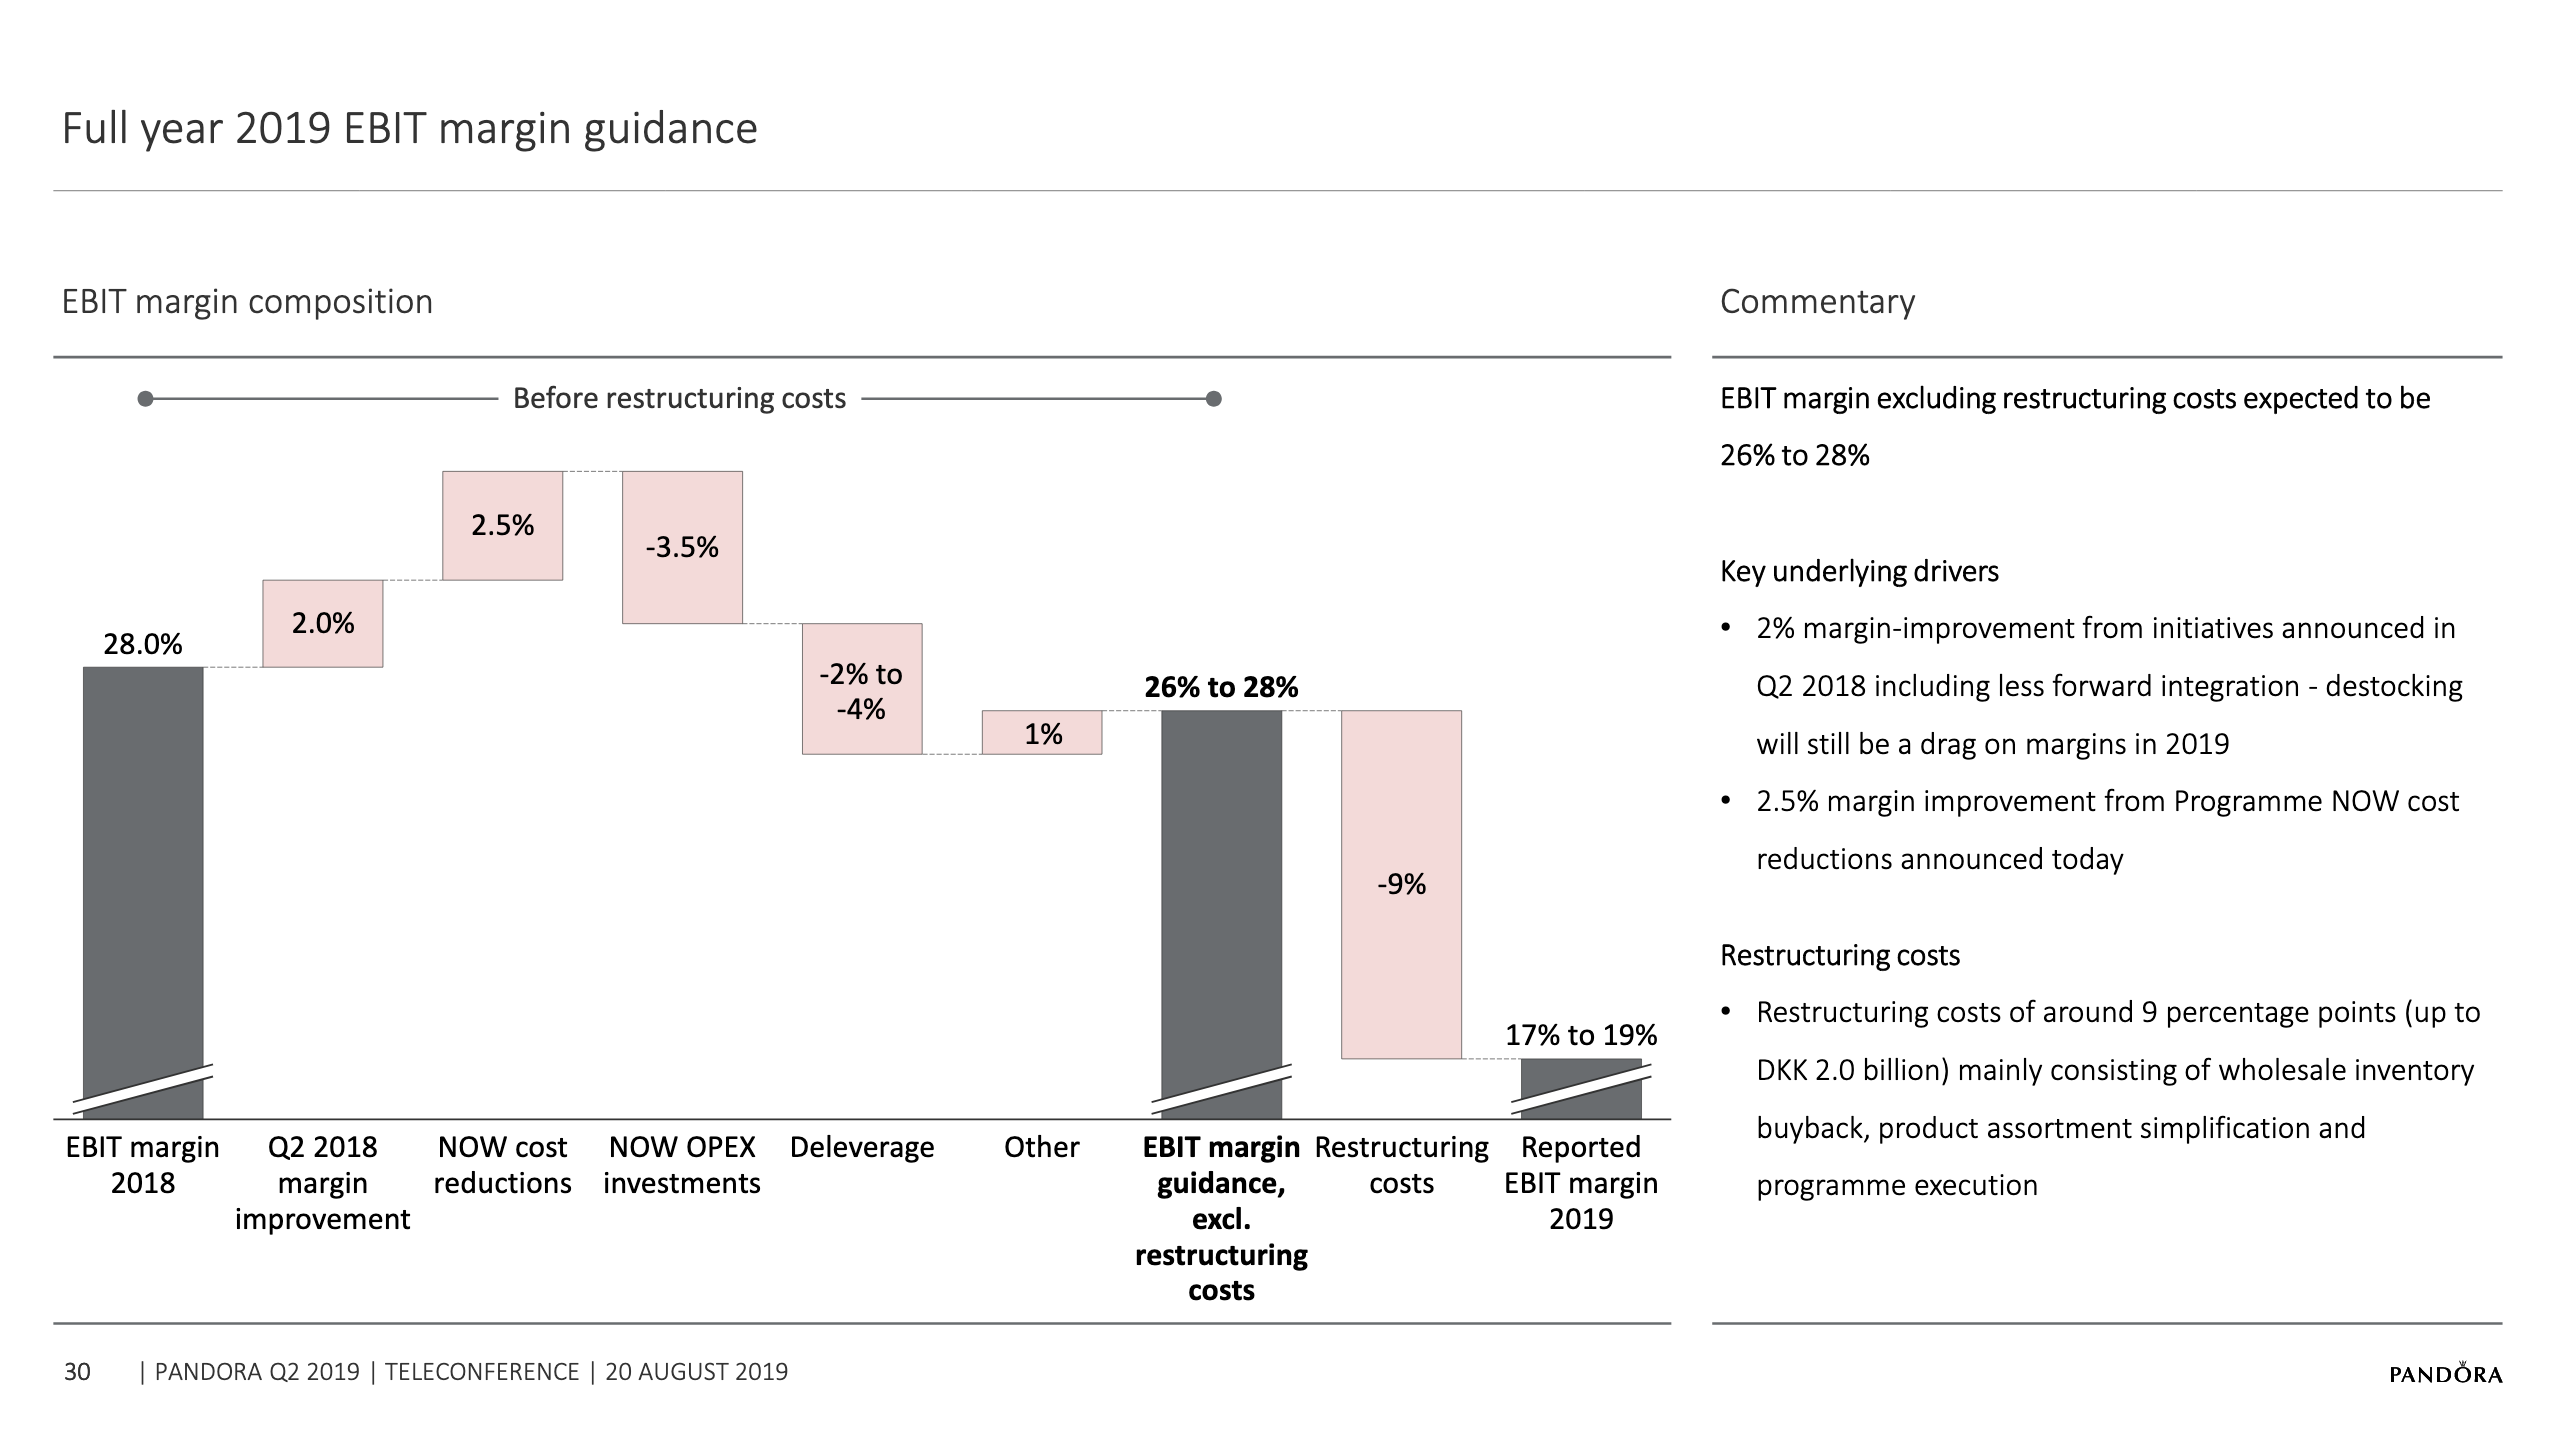
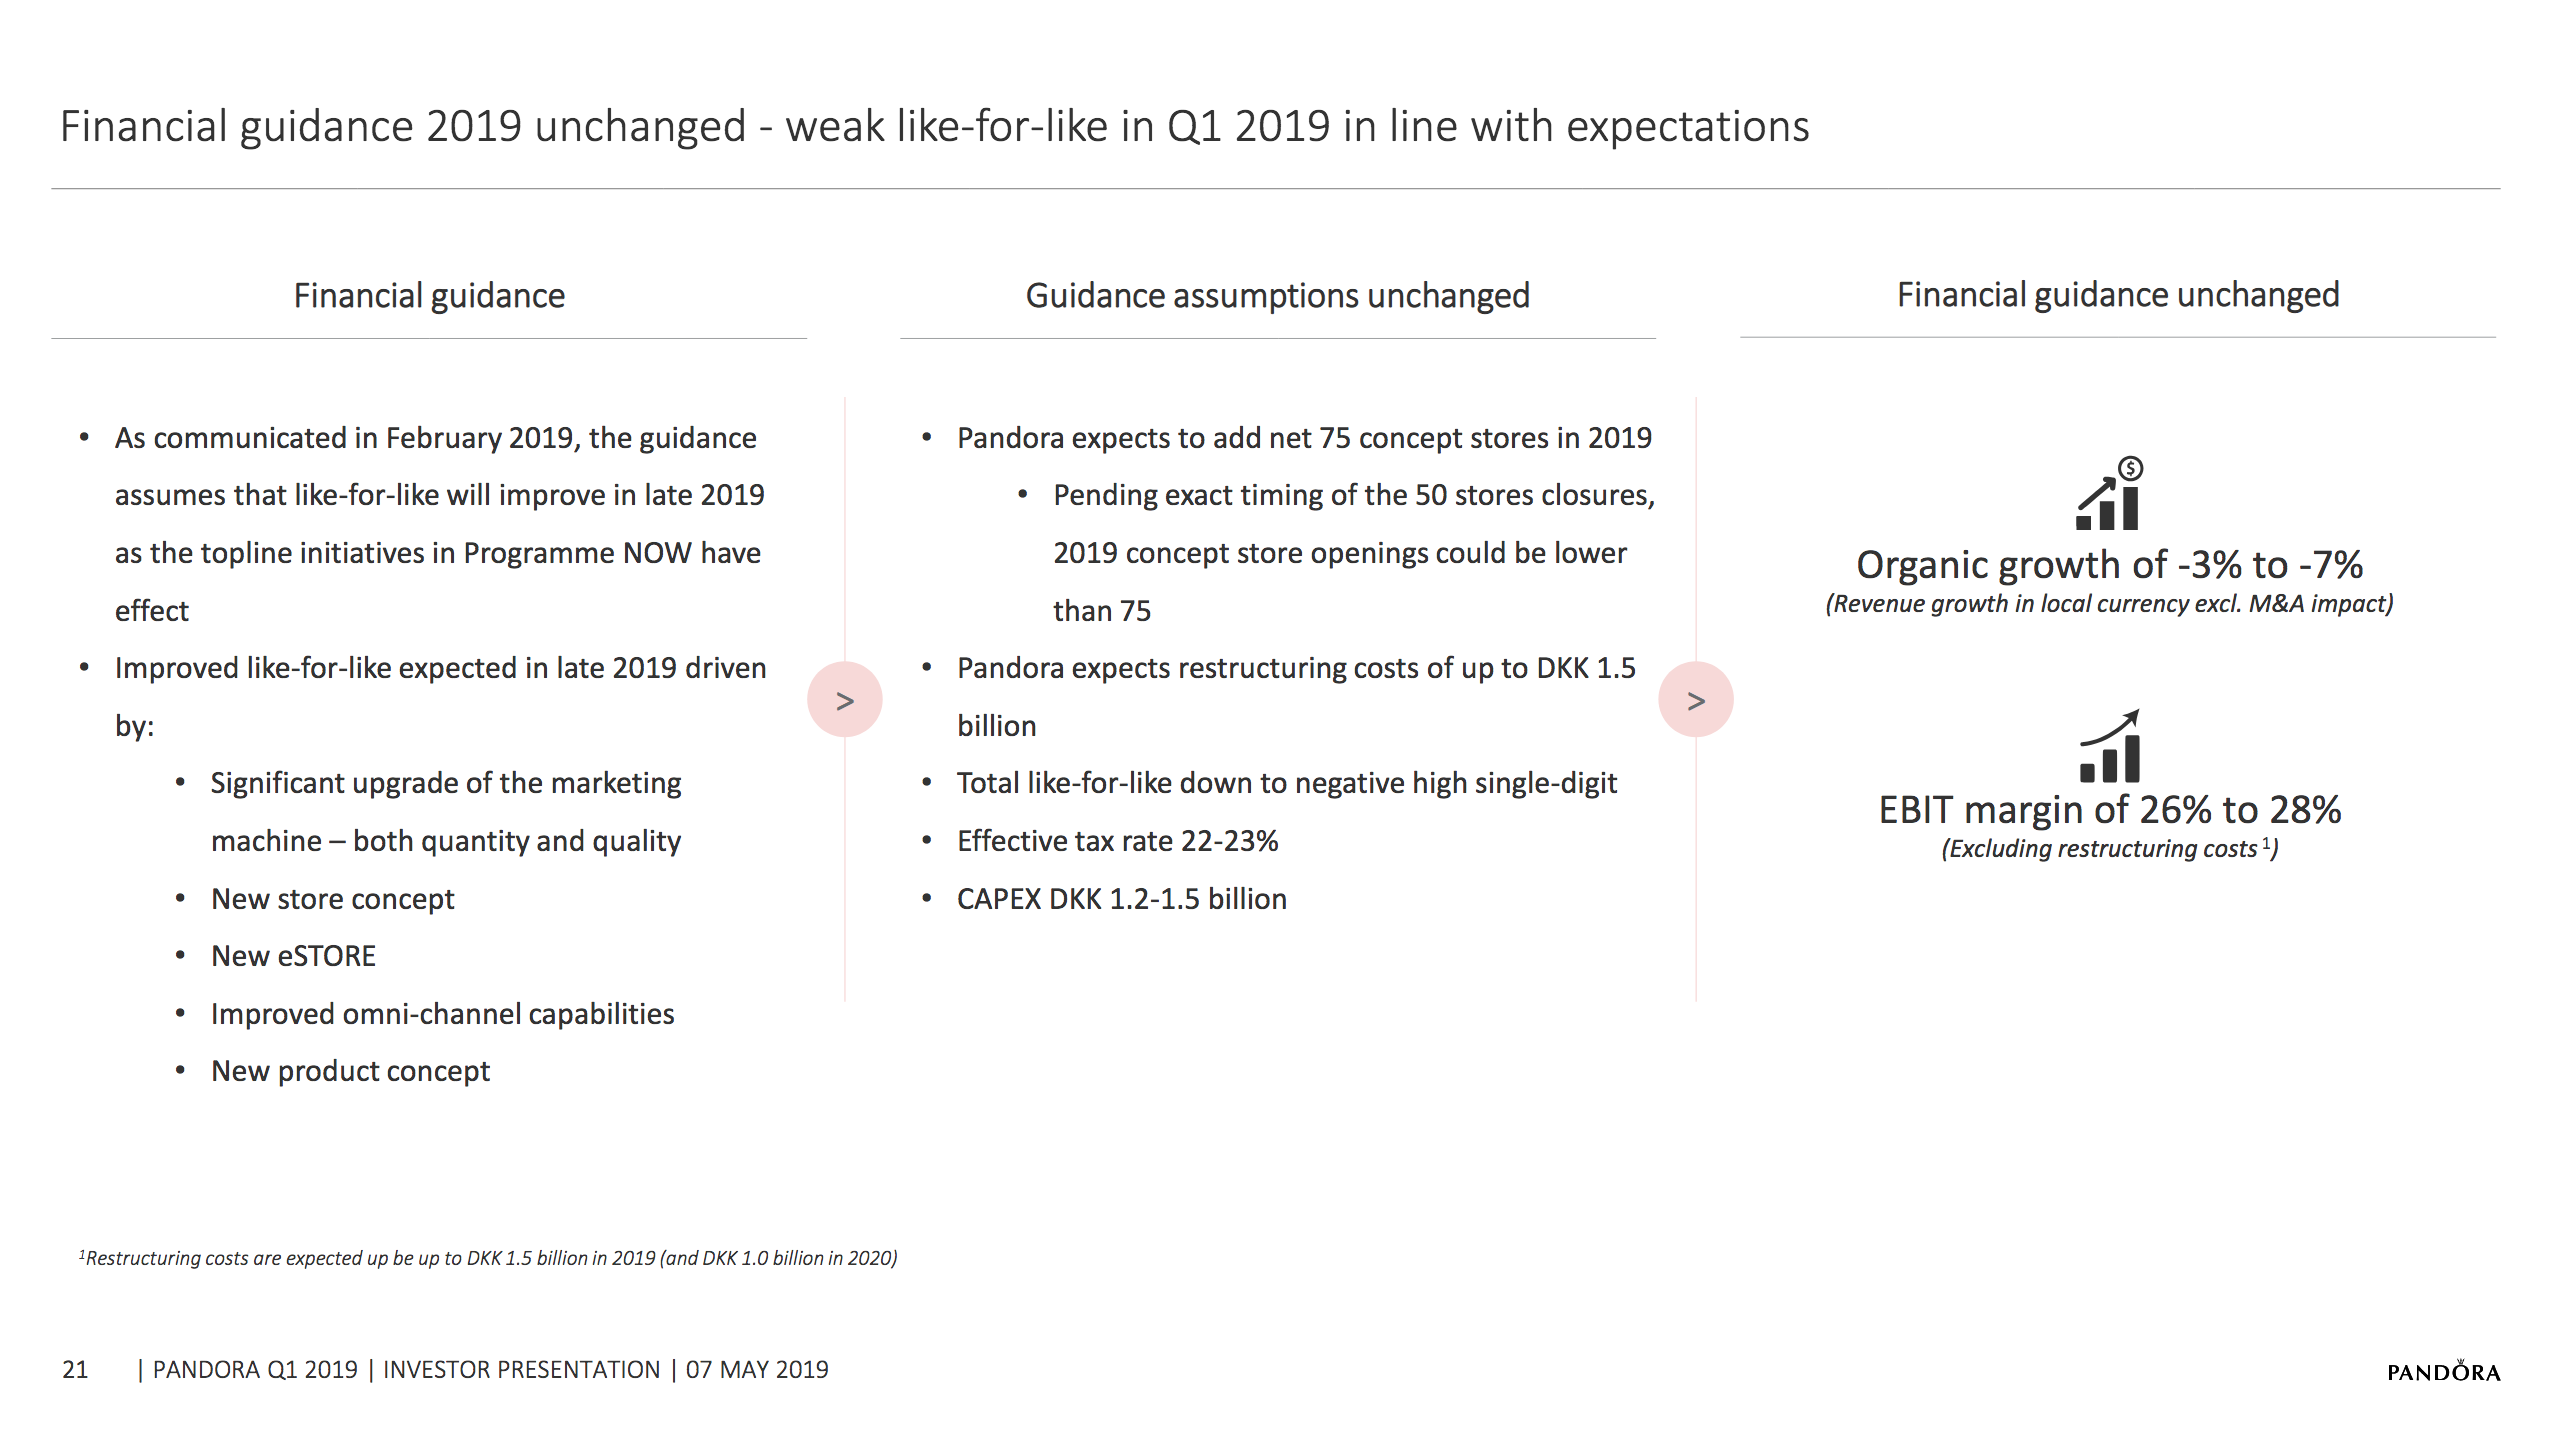
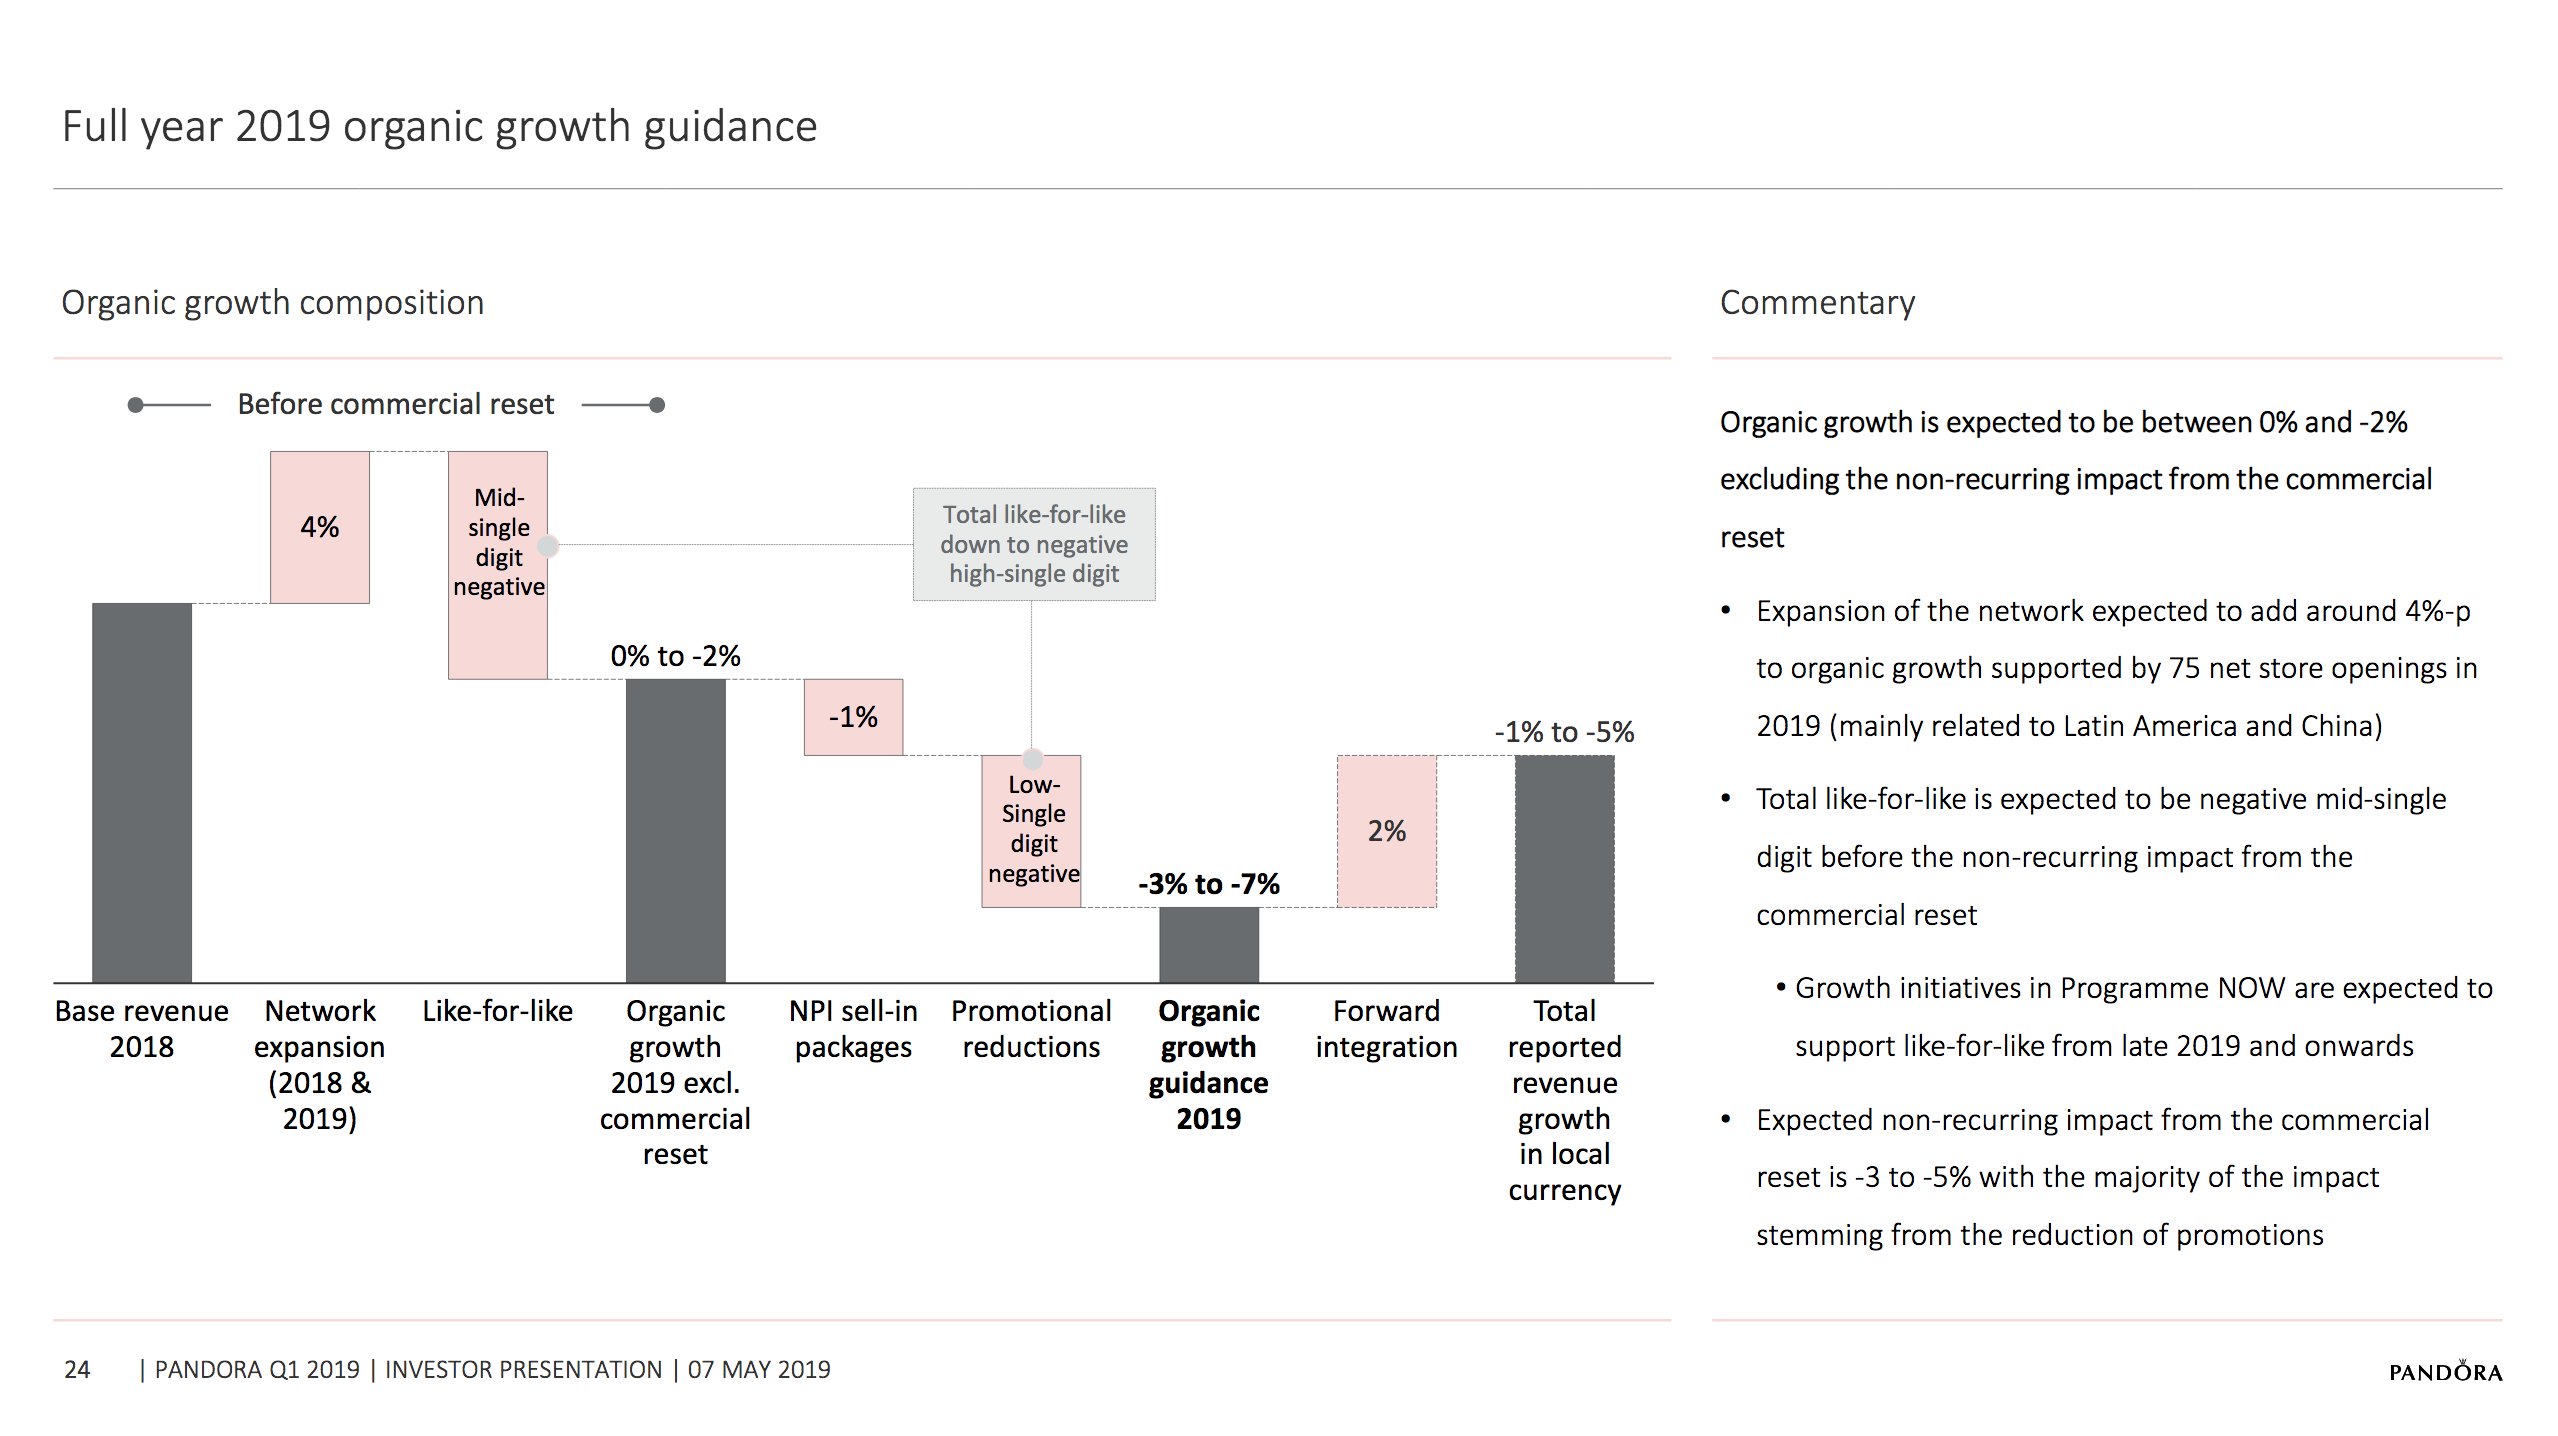
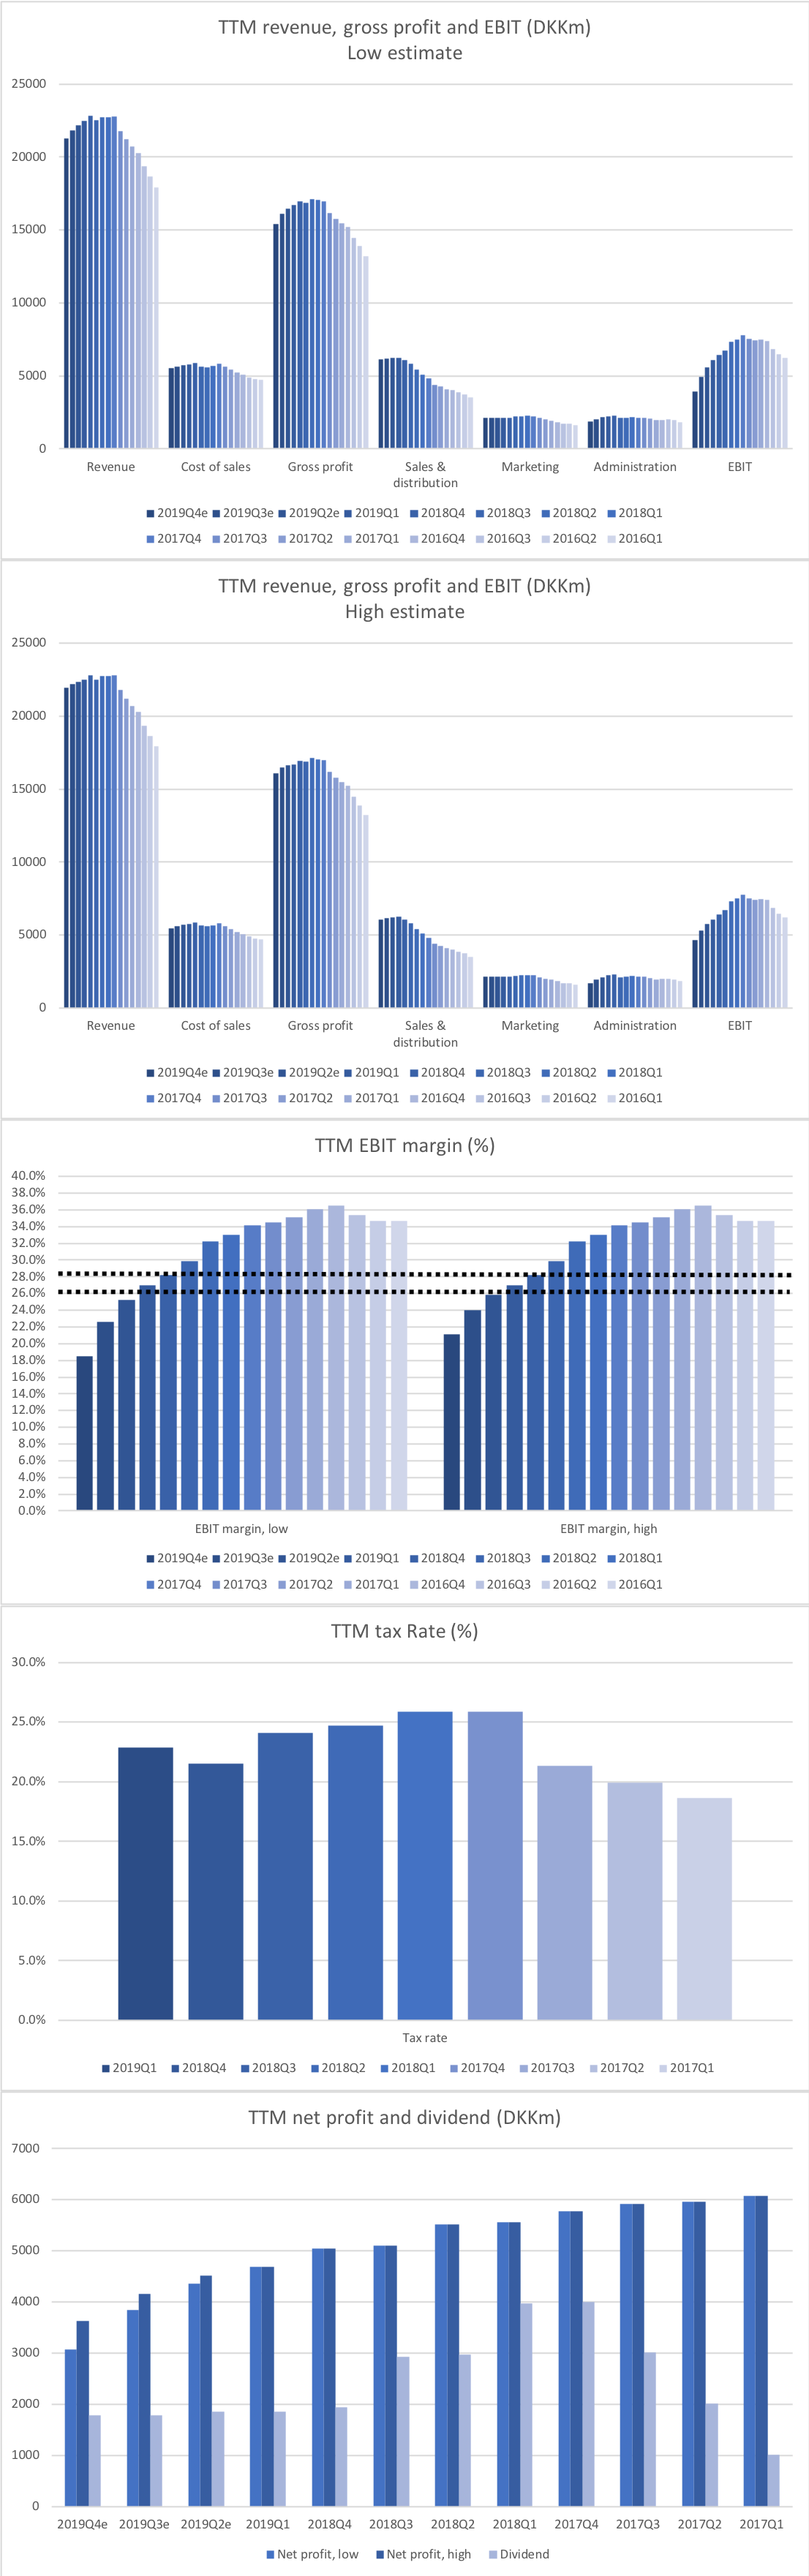
Pandora guides with negative growth of -3% to -7% and a lowered EBIT margin of 26% to 28% excluding restructuring costs.
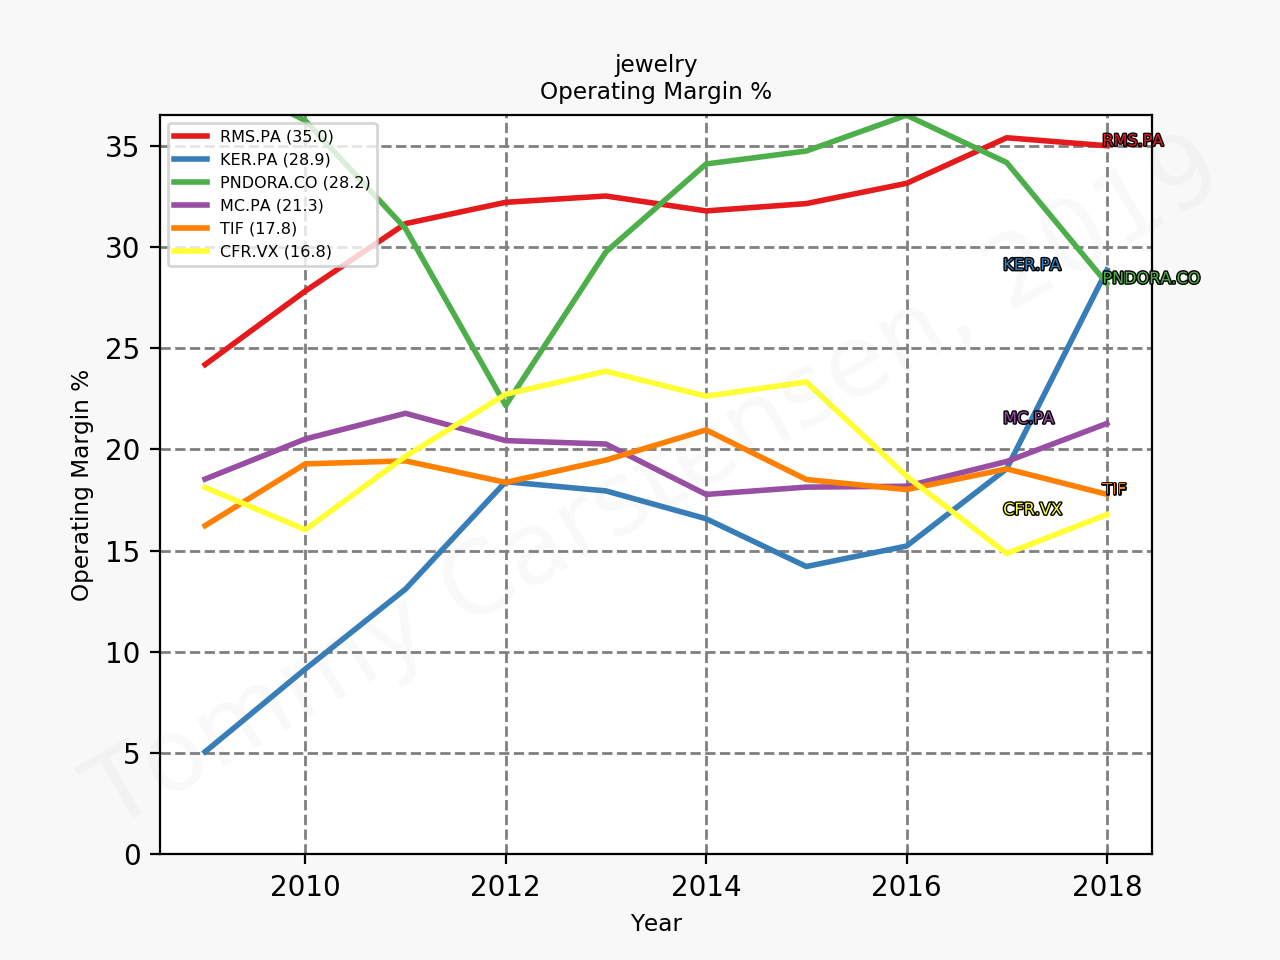
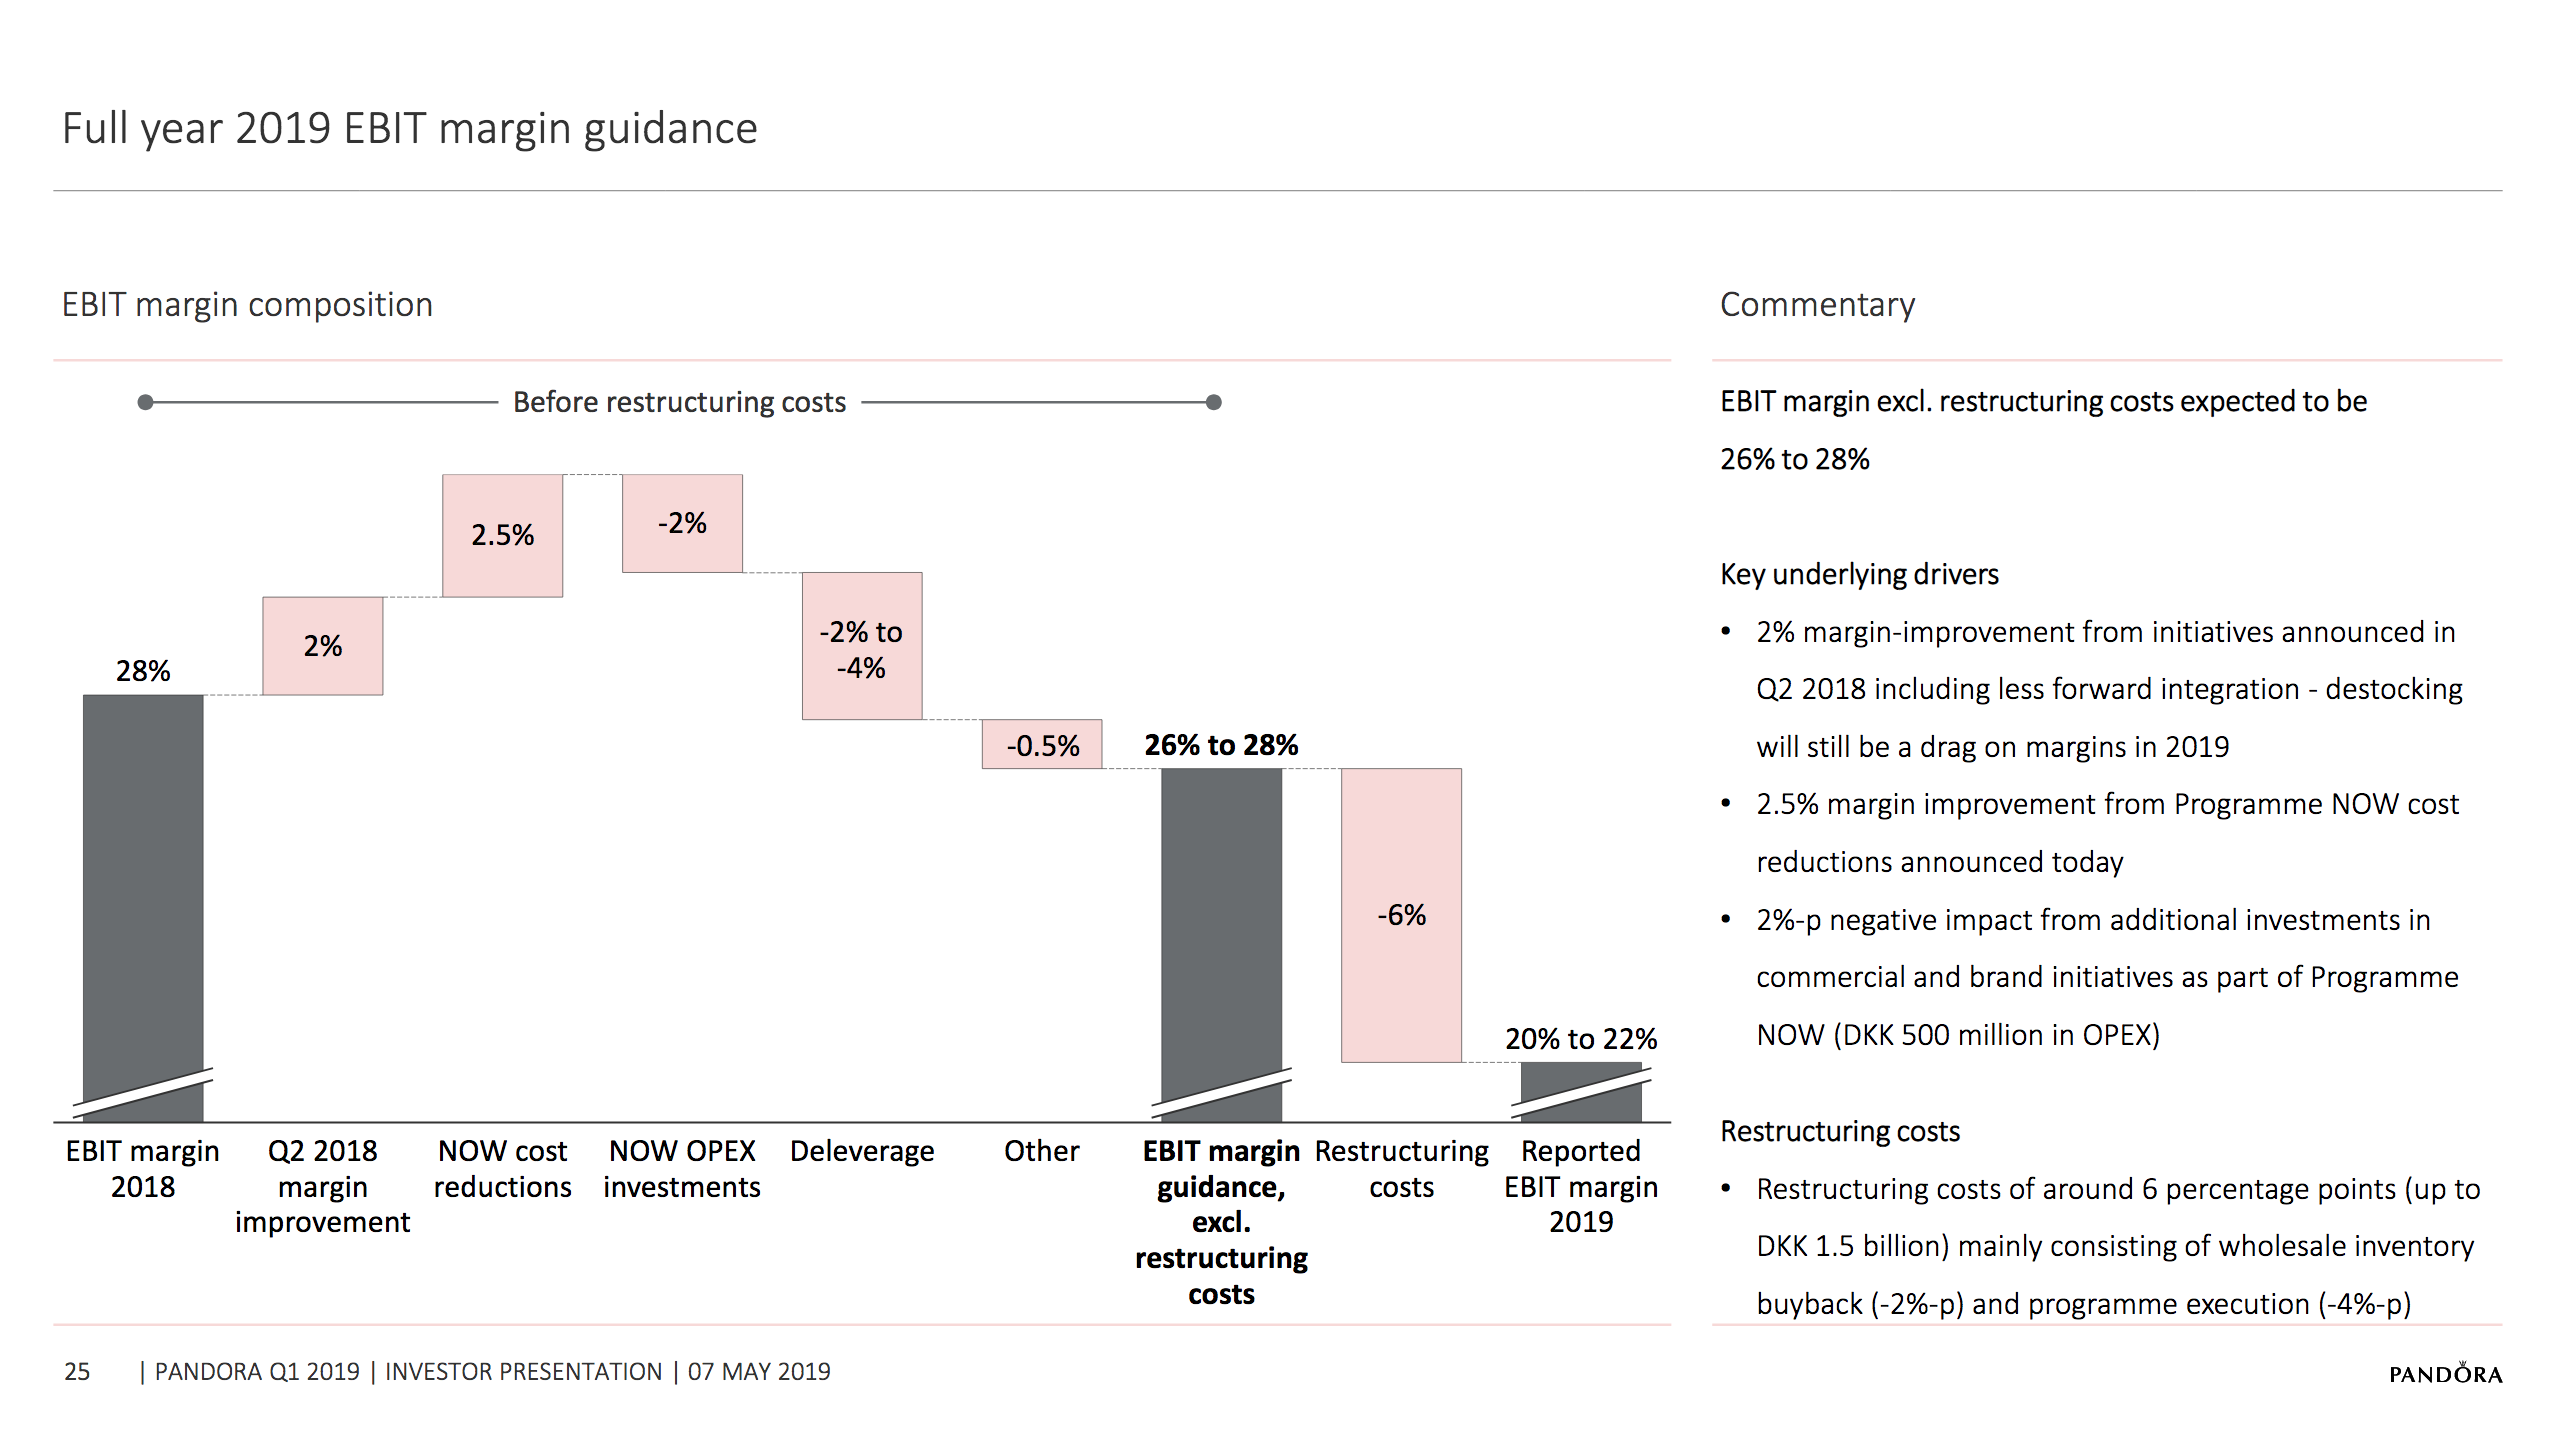
Despite guiding with a lower EBIT margin of 26% to 28% Pandora still has some of the best margins in the jewelry/luxury industry.
An attempt can be made to estimate the 2019 FY earnings. Pandora is guiding with organic growth in the range -7% to -3% and an EBIT margin in the range 26-28%. Below are some more pessimistic expectations regarding earnings and margins prior to restructuring costs based on the lower and higher end of estimates regarding organic growth and cost savings.
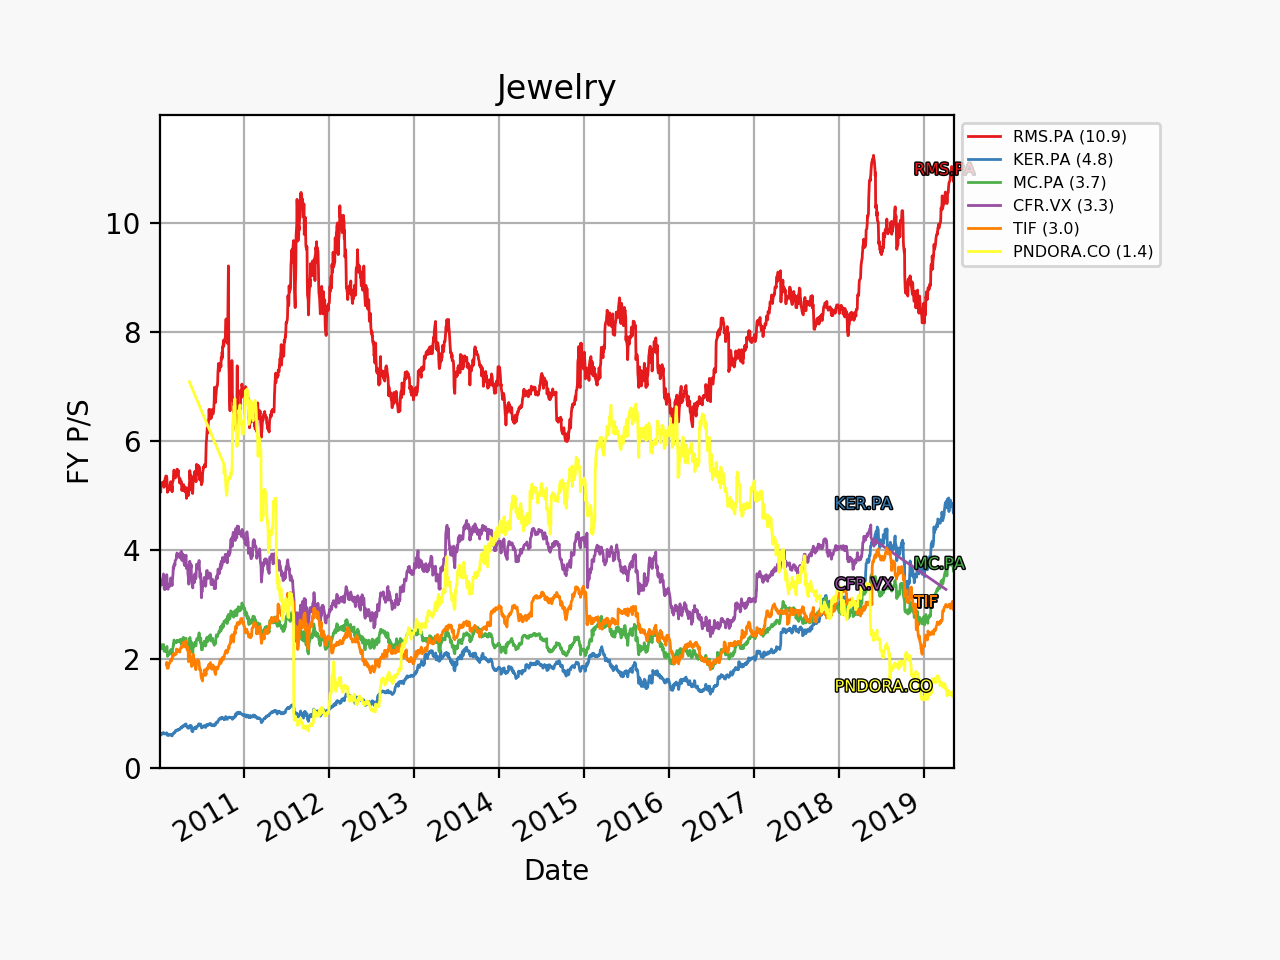
By any measure Pandora currently trades at an attractive price; even when factoring in, that net profit could very well be 30% lower in 2019 compared to 2018. Below various multiples such as trailing annual P/E (5.7) are shown.
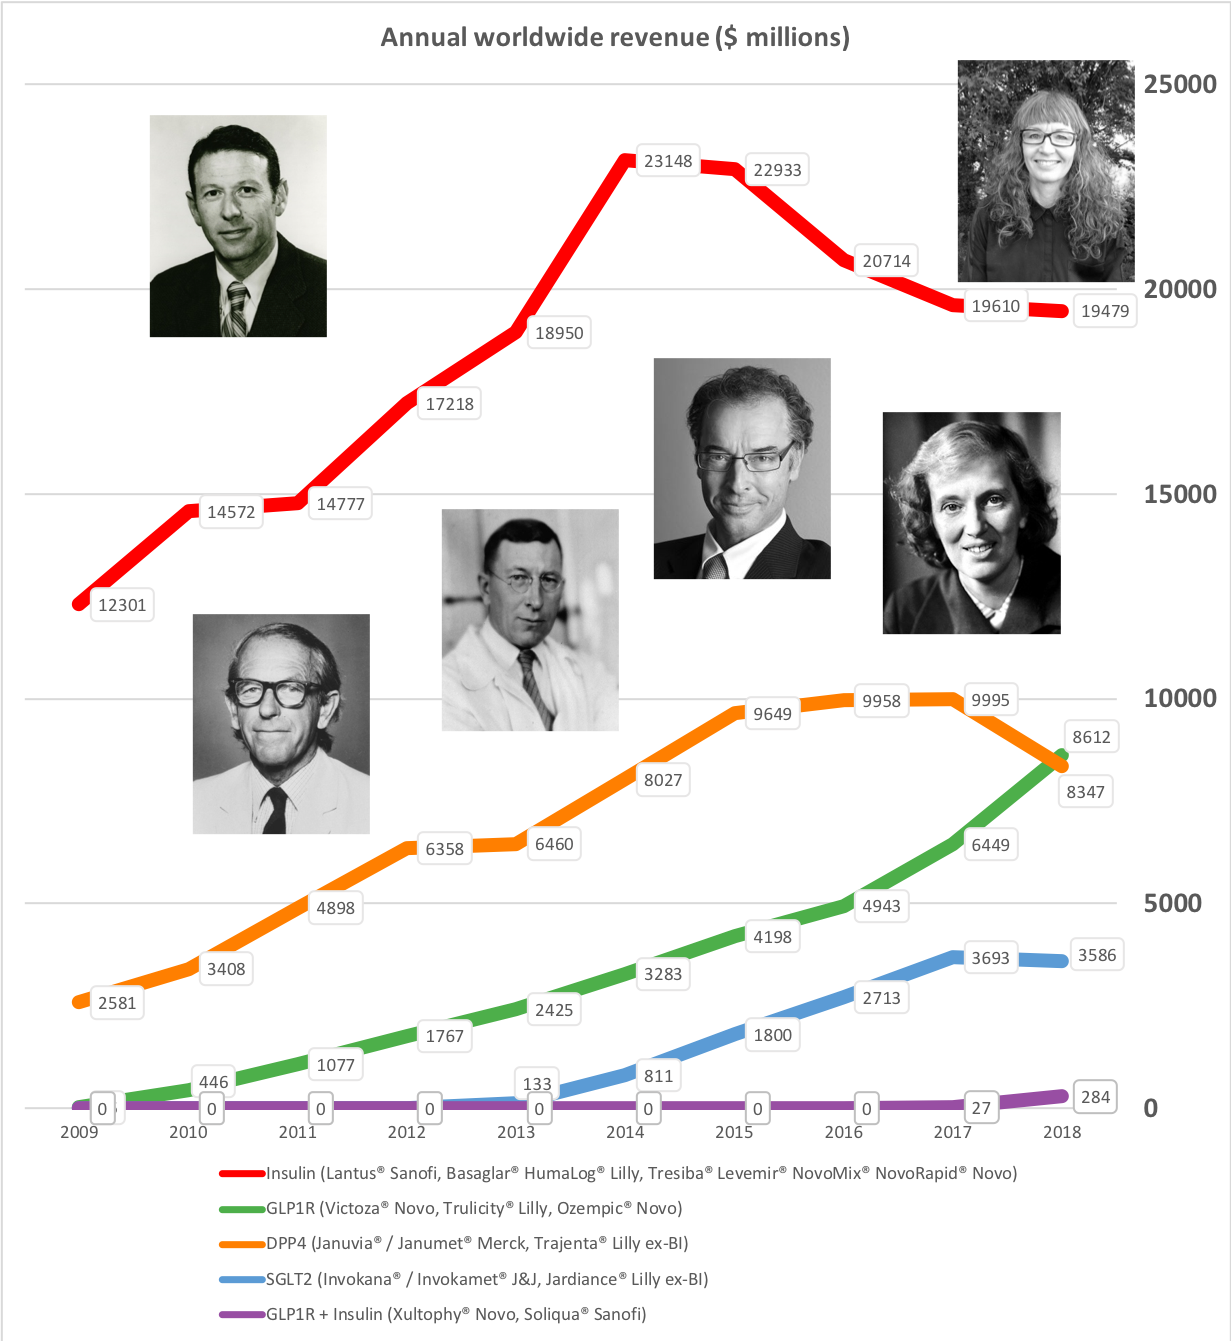
Press releases regarding first quarter results have been issued from diabetes competitors Novo Nordisk, Eli Lilly, Sanofi and others. Four of the main antidiabetic drug types manufactured by these pharmaceutical companies are insulin, GLP-1 receptor agonists, SGLT2 inhibitors (gliflozins) and DPP4 inhibitors (gliptins). The development in each of the four drug categories is covered in separate sections belows. Revenue market share is shifting from insulin to GLP1 and it is happening faster in the US than the rest of the world.
GLP-1 receptor agonists
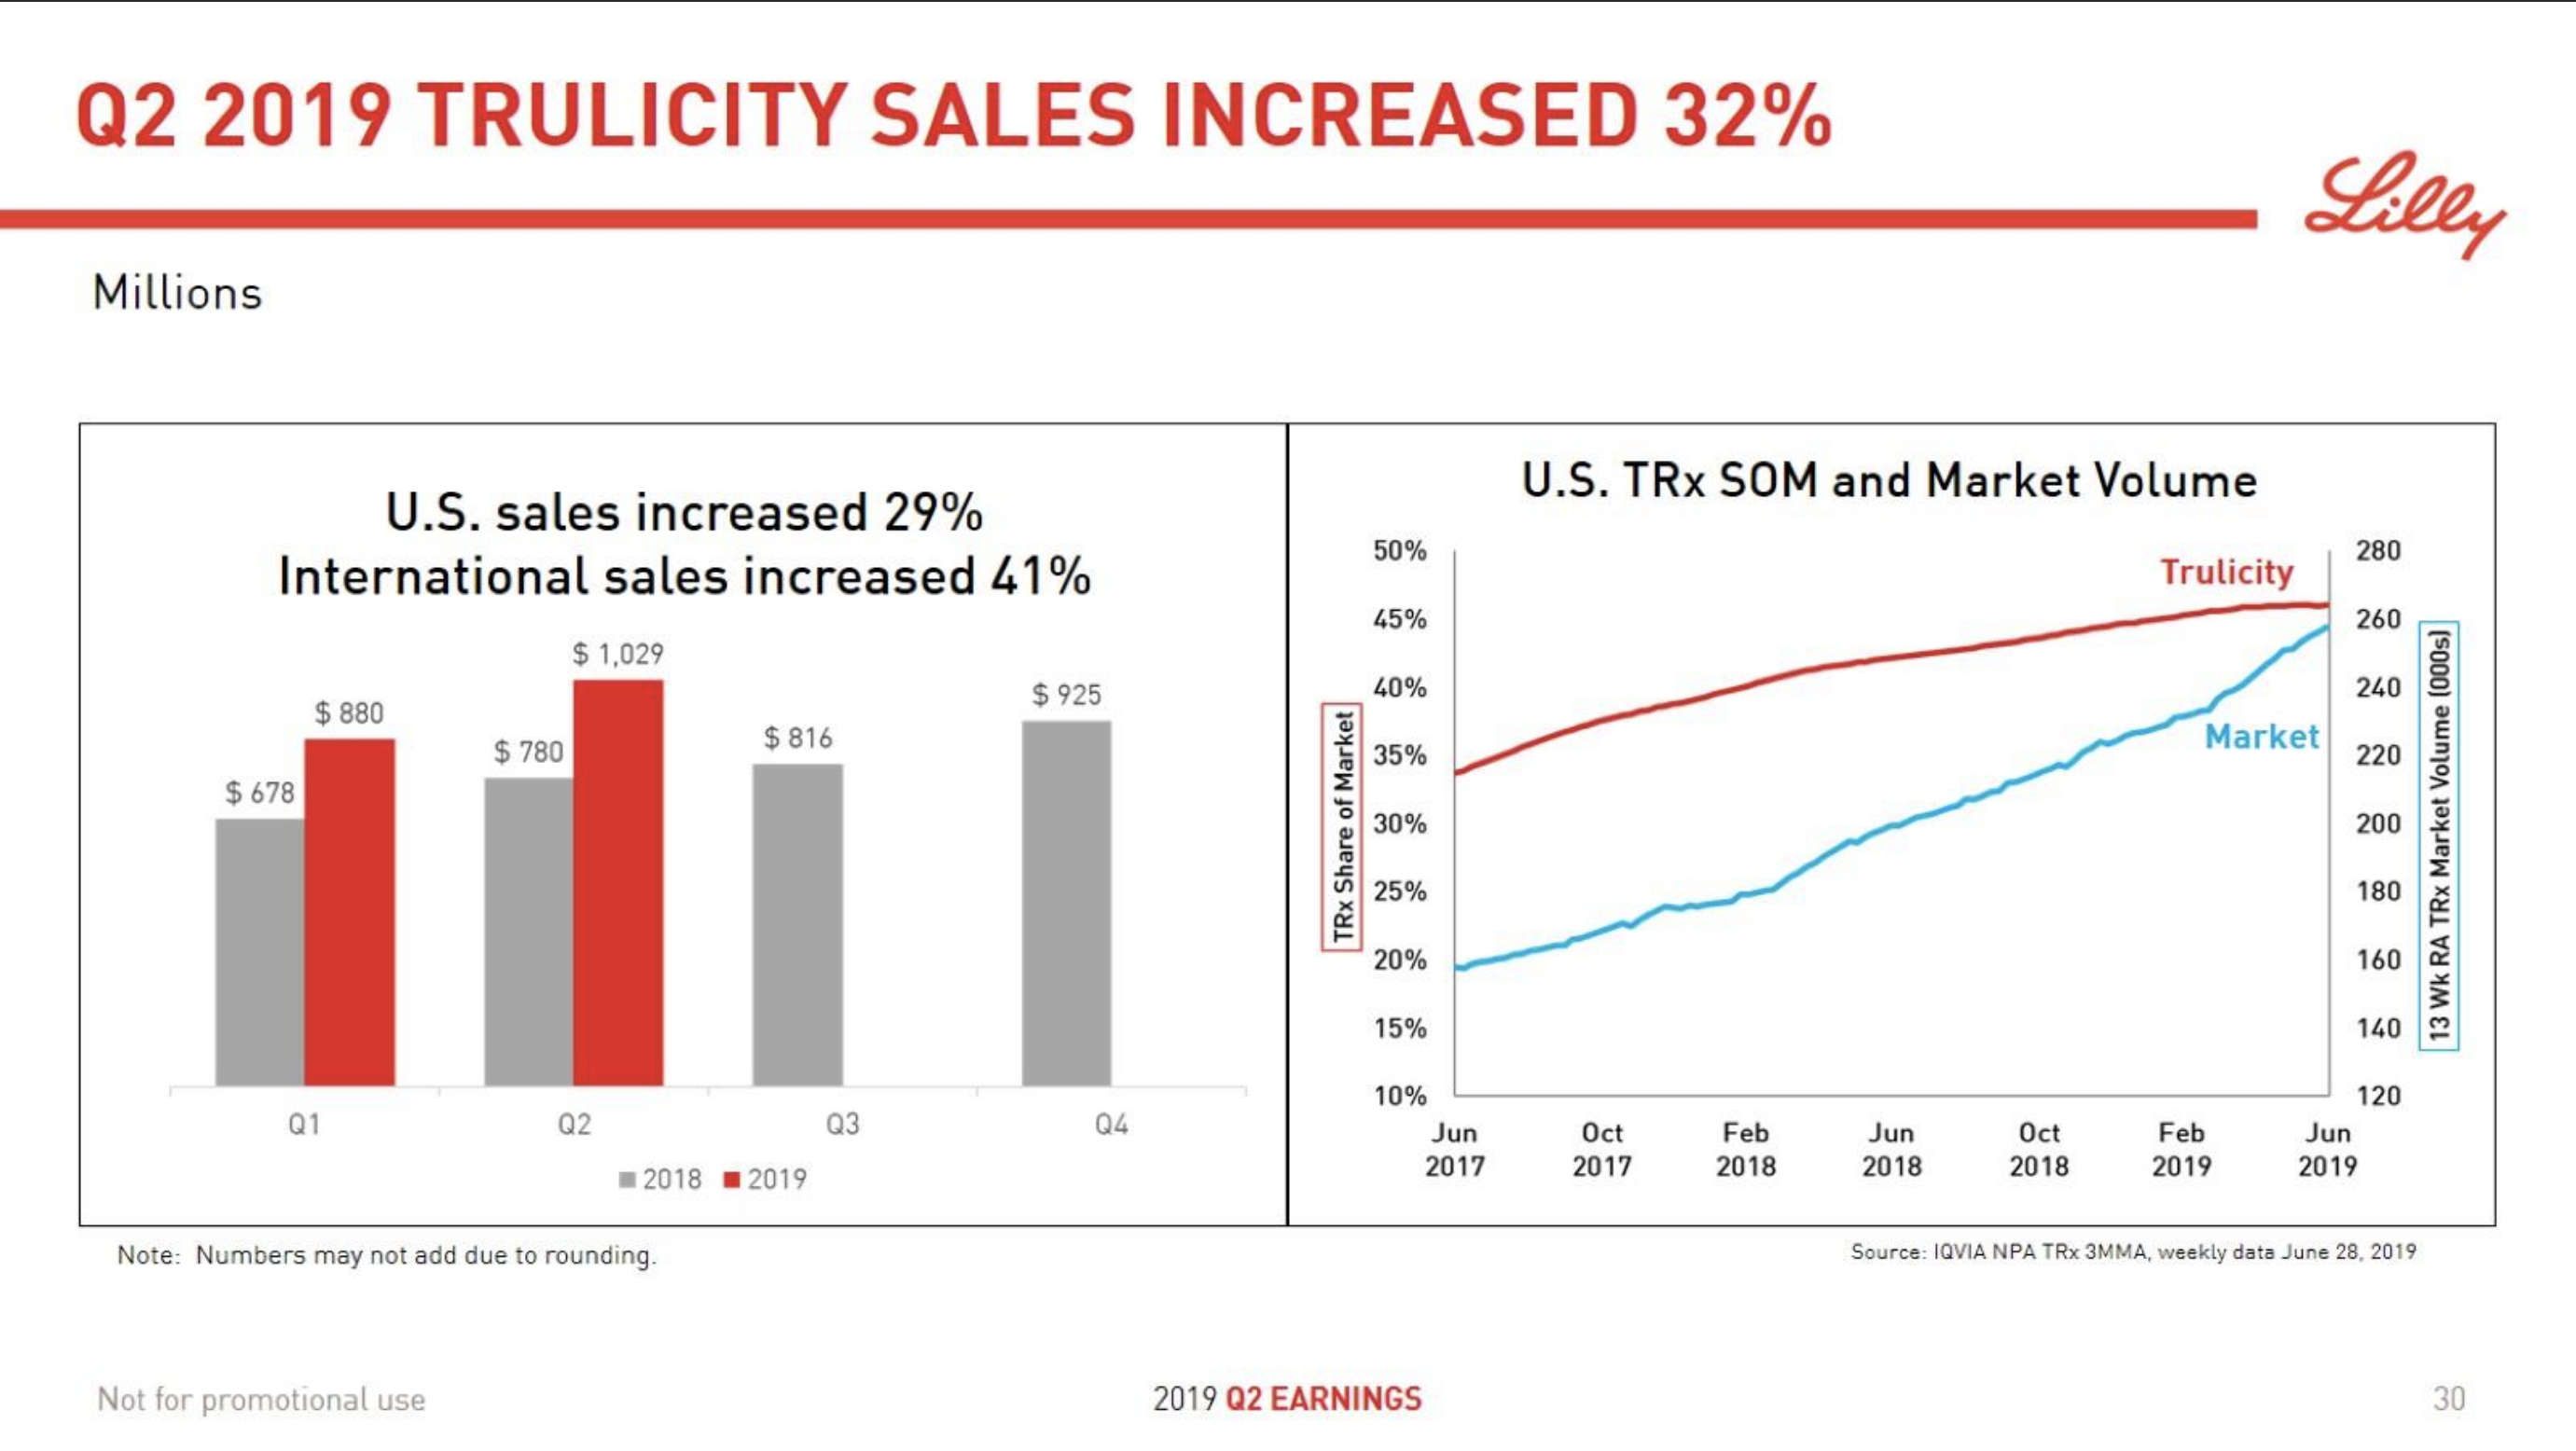
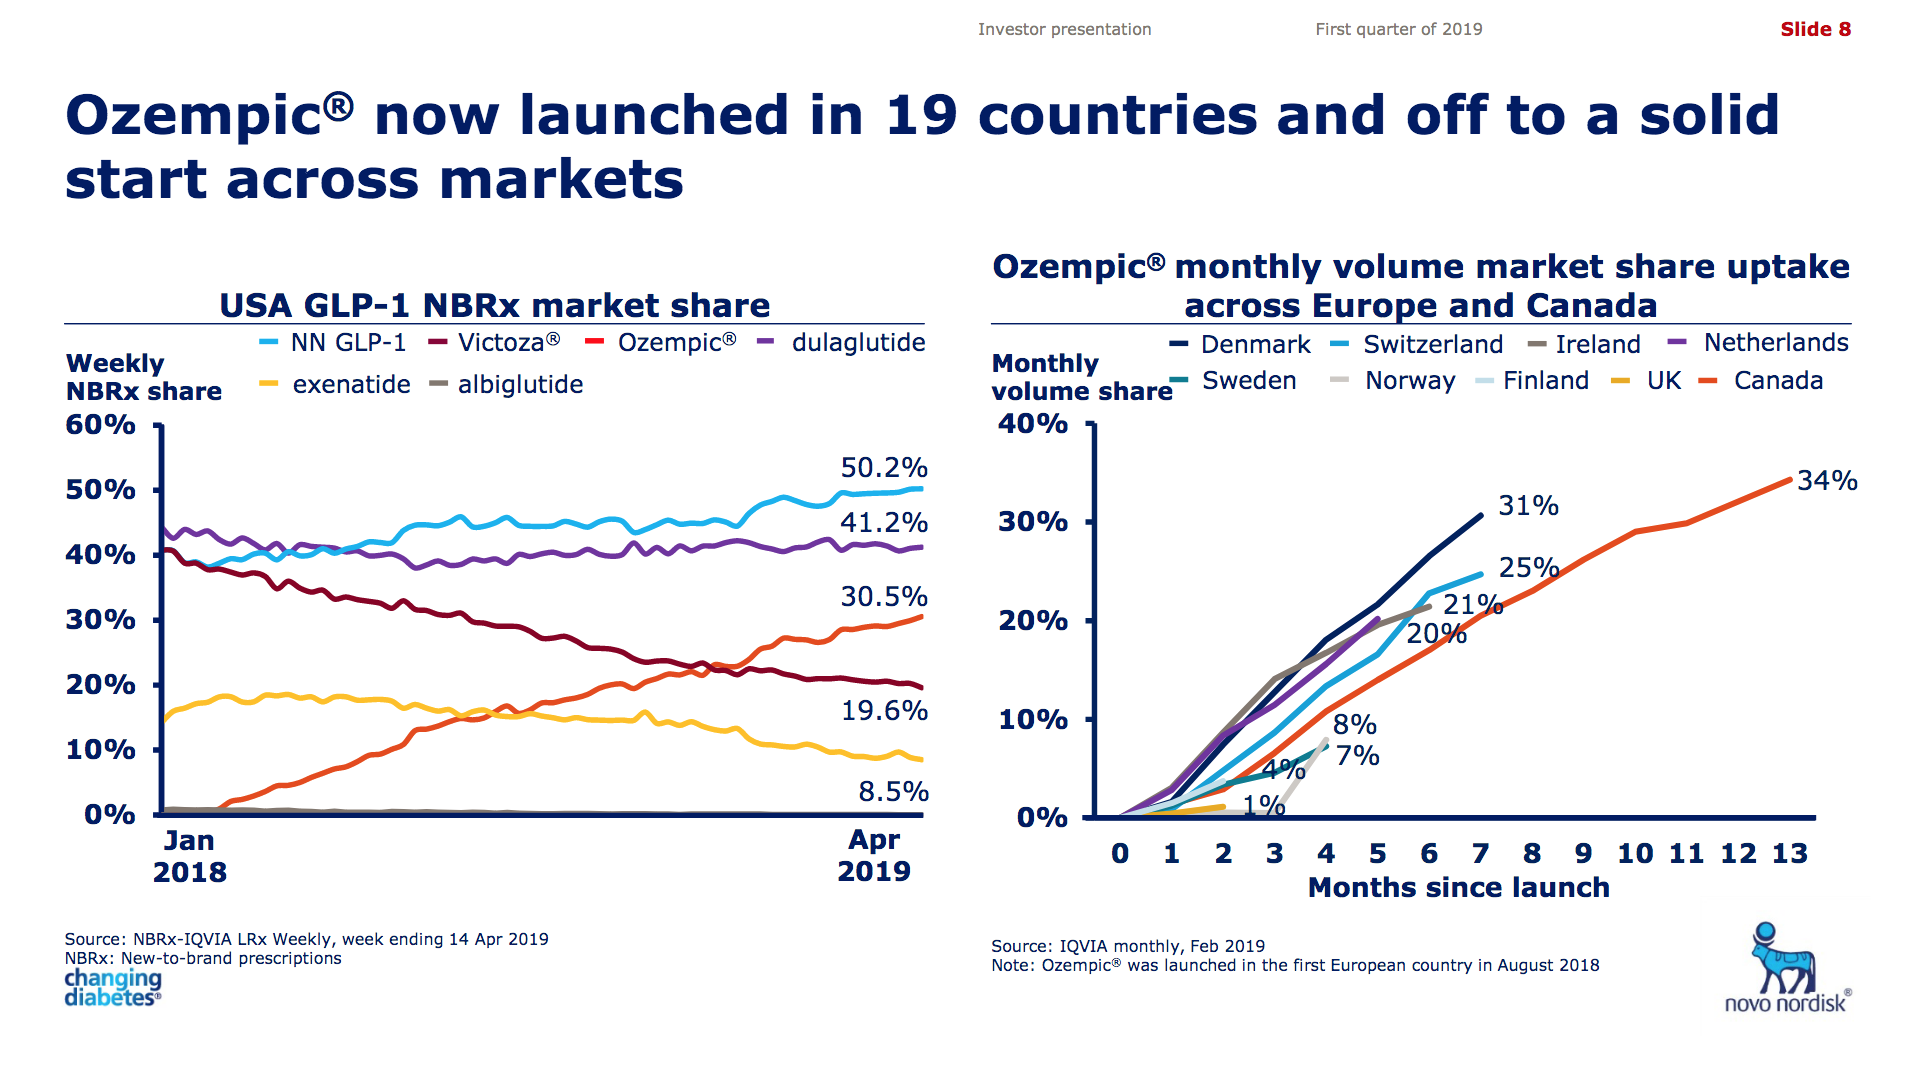
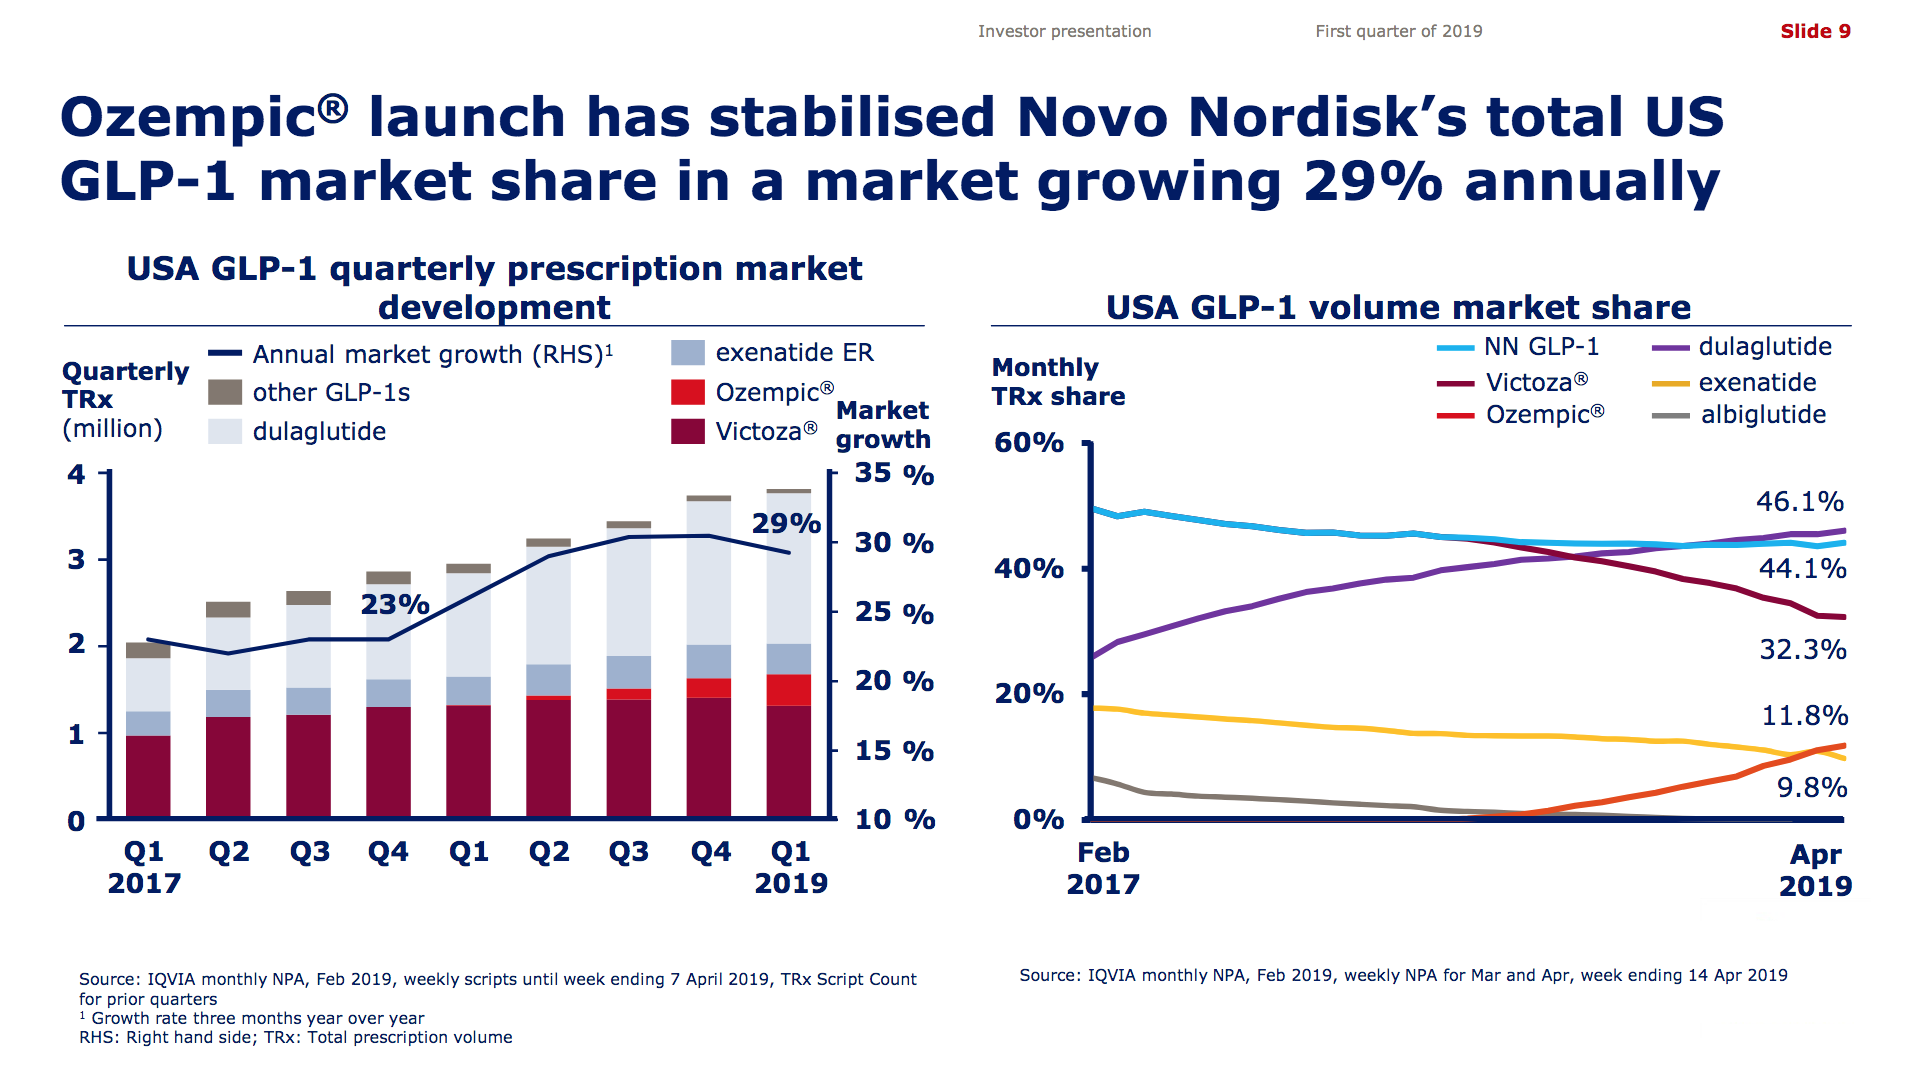
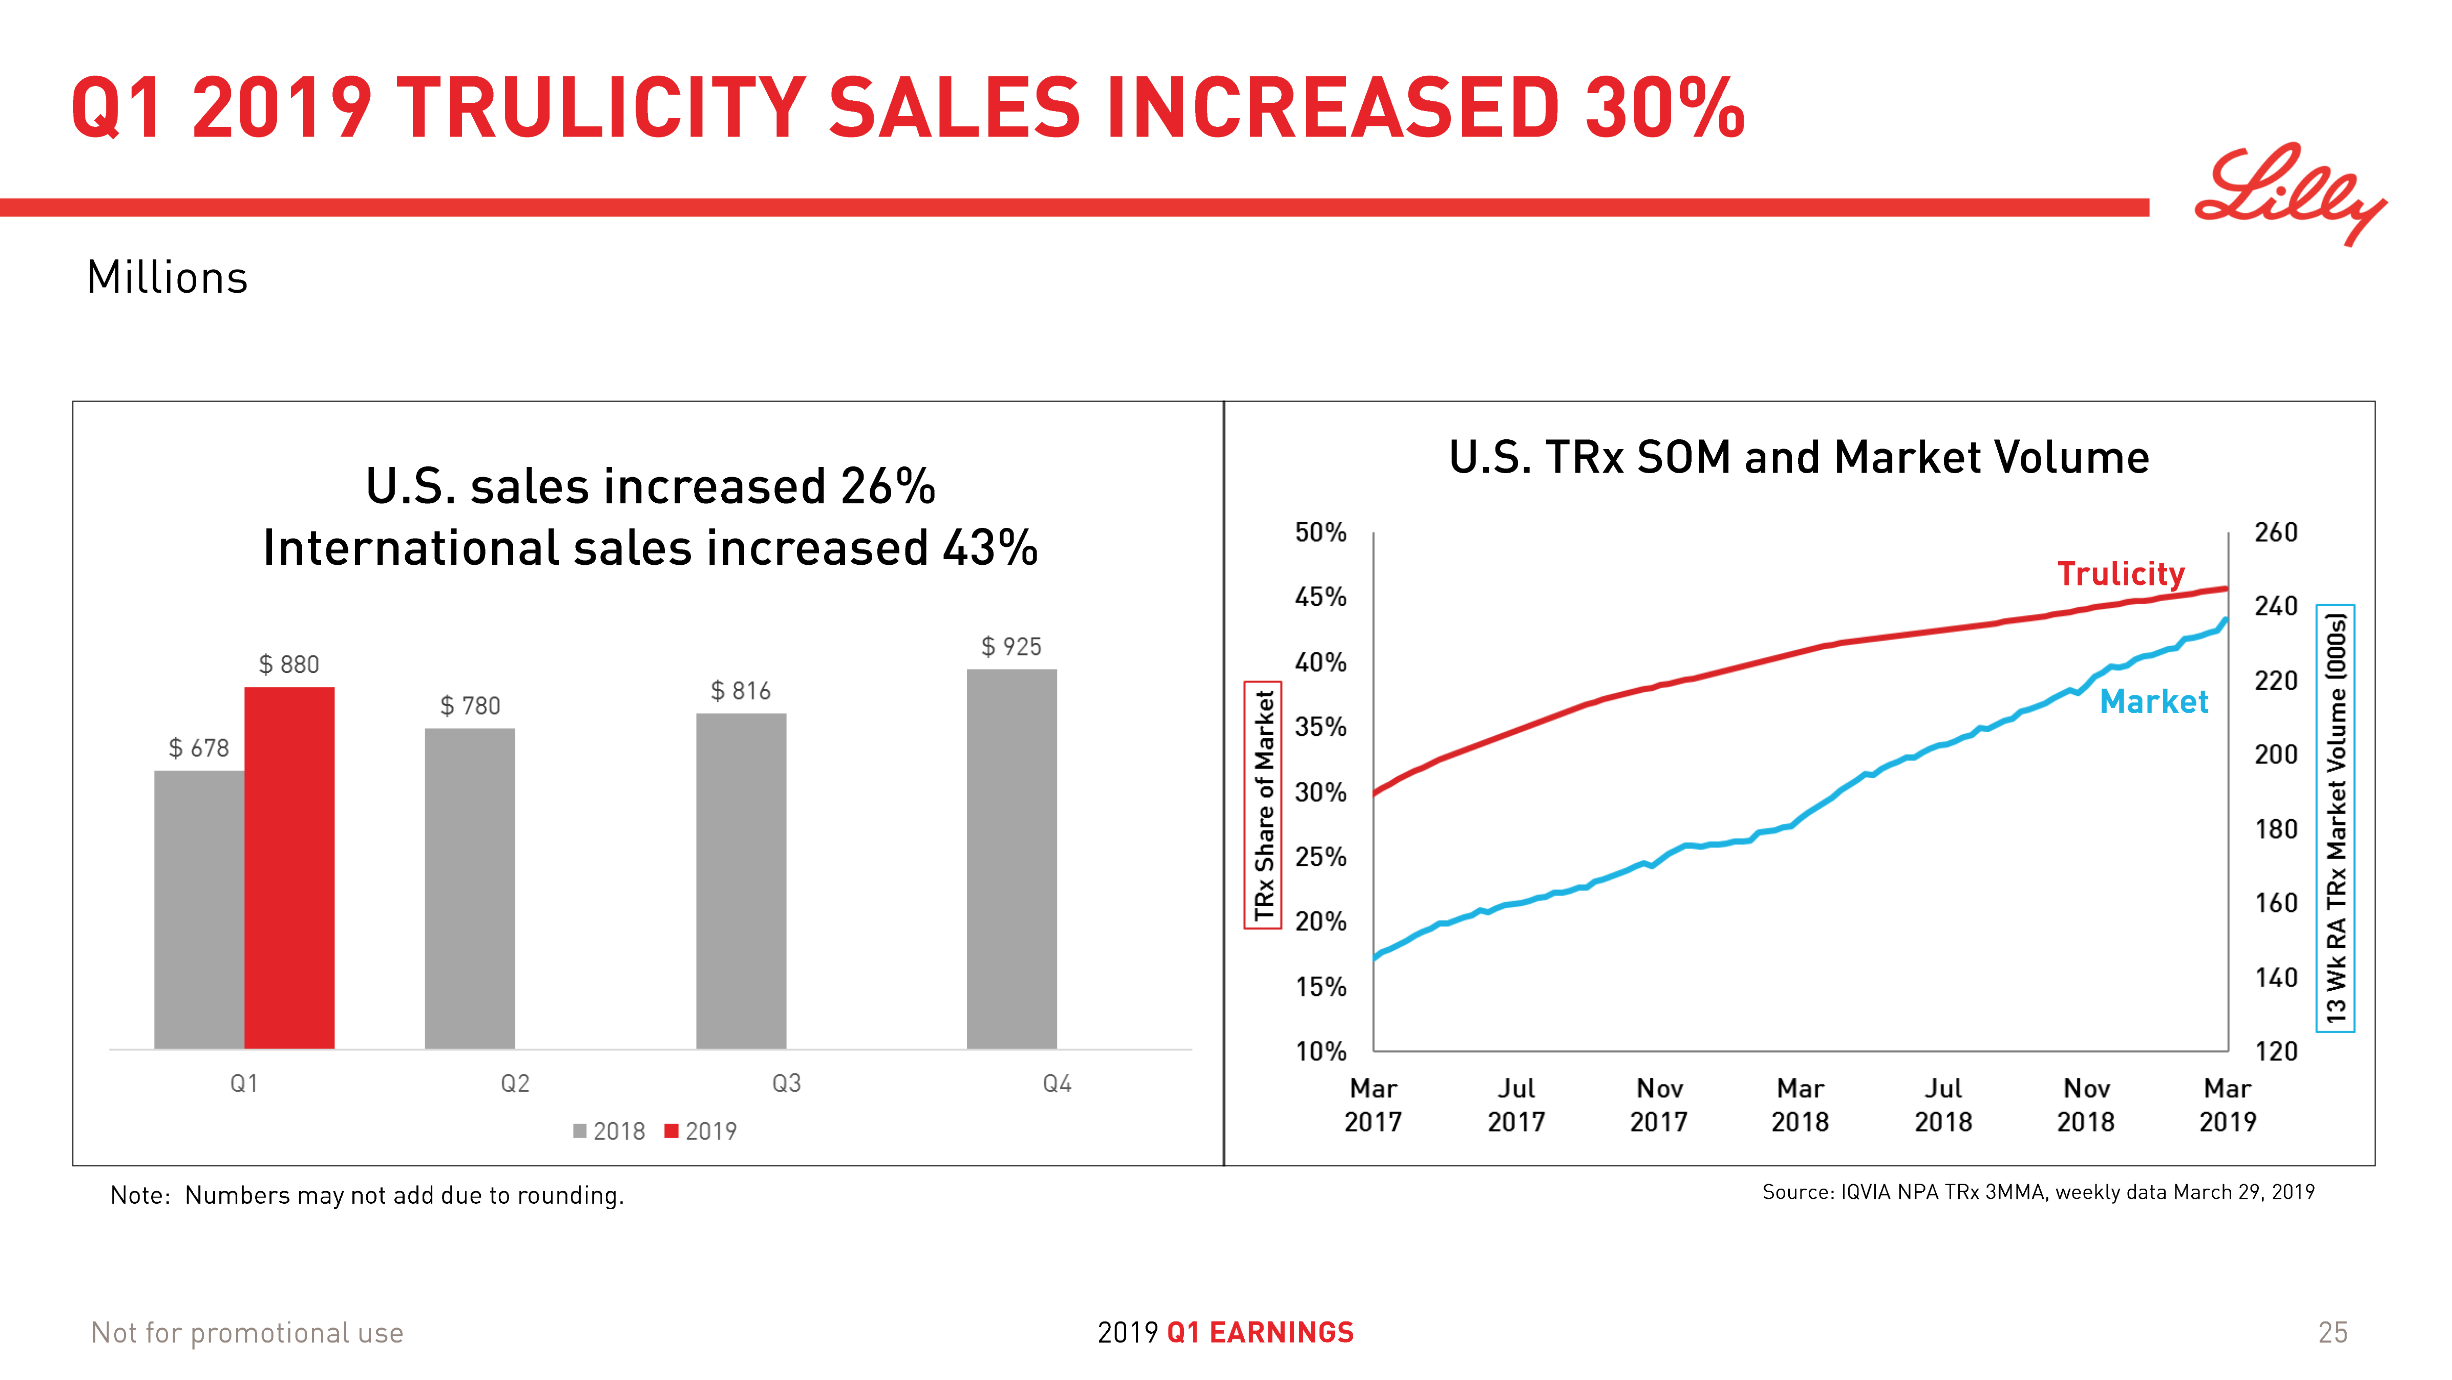
Victoza® (daily injection GLP1R agonist liraglutide) from Novo (-18% YoY in the US) is competing with the weekly injection GLP1R agonists Trulicity® from Lilly (+26% YoY and -9% QoQ in the US) and in particular Ozempic® from Novo itself (+41% QoQ in the US).
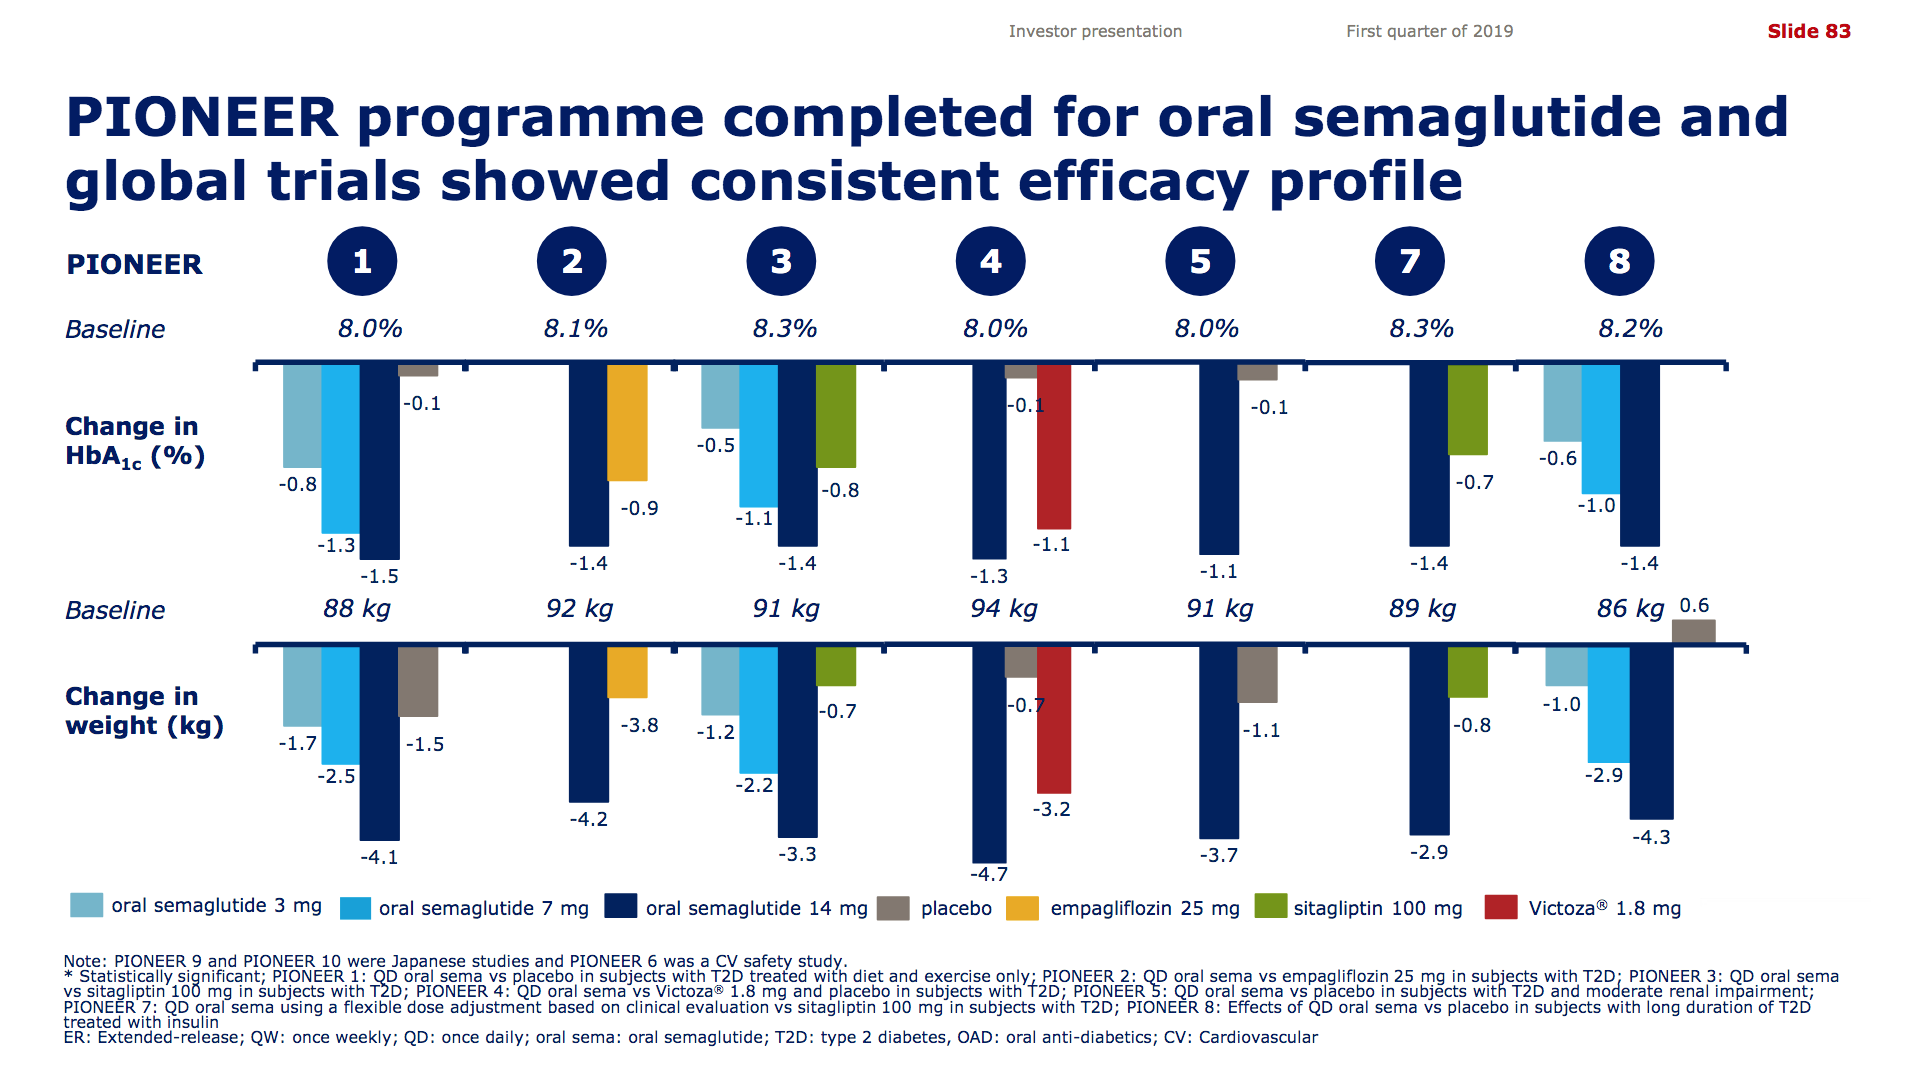
It is not unreasonable to expect GLP1 to further gain value share of the total diabetes market going forward given the expected approval of oral semaglutide following the PIONEER studies and the expiration of patents on insulins Lantus®, Levemir® and Humalog®.
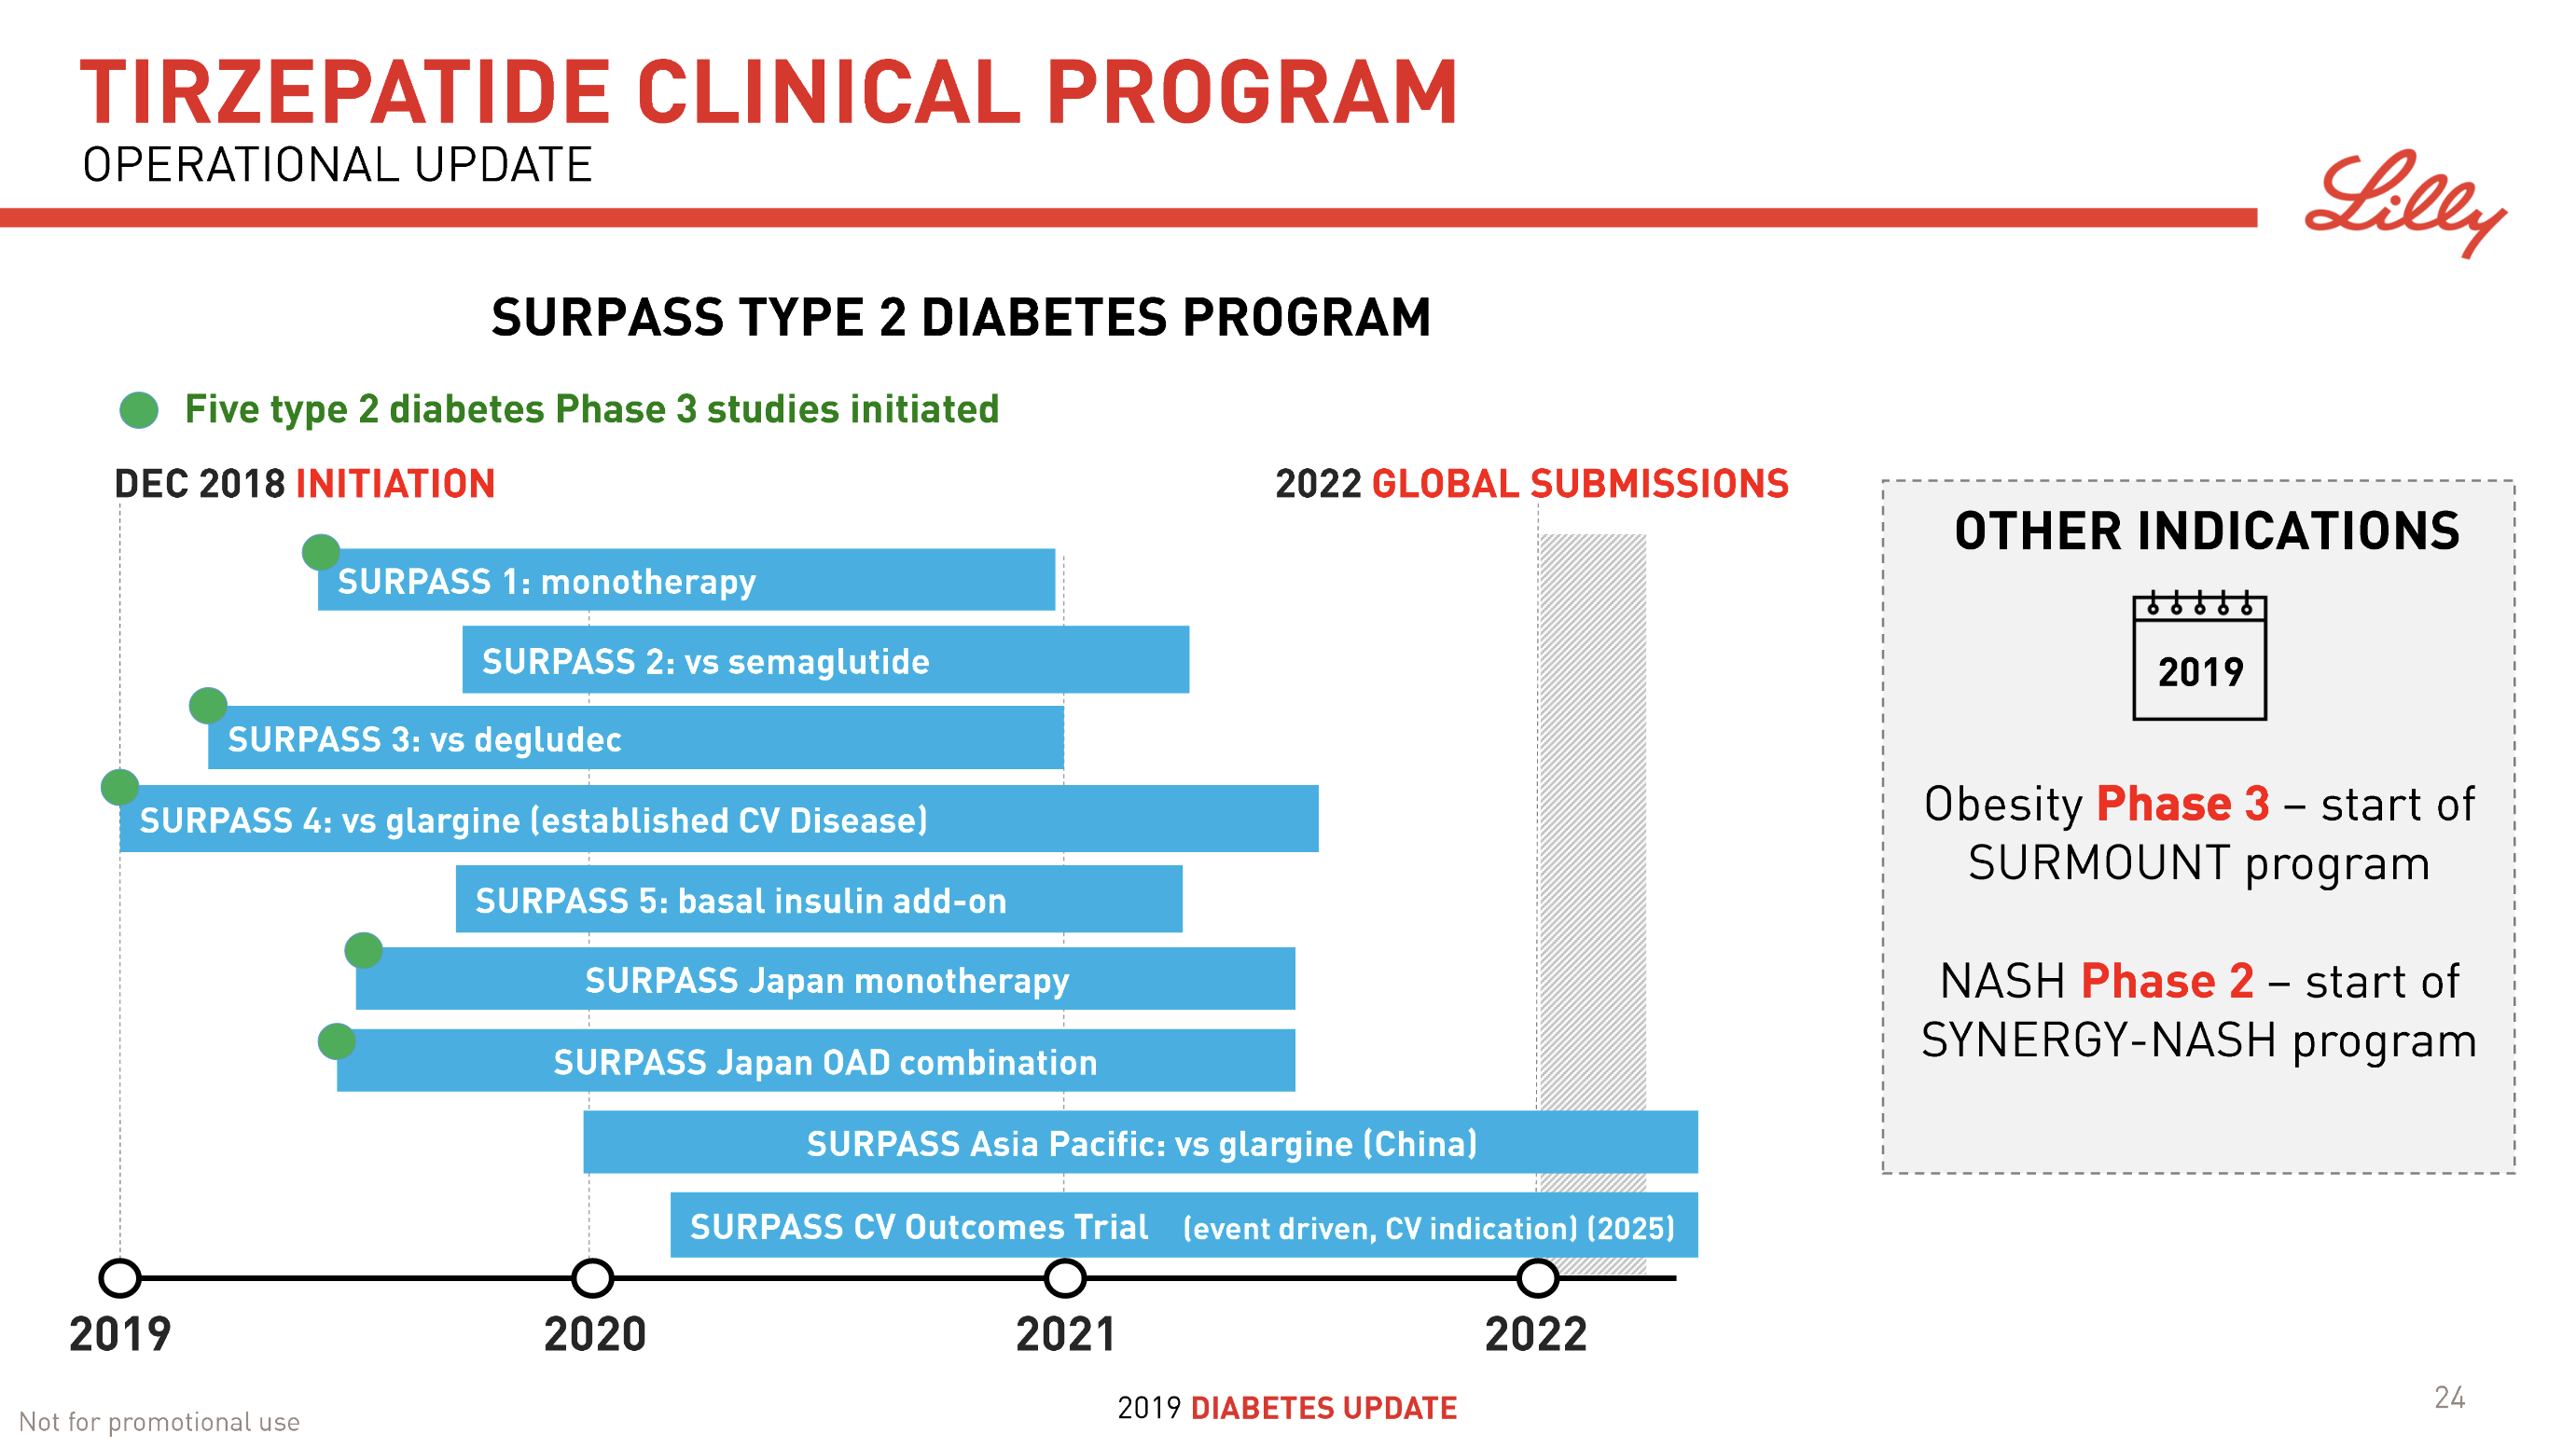
The dual agonist Tirzepatide (LY3298176) for the treatment of diabetes has progressed to phase 3 and Lilly is currently recruiting for the clinical trials SURPASS-3 (versus insulin degludec – Tresiba®) and SURPASS-4 (versus insulin glargine – Lantus®).
Saxenda® (liraglutide) from Novo has quickly become the best selling anti obesity drug in the world (+47% YoY).
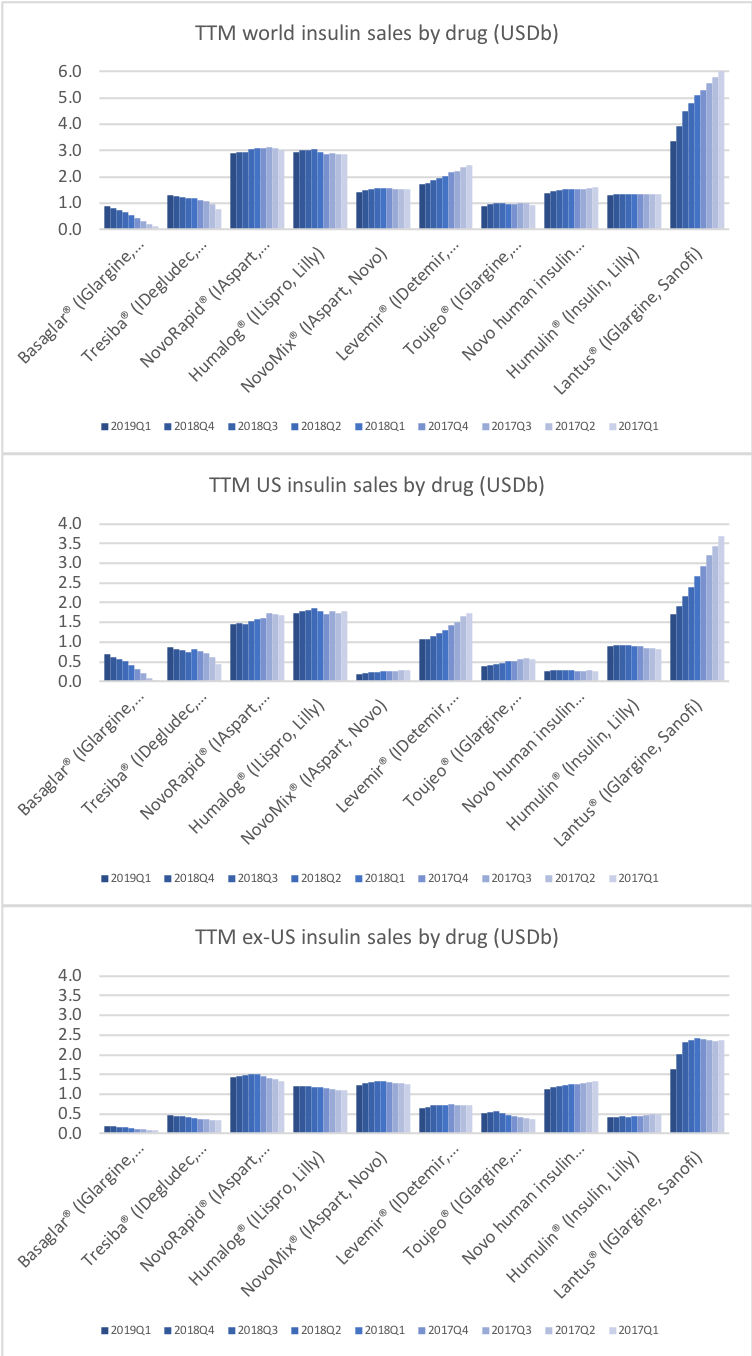
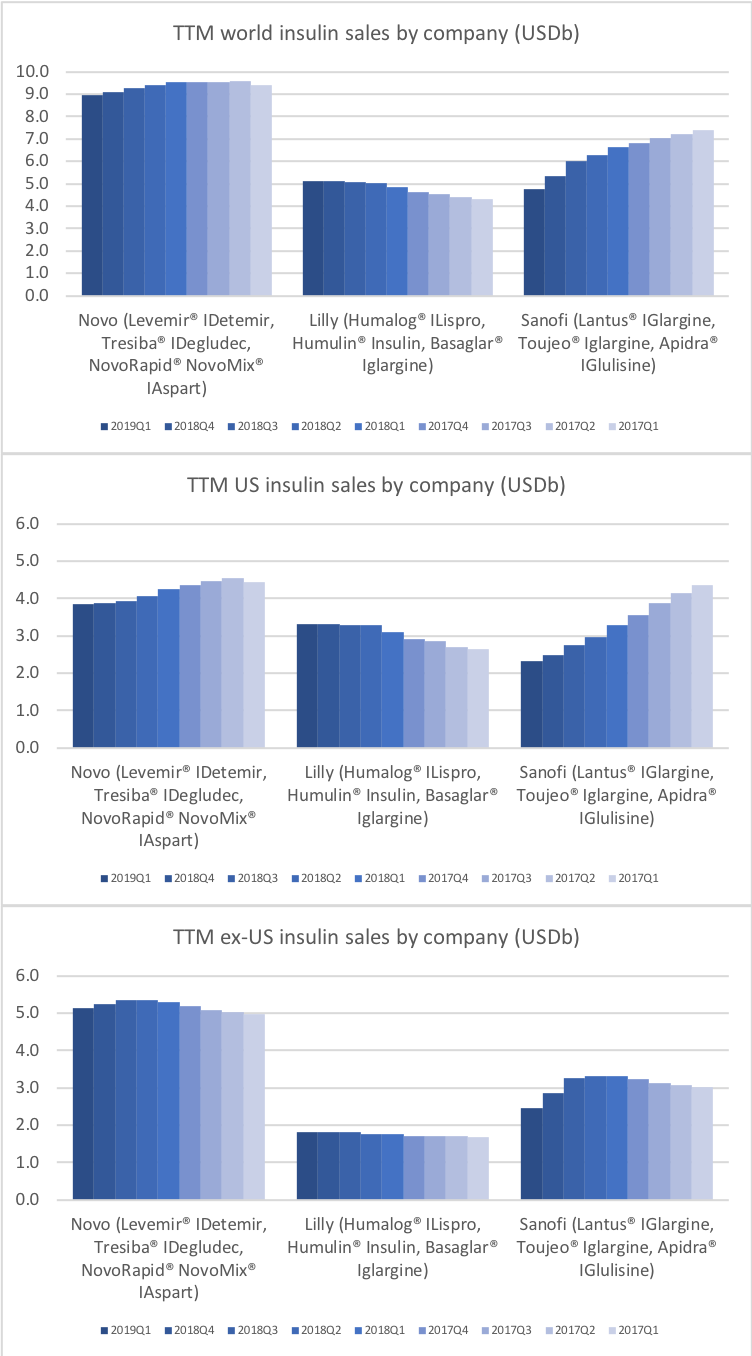
Insulin
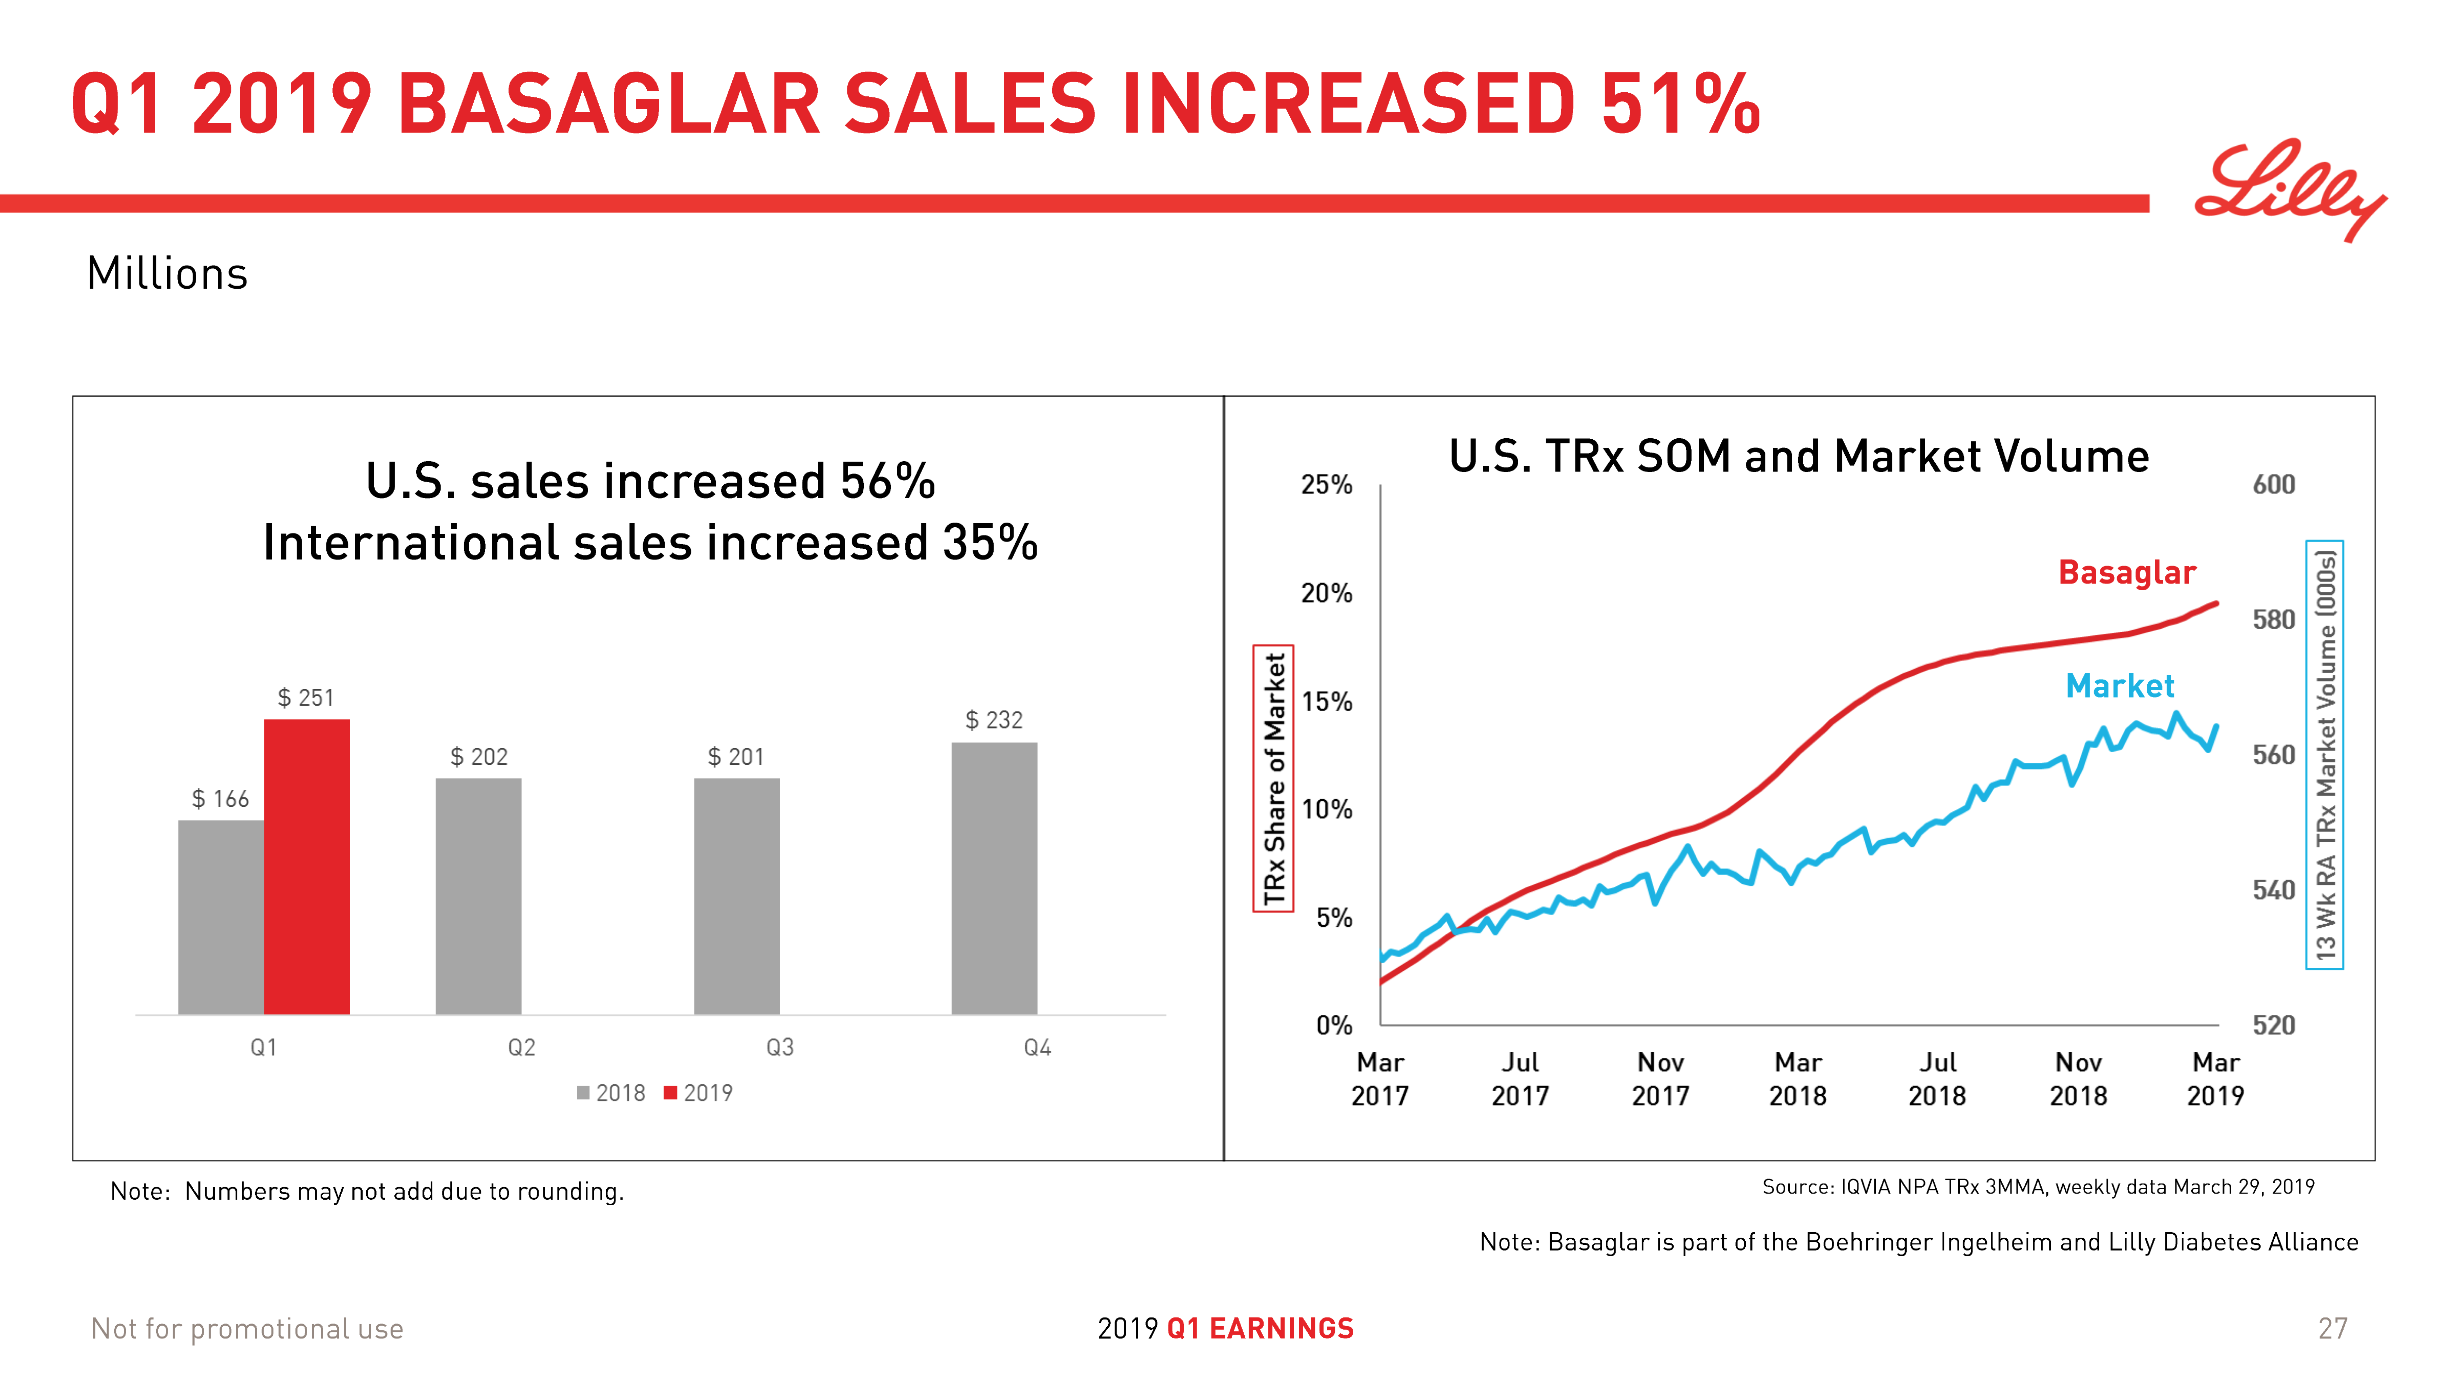
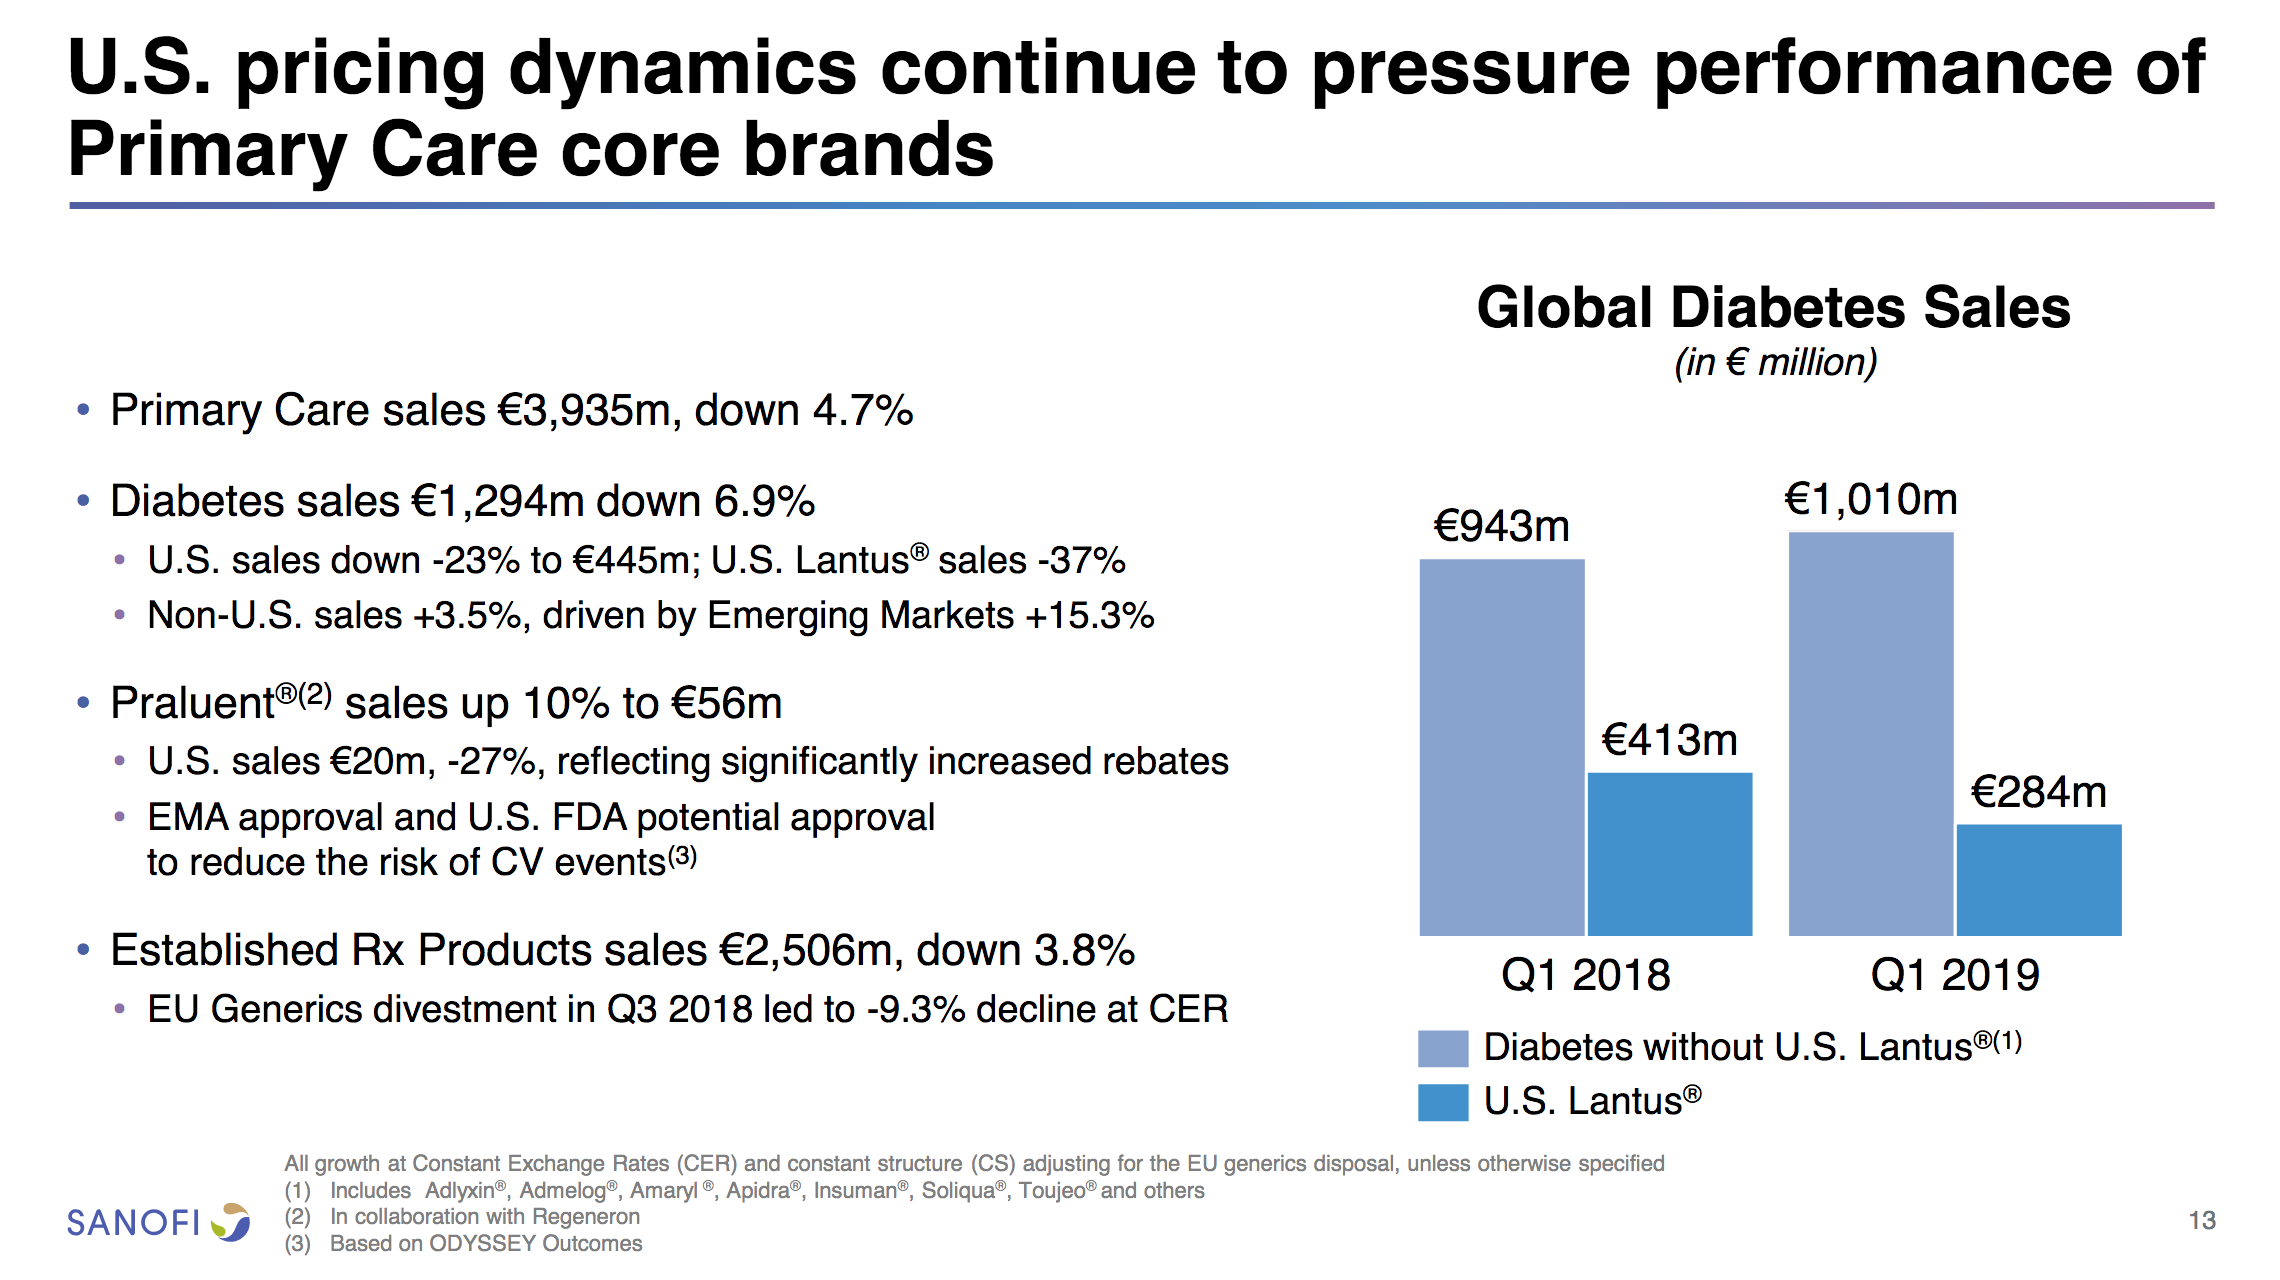
Lantus® (insulin glargine) from Sanofi (-37% YoY in the US) is competing with the biosimilar Basaglar® (+56% YoY in the US) from Lilly.
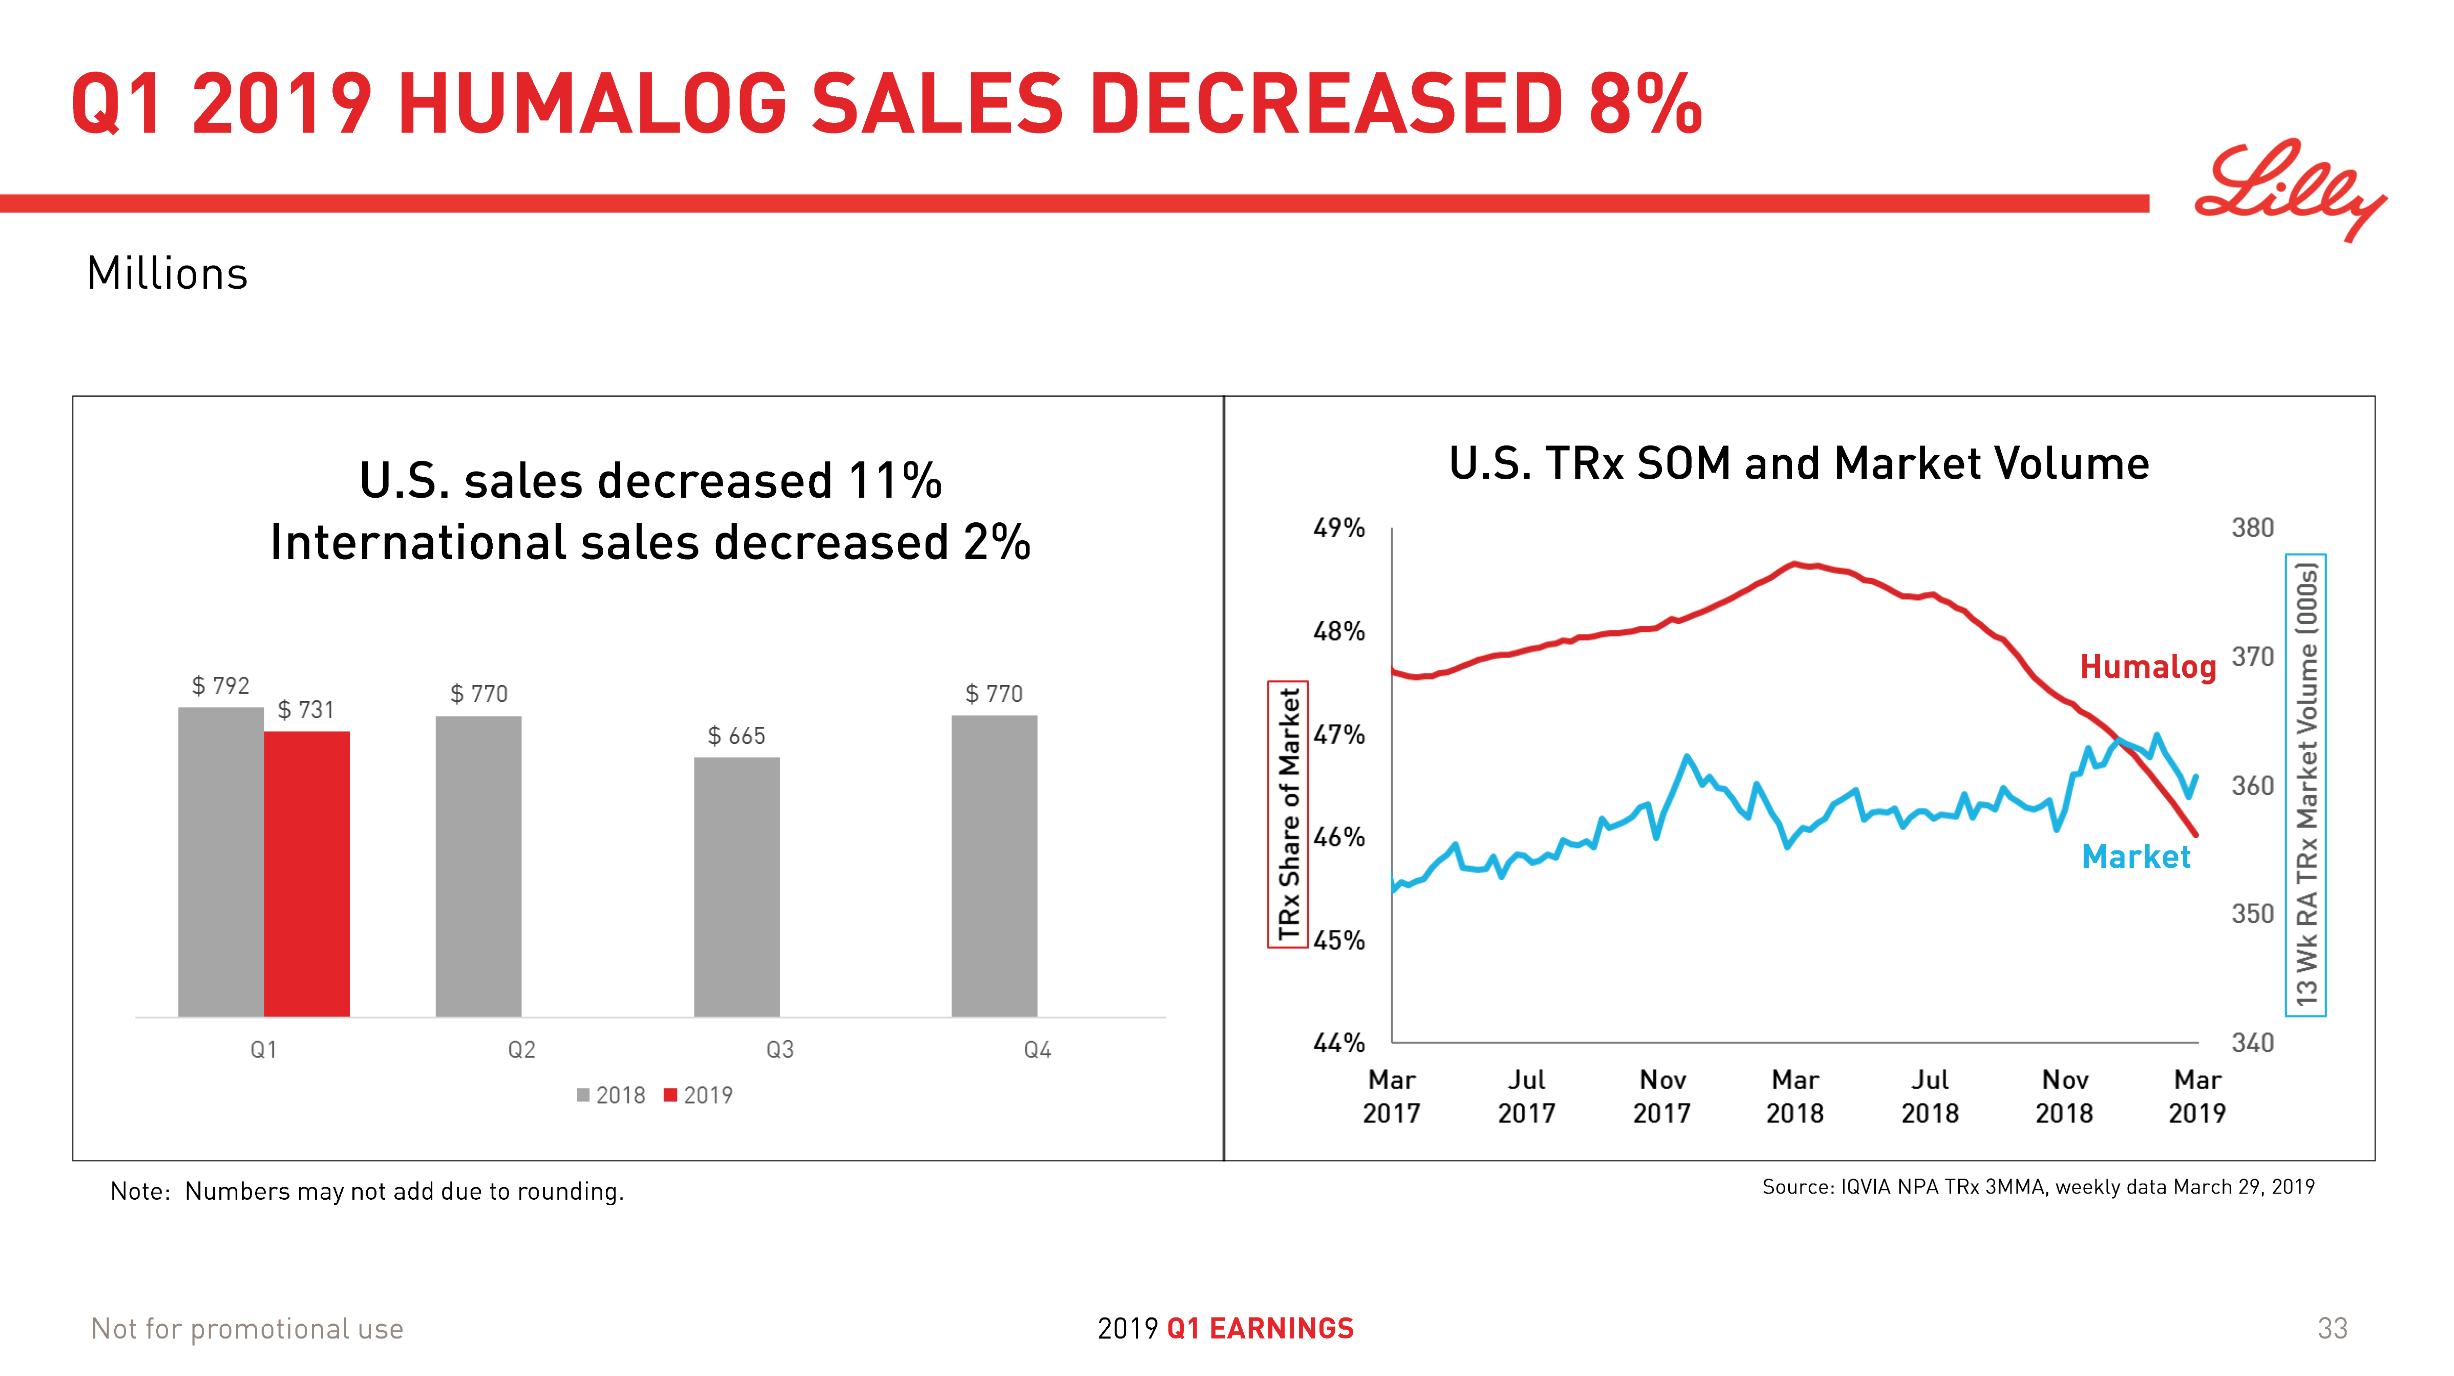
Humalog® from Lilly (-11% YoY in the US) will be competing with the biosimilar Admelog® from Sanofi (+18% QoQ in the US) and the recently launched generically labeled insulin lispro at half price from Lilly itself.
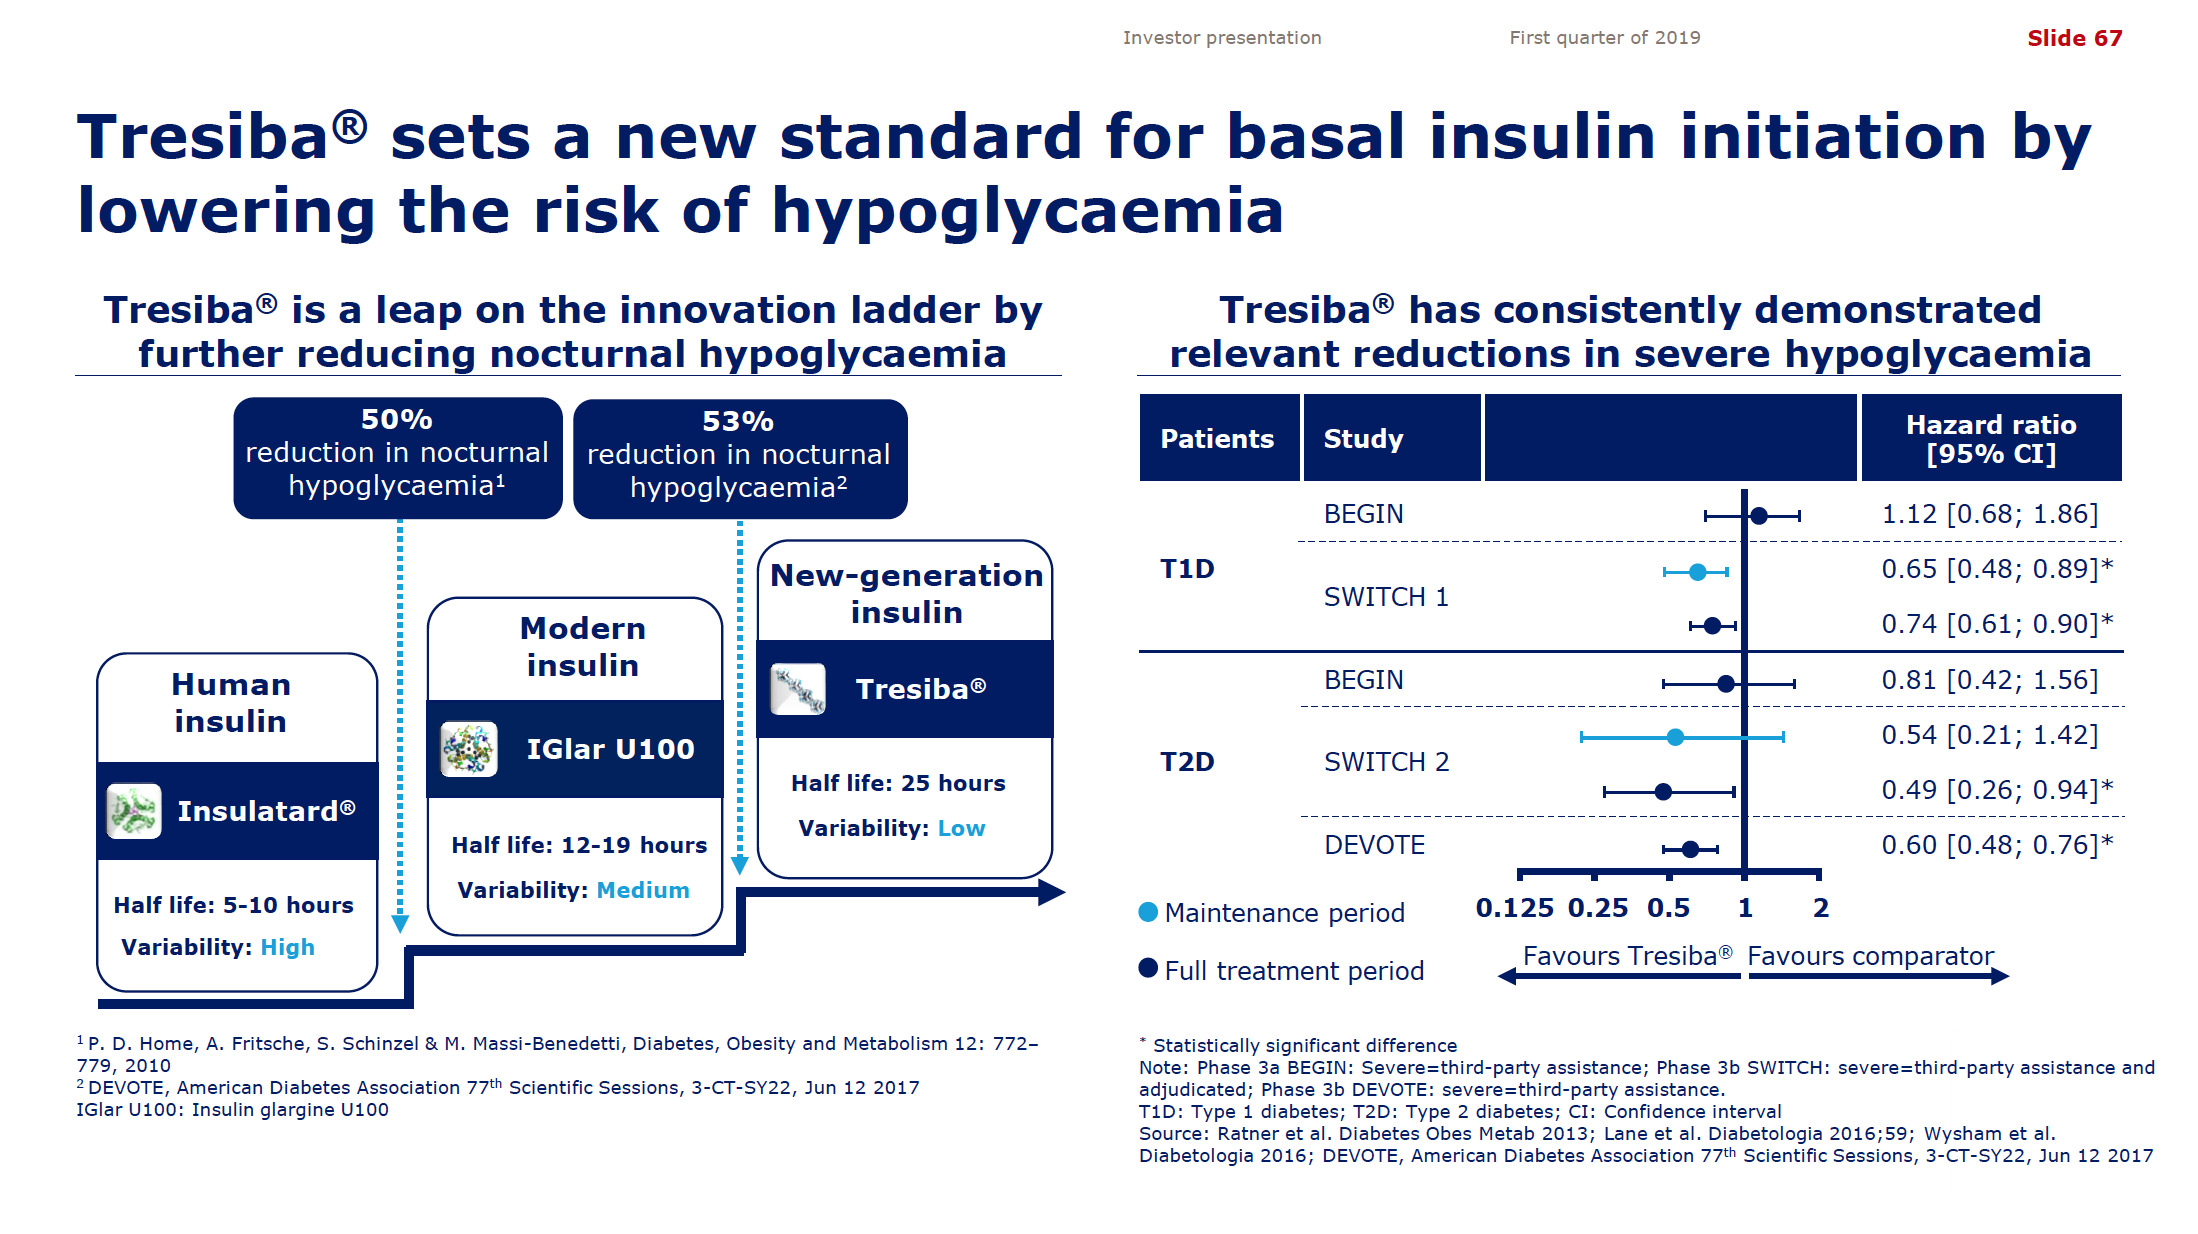
Despite the price pressure on insulin, Tresiba® from Novo displayed positive growth (+21% YoY and +5% YoY in the US). The ultralong-acting daily injected Tresiba® (insulin degludec) reduces the risk of hypoglycaemia.
But despite the growth from Tresiba® Novo experienced negative growth in the insuling segment because of NovoMix® (-20% YoY), NovoRapid® (-6% YoY), Levemir® (-8% YoY) and human insulin (-17% YoY). Furthermore Levemir® faces patent expiration in 2019. Sanofi experienced negative growth because of Lantus® (-37% YoY in the US), whereas Lilly experienced positive growth because of their biosimilar Basaglar® (+56% YoY in the US).
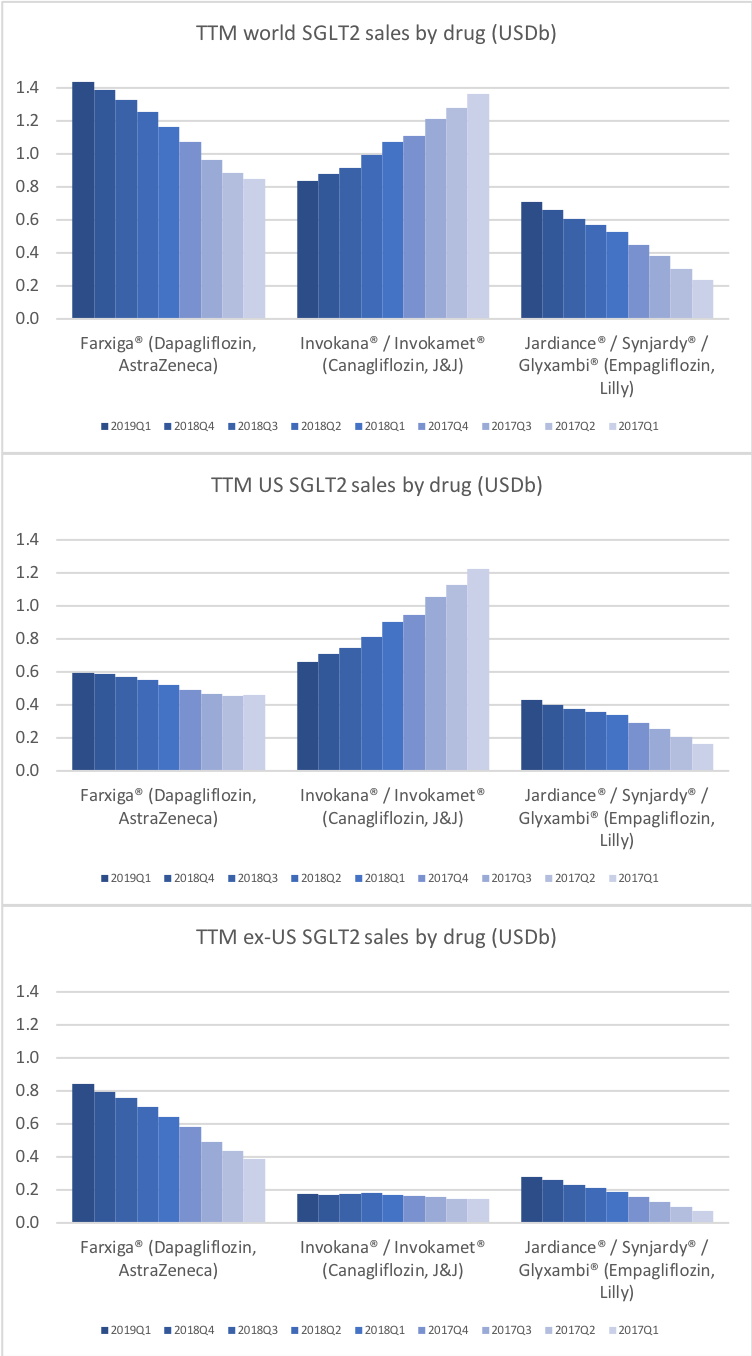
SGLT2 ihbitors (gliflozins)
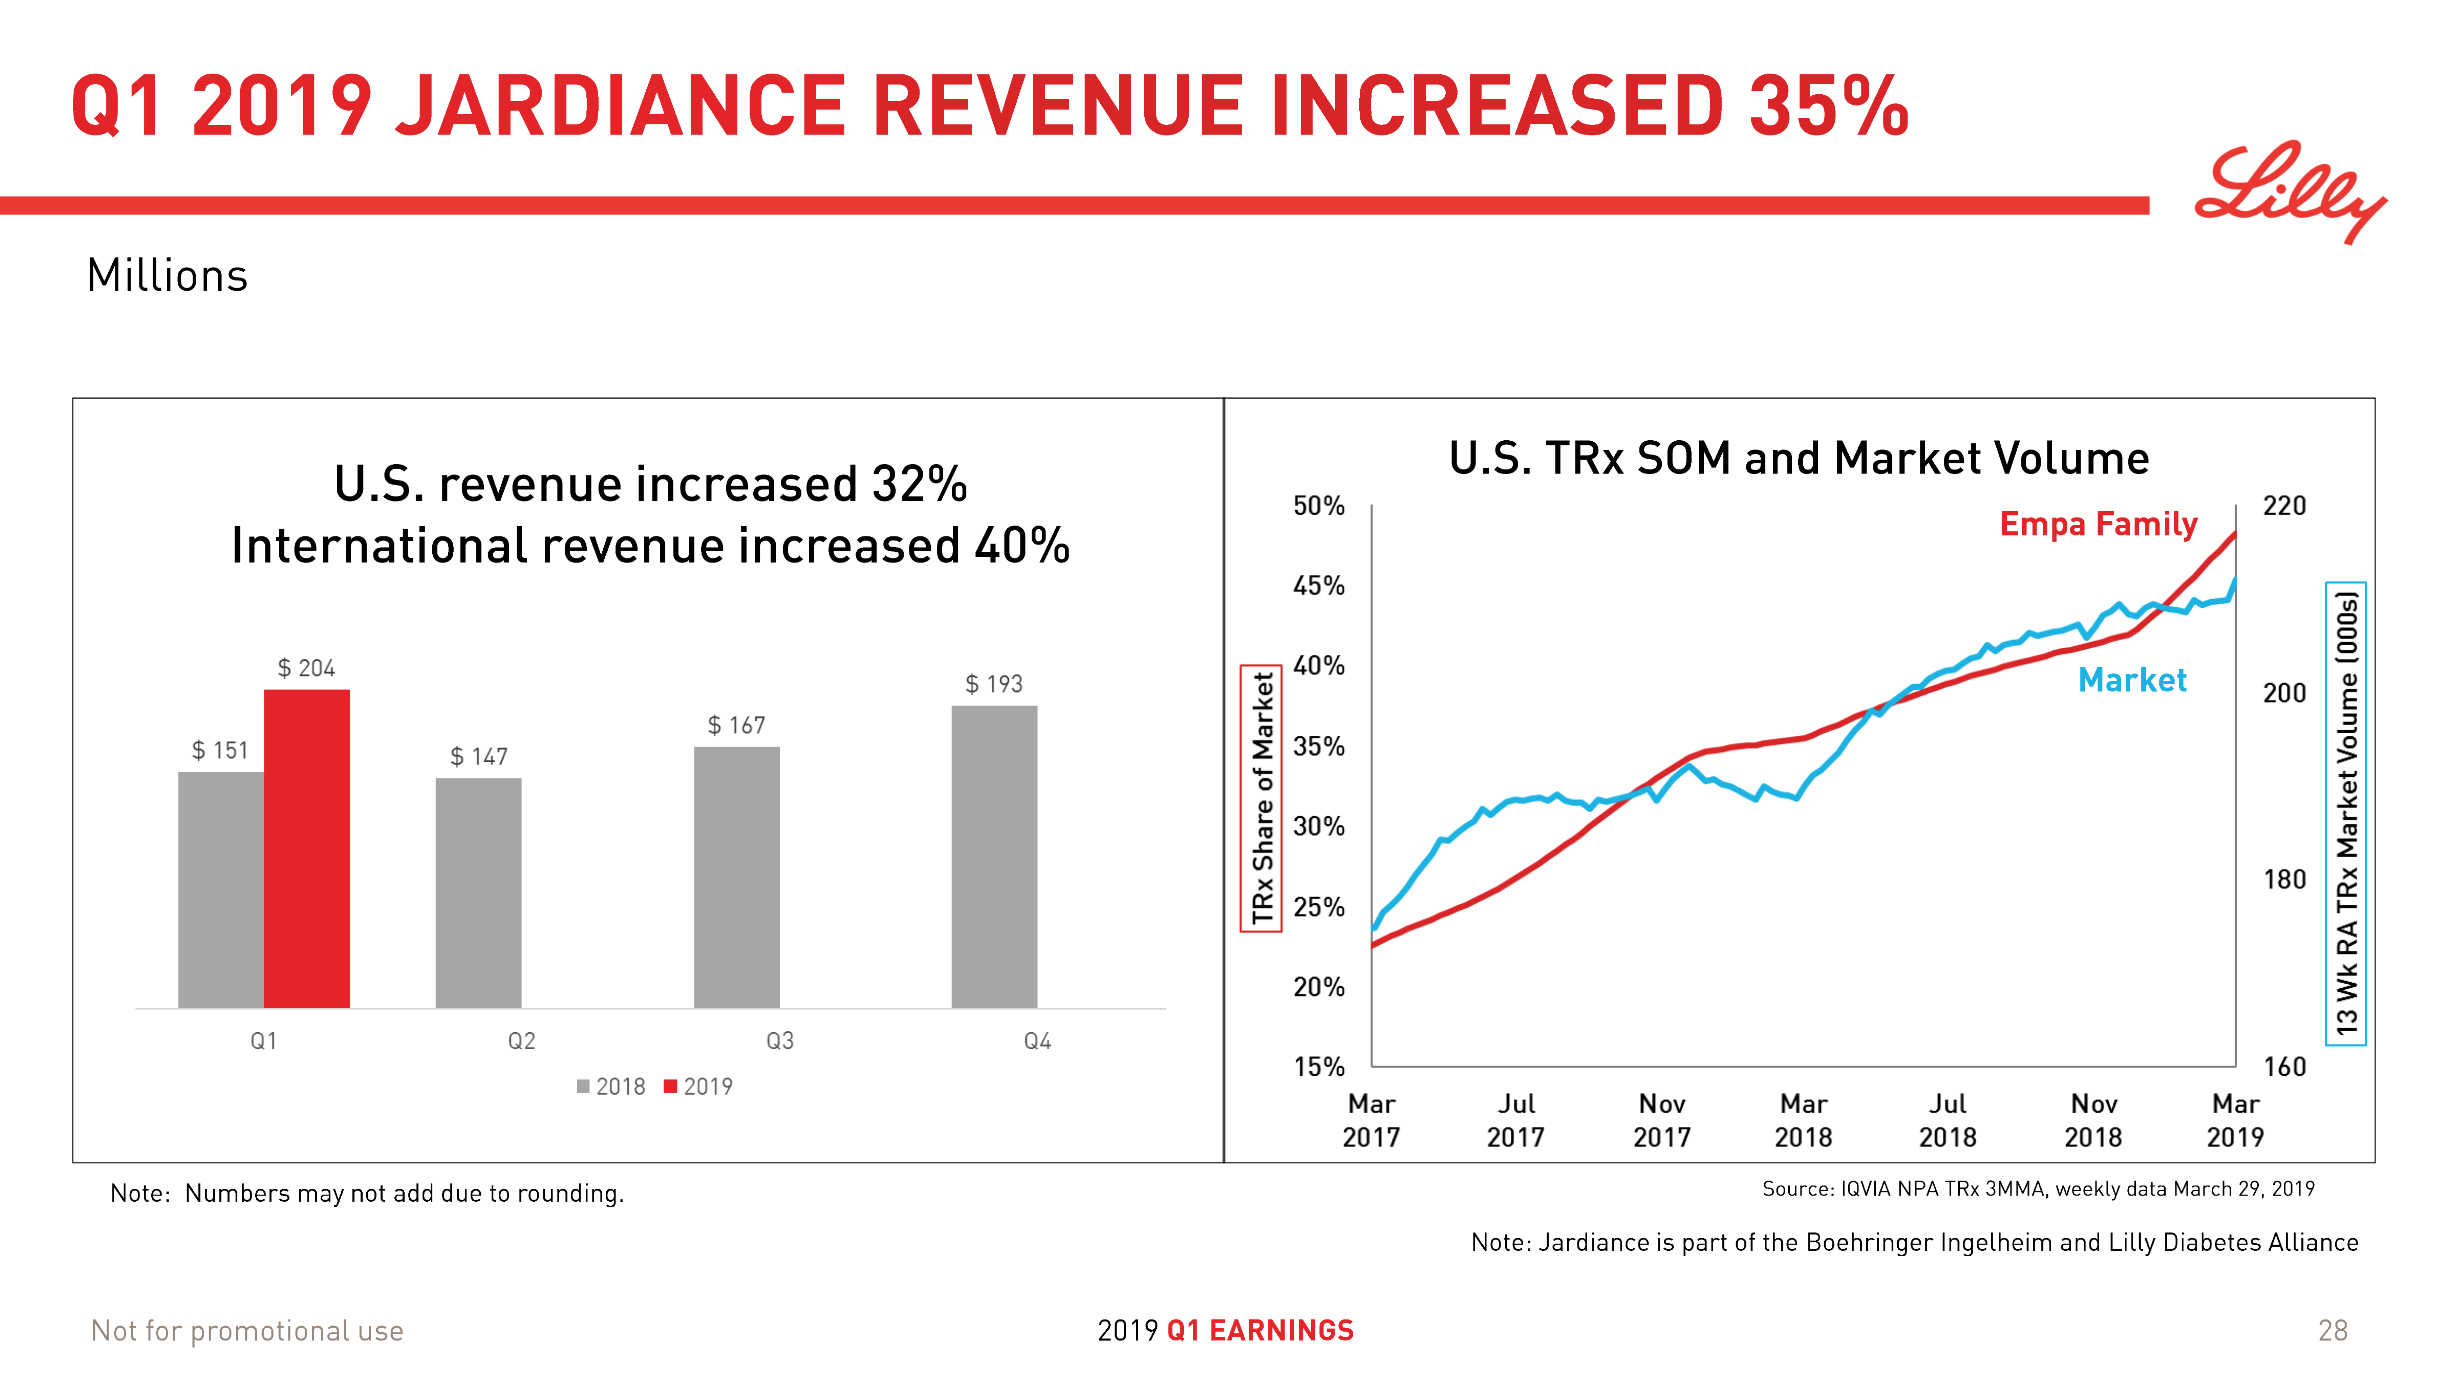
The SGLT2 inhibitors however have side effects that oral semaglutide does not have. But Farxiga from Astra and Jardiance® experiences growth (+17% and +35% YoY respectively) while FDA approval of oral semaglutide is pending.
DPP4 inhibitors (gliptins)
Boehringer Ingelheim and Lillyannounced in February, that the CAROLINA cardiovascular outcome trial of Trajenta® met its primary endpoint of non-inferiority compared with glimepiride.
Merck wrote in their earnings press release, that sales of Januvia®/Janumet® “declined slightly due to continuing pricing pressure in the United States, which more than offset strong demand from international markets.”
Below are headlines from the press following the earnings releases: Bloomberg: Eli Lilly CEO on 1Q Results, Drug Pricing, Pharma Margins Reuters: Eli Lilly misses estimates for top-selling diabetes drug Trulicity, shares slip Reuters: Novo Nordisk profit tops forecast as new diabetes drug shines
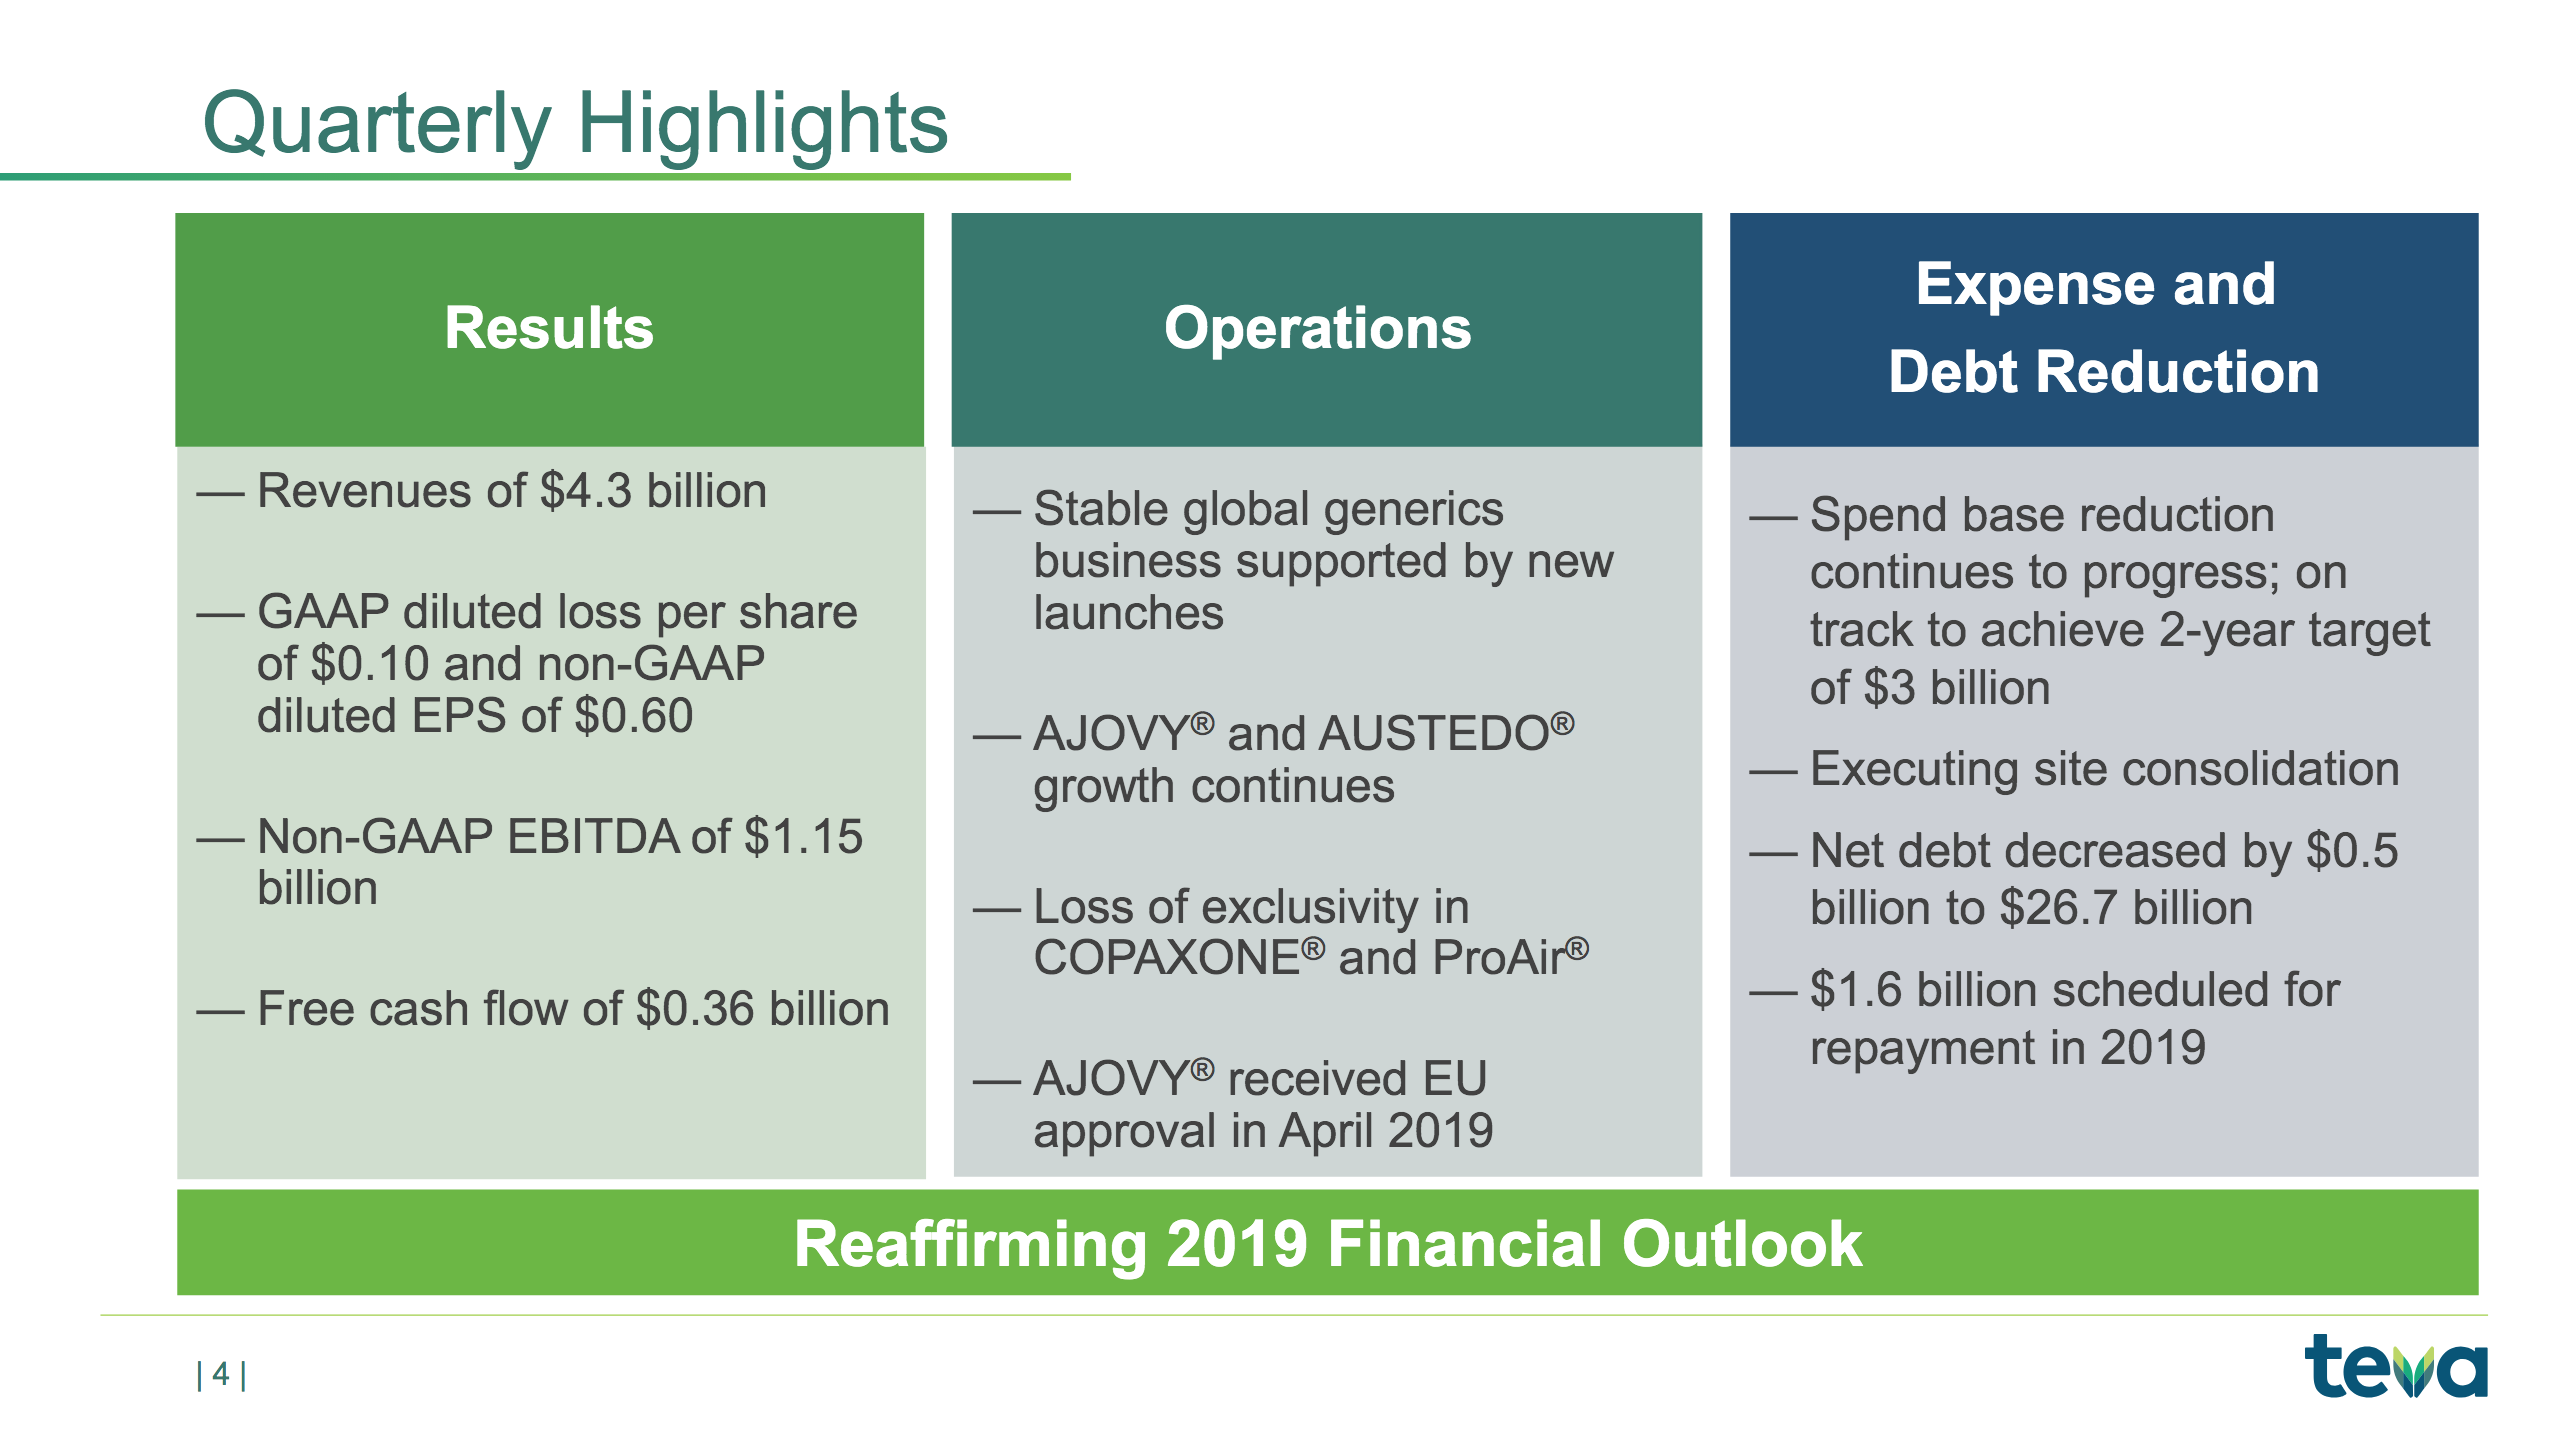
Teva reported on their first quarter results and issued the following press release with the following headlines and statements from the CEO:
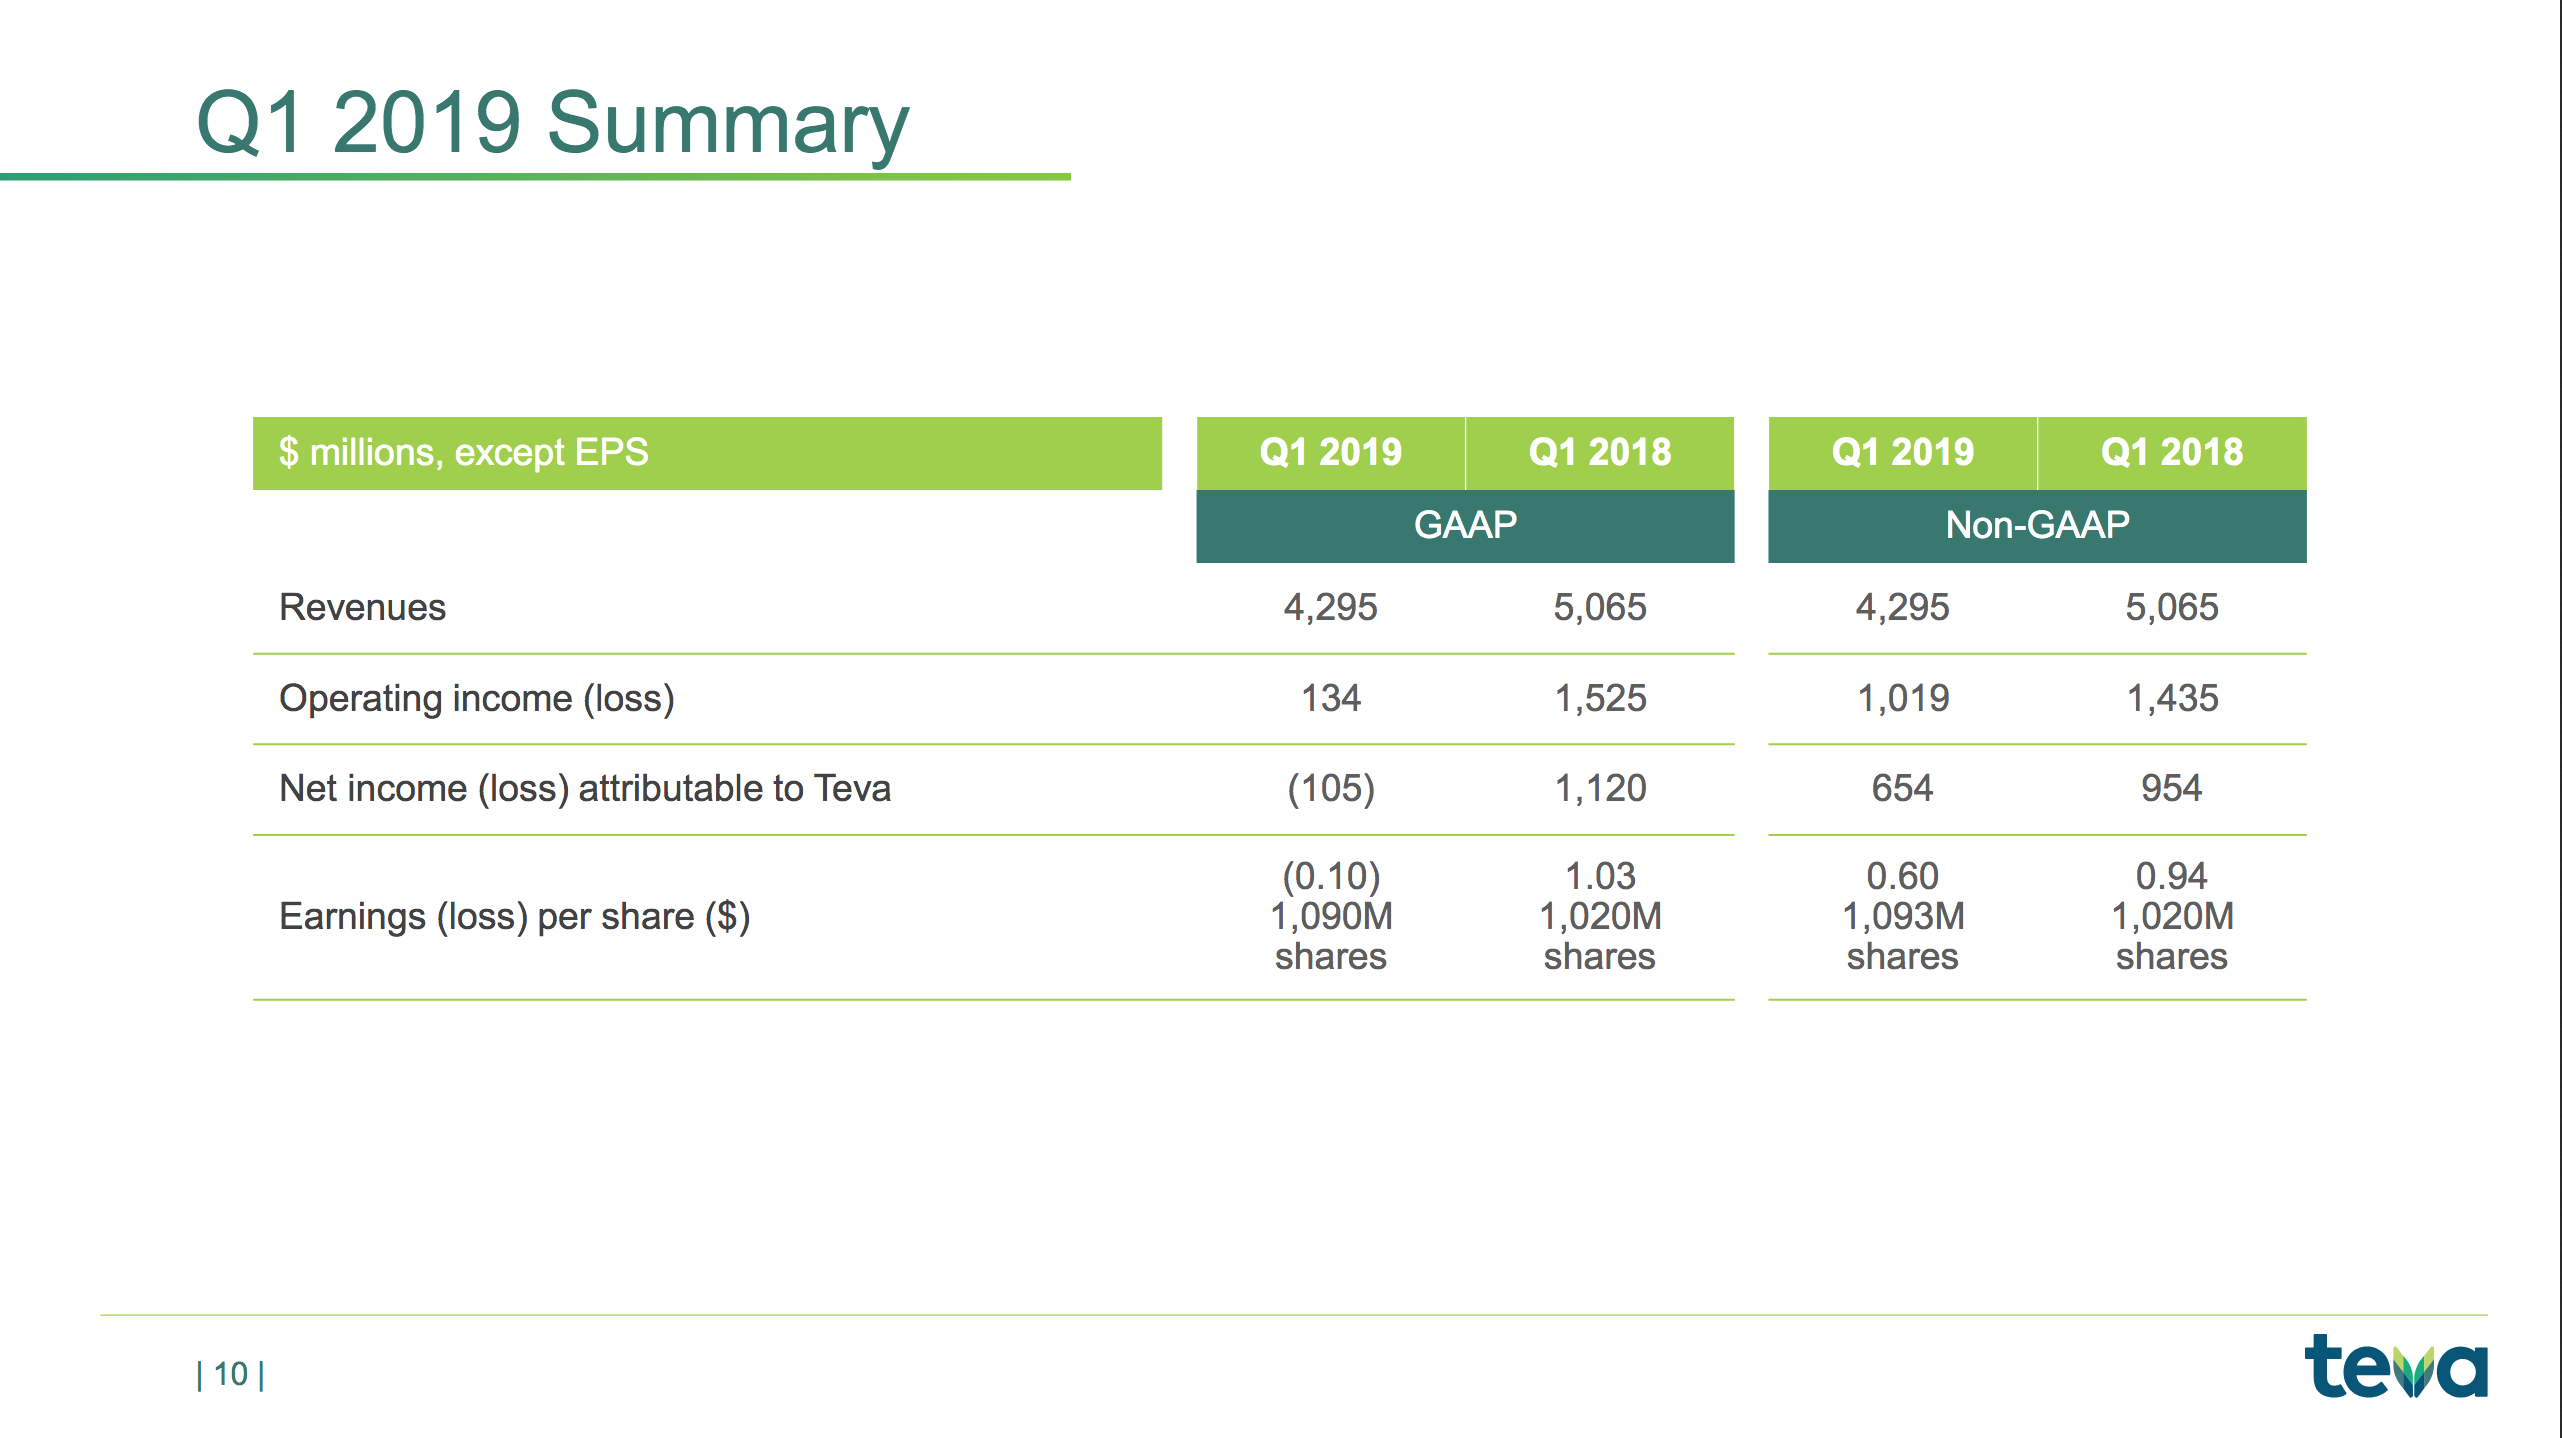
– Revenues of $4.3 billion
– GAAP diluted loss per share of $0.10
– Non-GAAP diluted EPS of $0.60
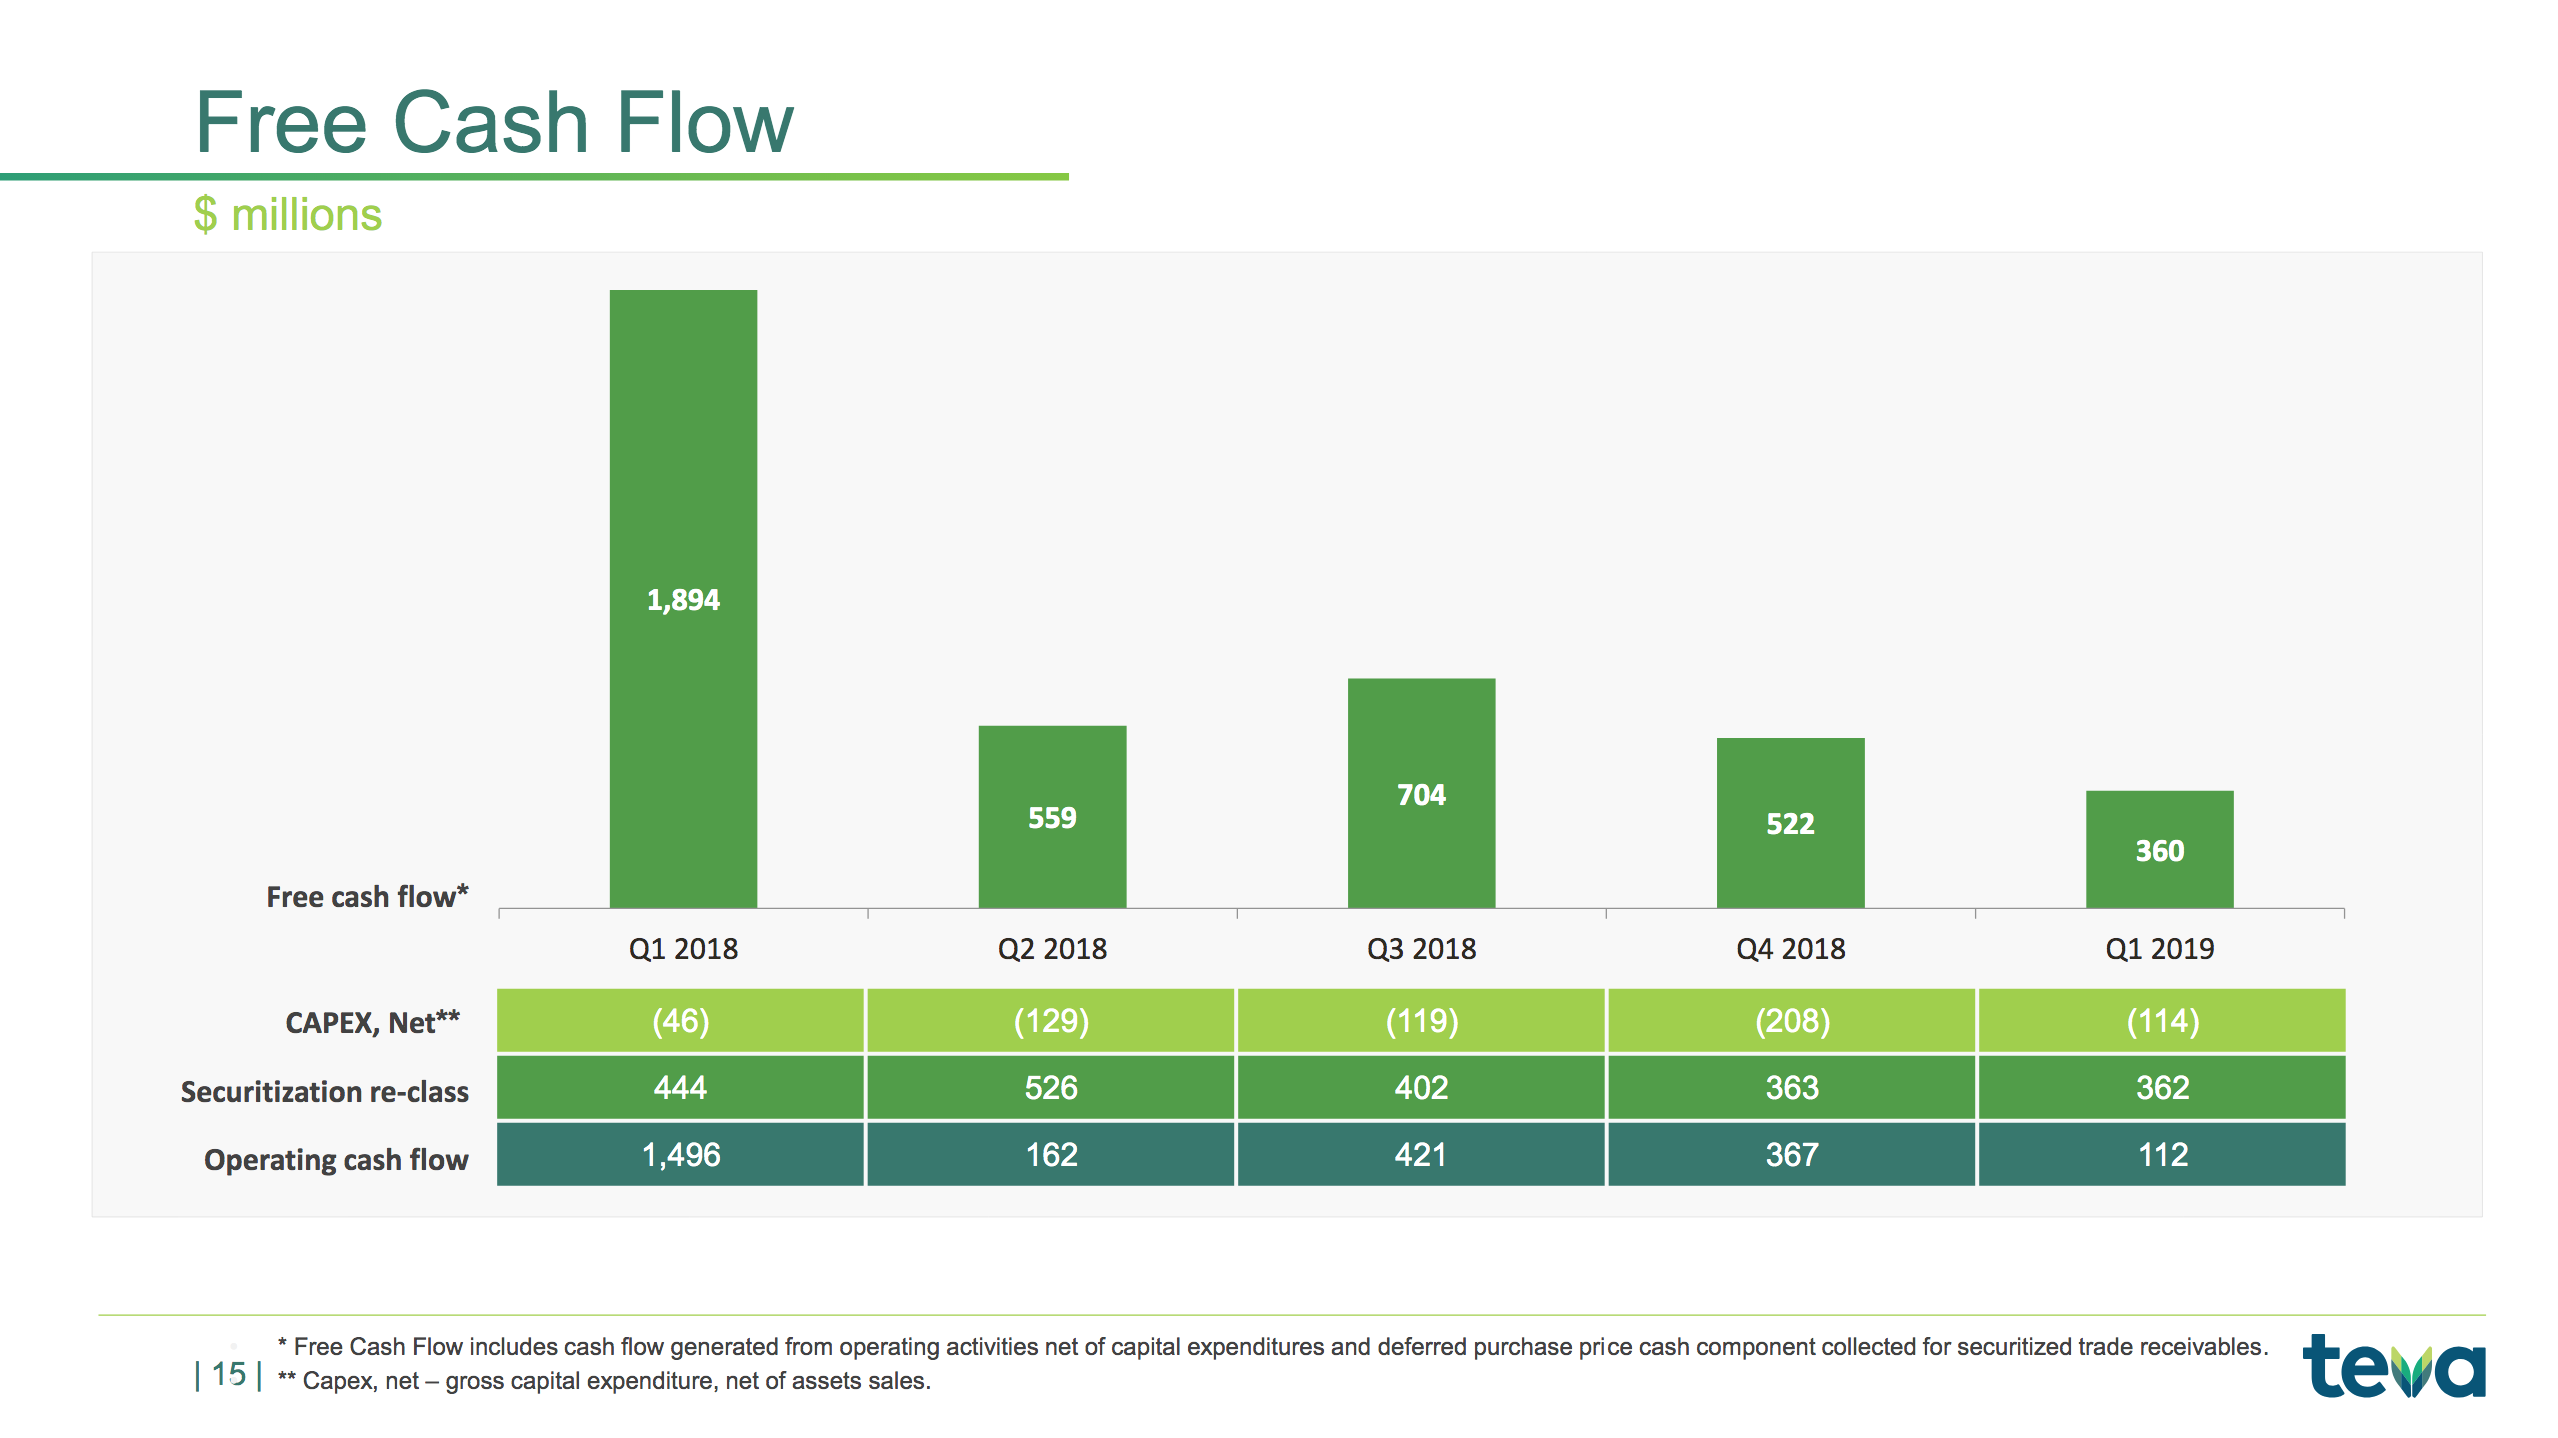
– Free cash flow of $360 million
– Spend base reduction of $2.5 billion since initiation of the – restructuring plan in 2018; on-track to achieve $3.0 billion by the end of 2019
– Full year 2019 revenues and EPS guidance reaffirmed
Mr. Kåre Schultz, Teva’s President and CEO, said, “The second year of our two-year restructuring program got off to a promising start. We are on track to reduce our total cost base by $3 billion by the end of 2019 and we have achieved a reduction of $2.5 billion to date, while continuing to lower our debt. “
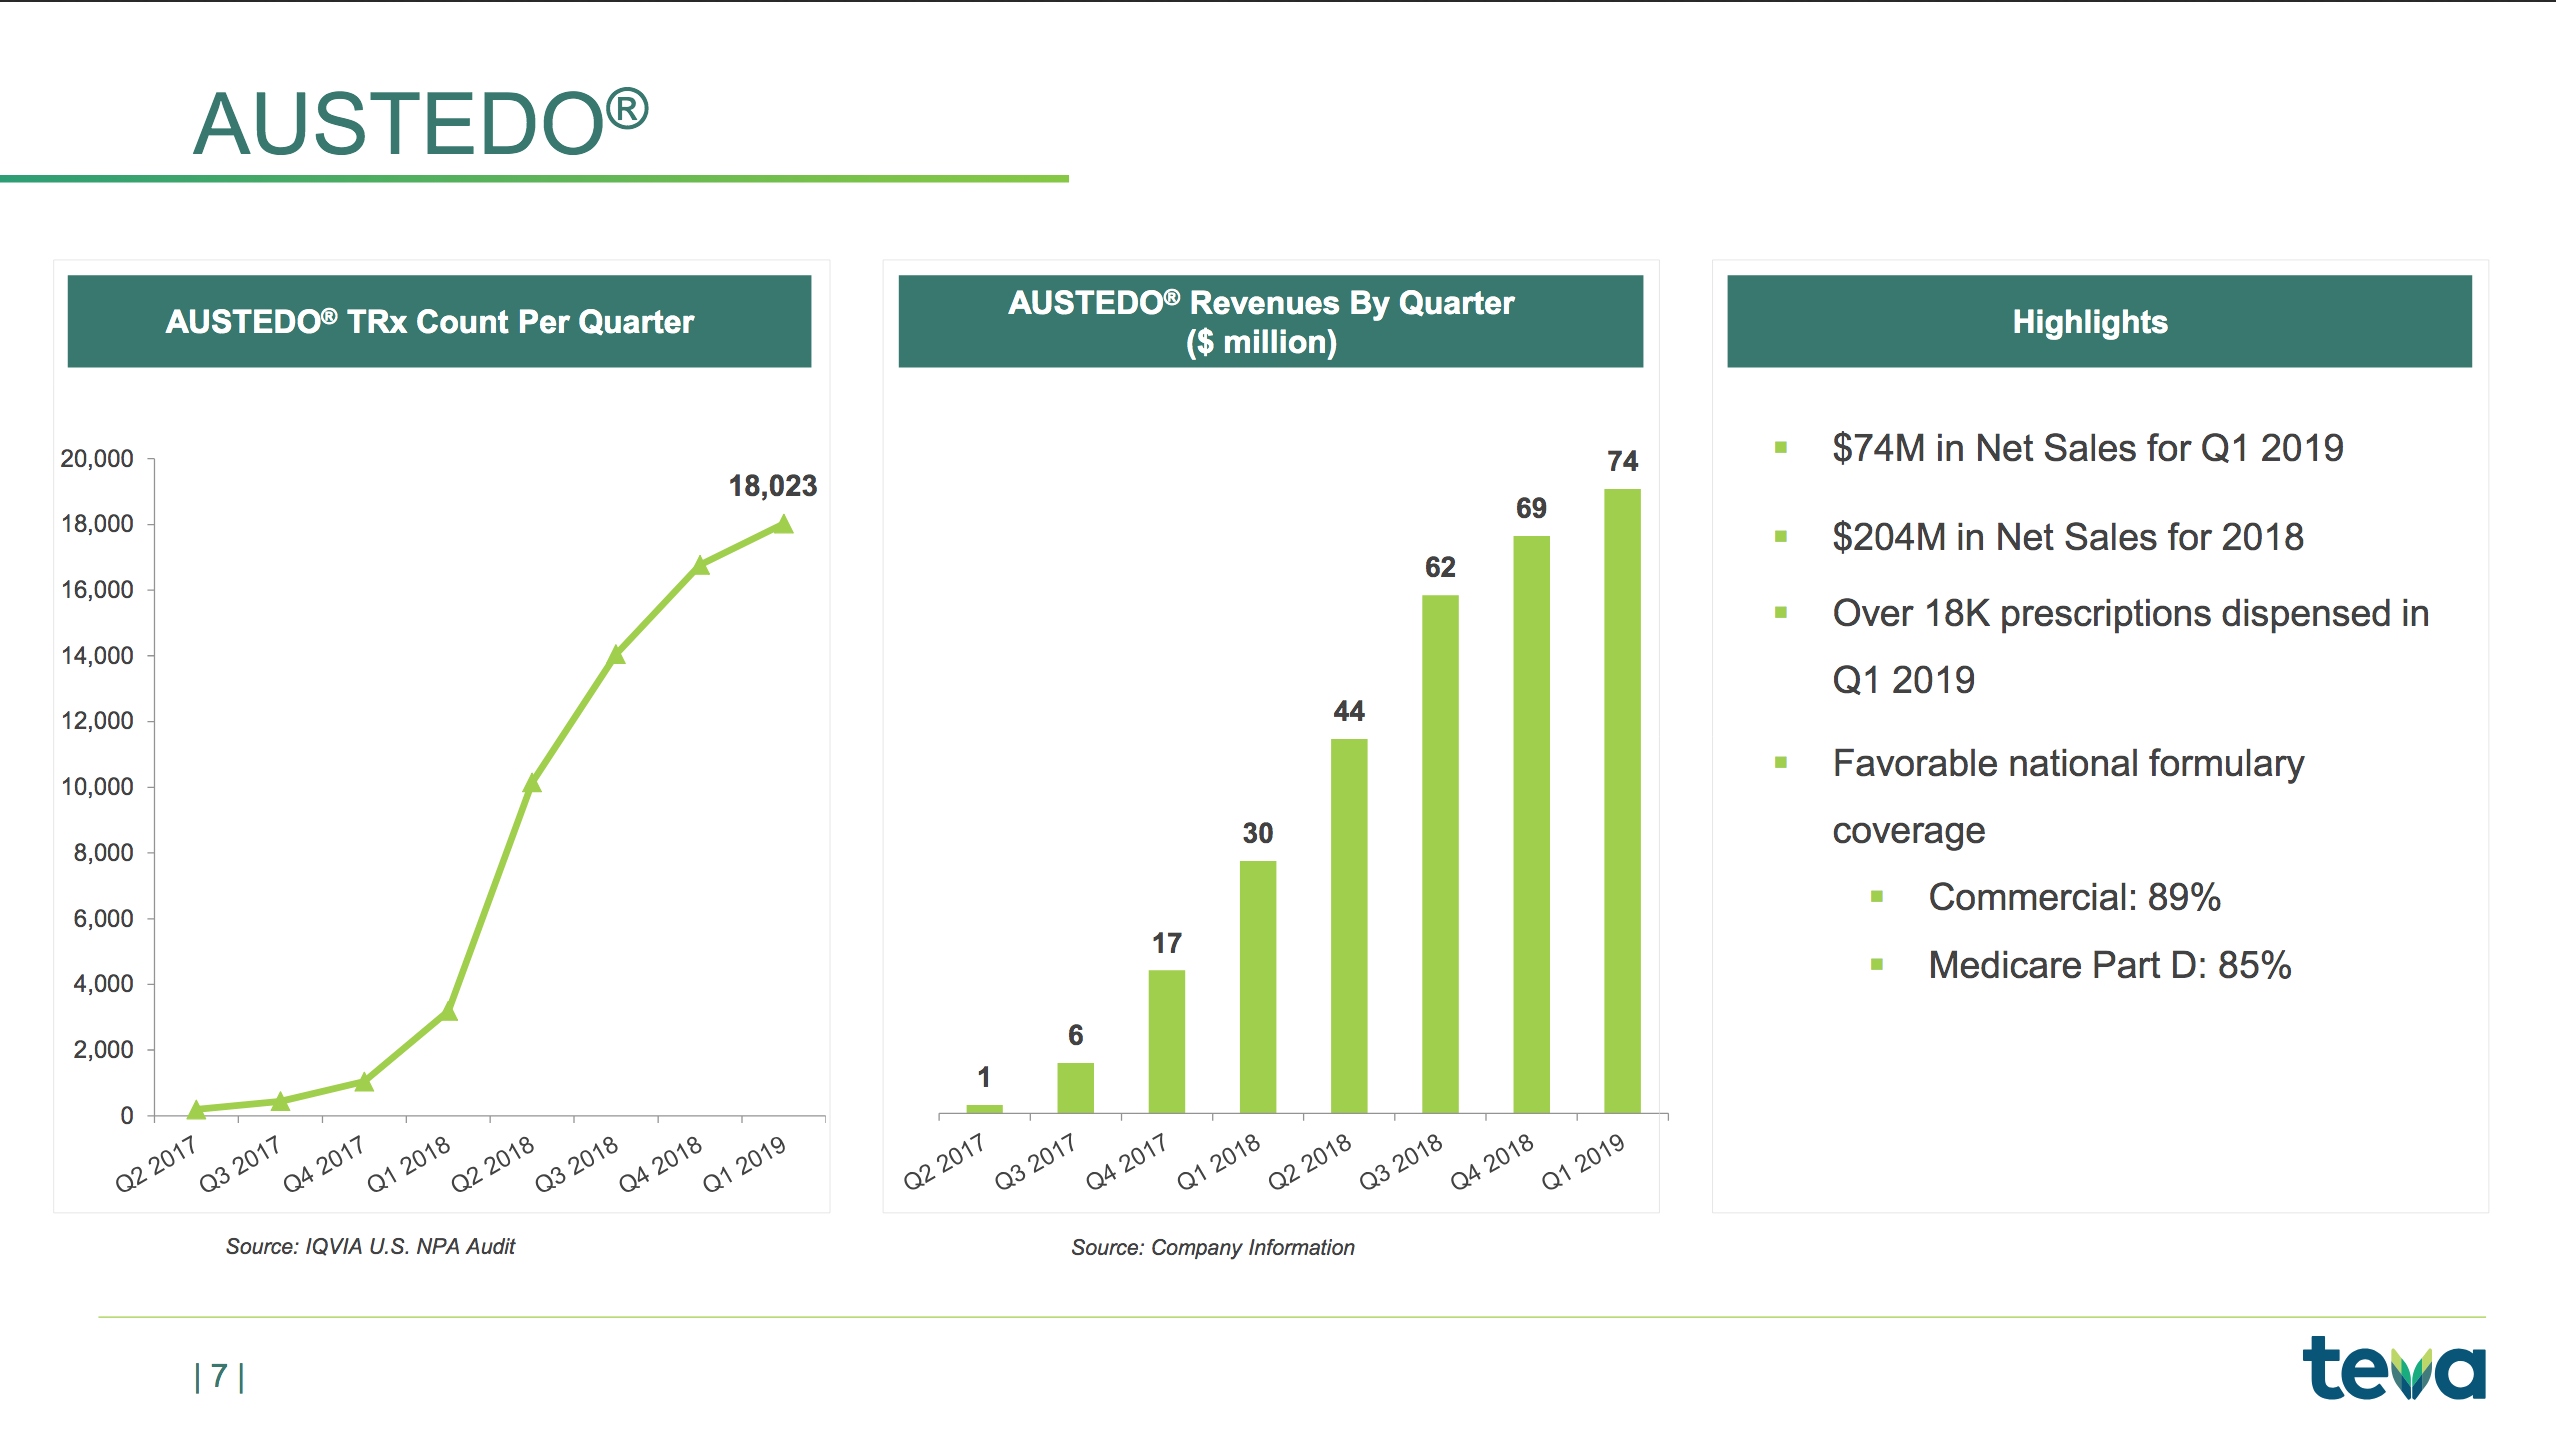
Mr. Schultz continued: “We faced the expected loss of exclusivities of key products COPAXONE® and ProAir® to generic competition. Our focus is on stabilizing our global generics business and ensuring the success of our long-term organic growth drivers, especially AJOVY® and AUSTEDO®. Both products continue to gain momentum since their initial launches and we are making the necessary investments to be able to bring them to markets outside of the U.S. as well as explore additional indications.”
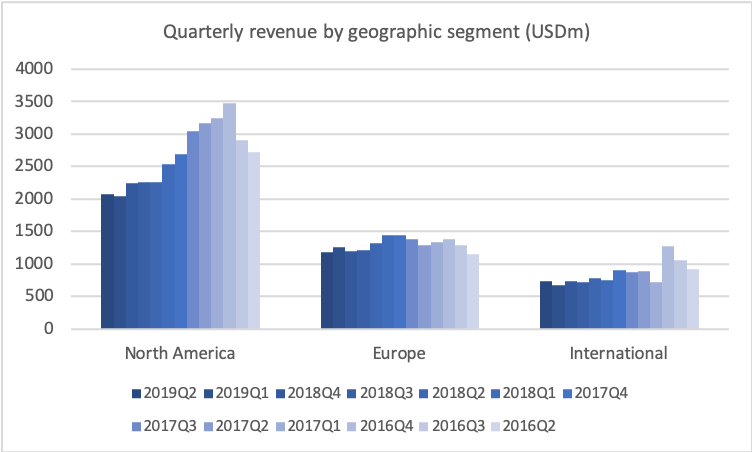
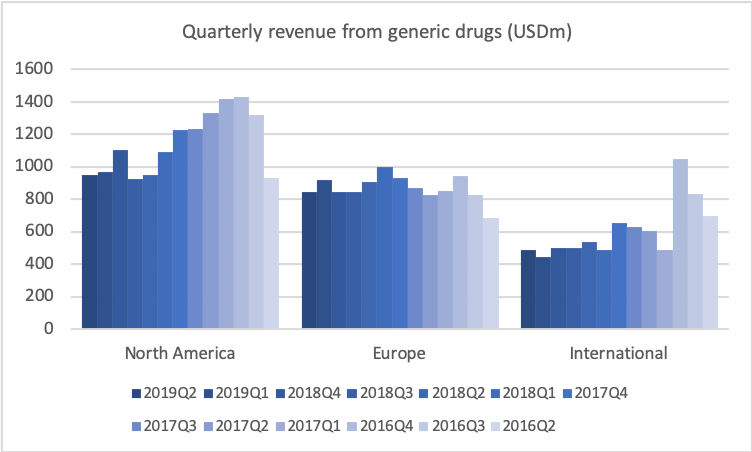
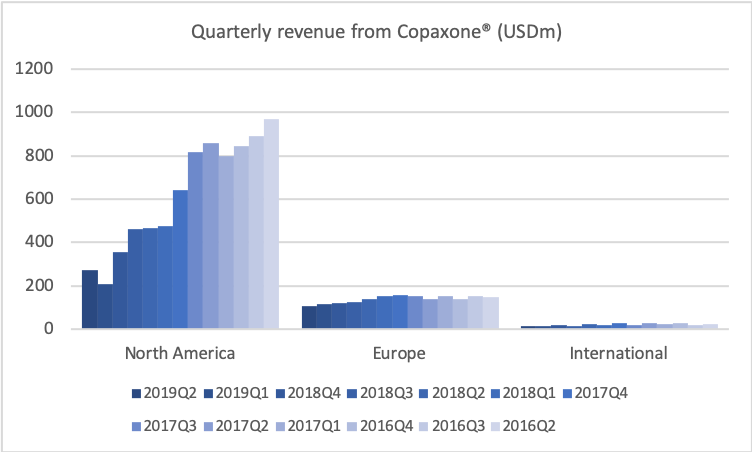
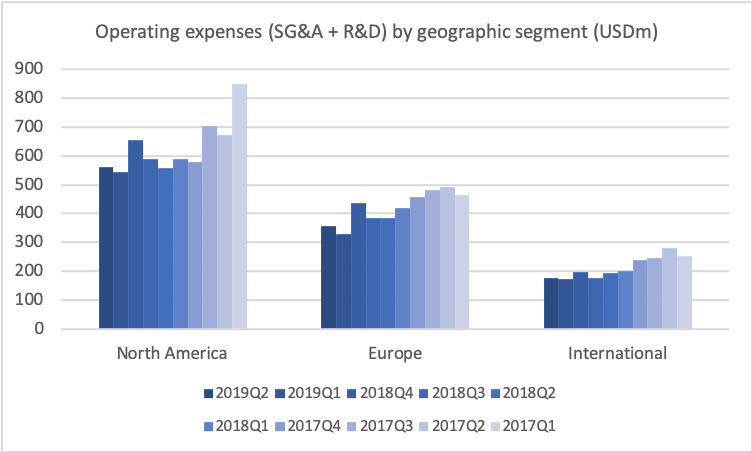
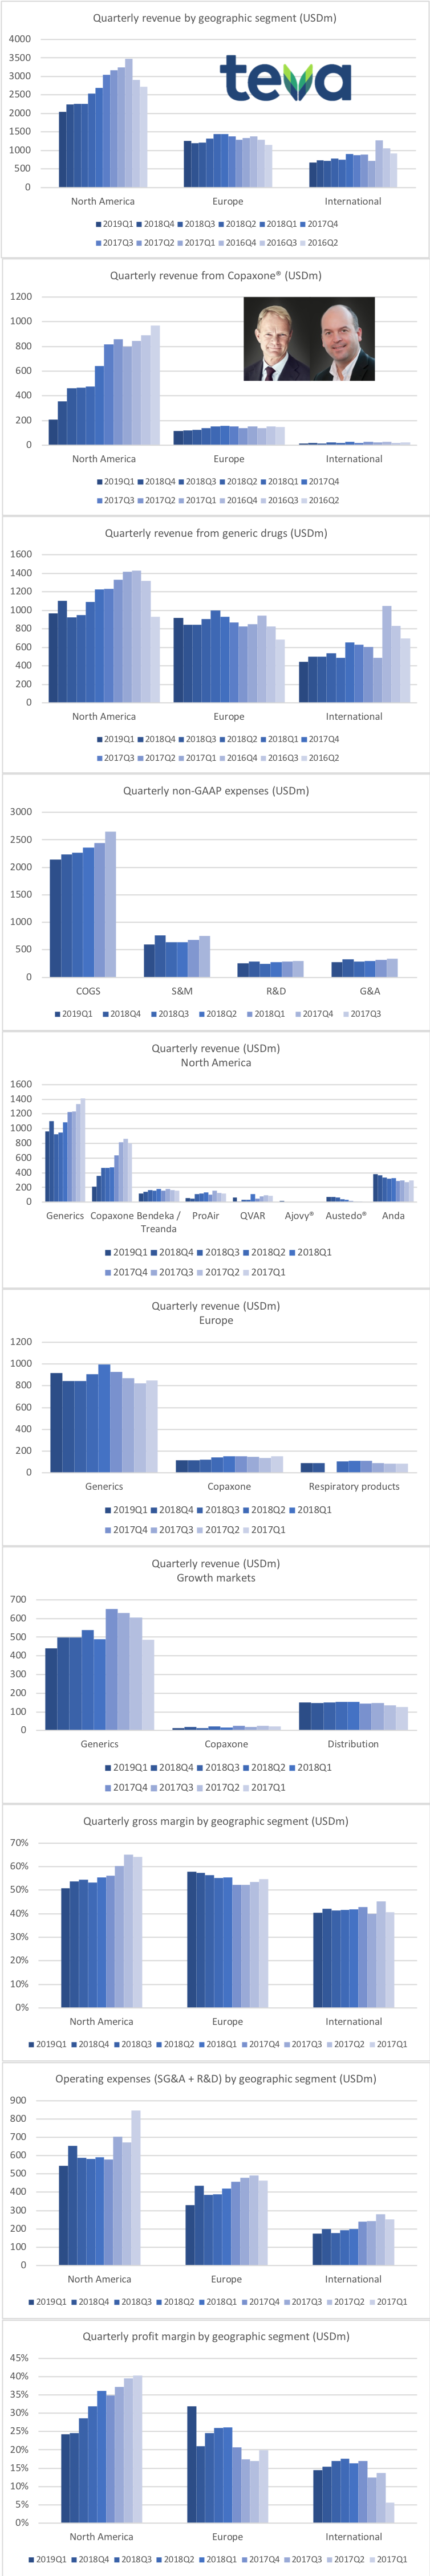
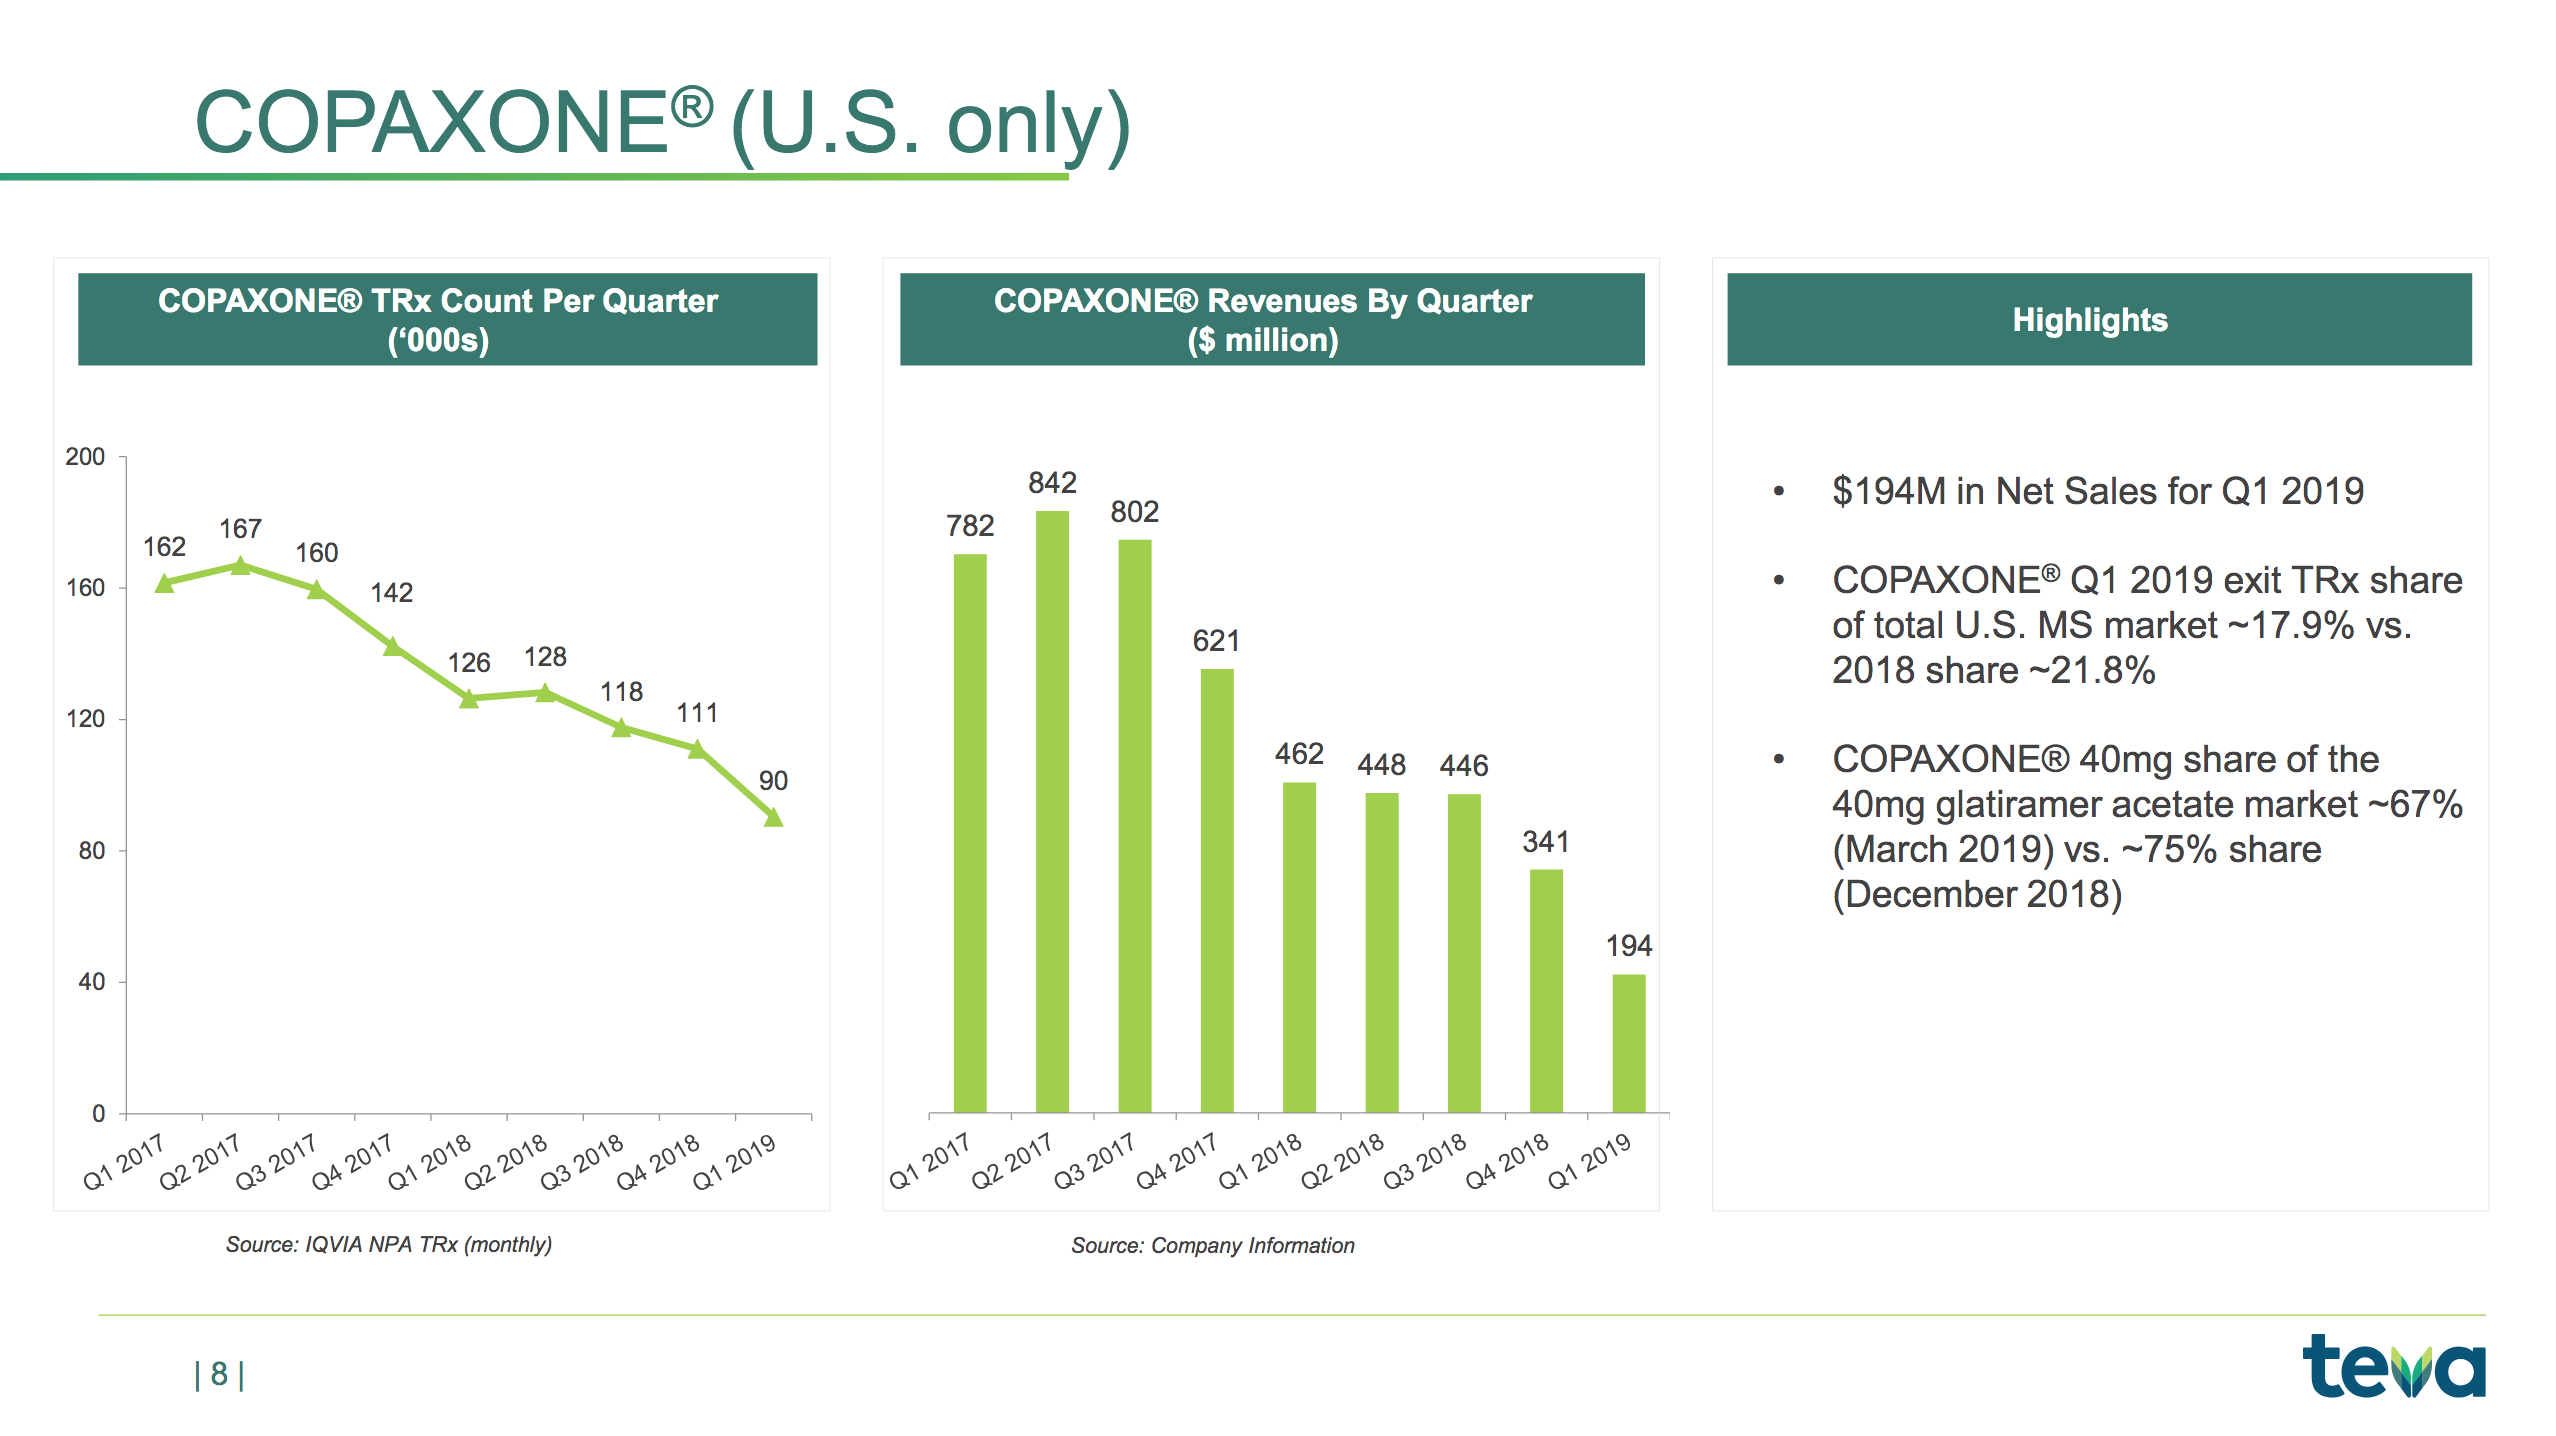
Below the revenue is shown for each geographic segment, the multiple sclerosis drug Copaxone® and generic drugs. The operating expenses are also shown.
Copaxone® revenue has been further reduced following the introduction of generic versions from Mylan and Momenta at lower prices. Revenue from generic drugs in the US seems to have stabilised. The company is on track to achieve the goal of reducing expenses by $3B annually and $750M quarterly. The migraine drug Ajovy® does not yet contribute significantly to the overall revenue. Annual peak sales have been estimated to be greater than $500M. Ajovy® received EU approval in April 2019.
The slide below is a summary of the quarterly highlights not already mentioned above.
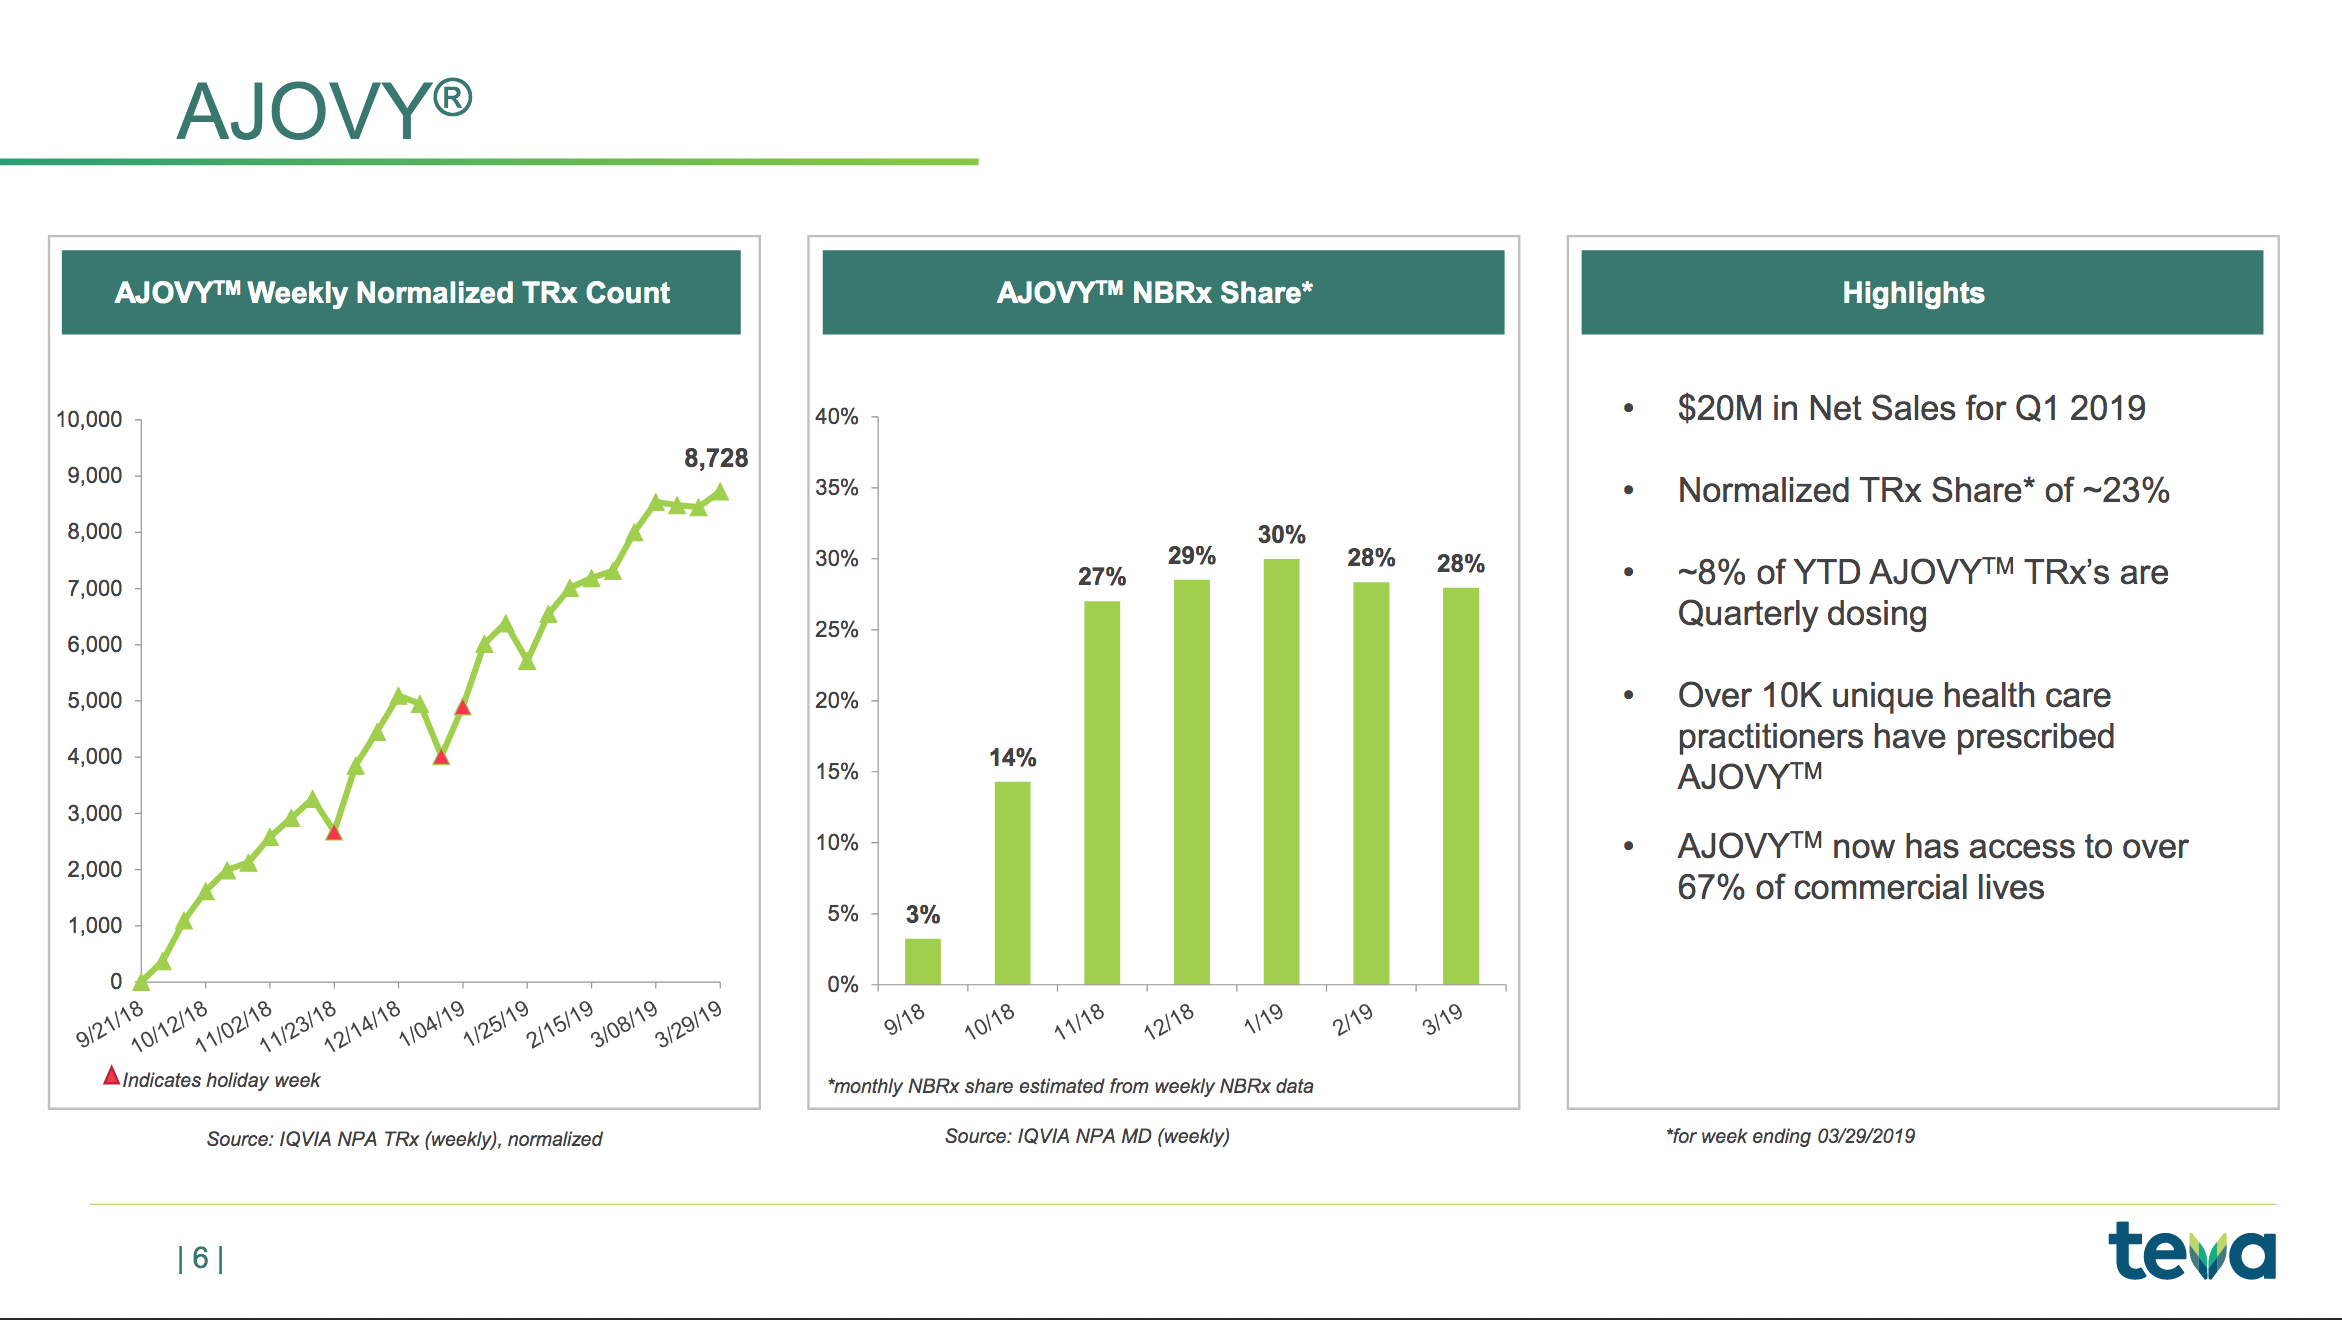
The slide below shows the NBRx market share of the migraine drug Ajovy®.
The current competition is Aimovig® from Amgen and Emgality® from Lilly.
Alder BioPharmaceuticals also has a CGRP migraine drug (eptinezumab) in phase 3.
The slides below are summaries of Austedo®, Copaxone® and Ajovy®
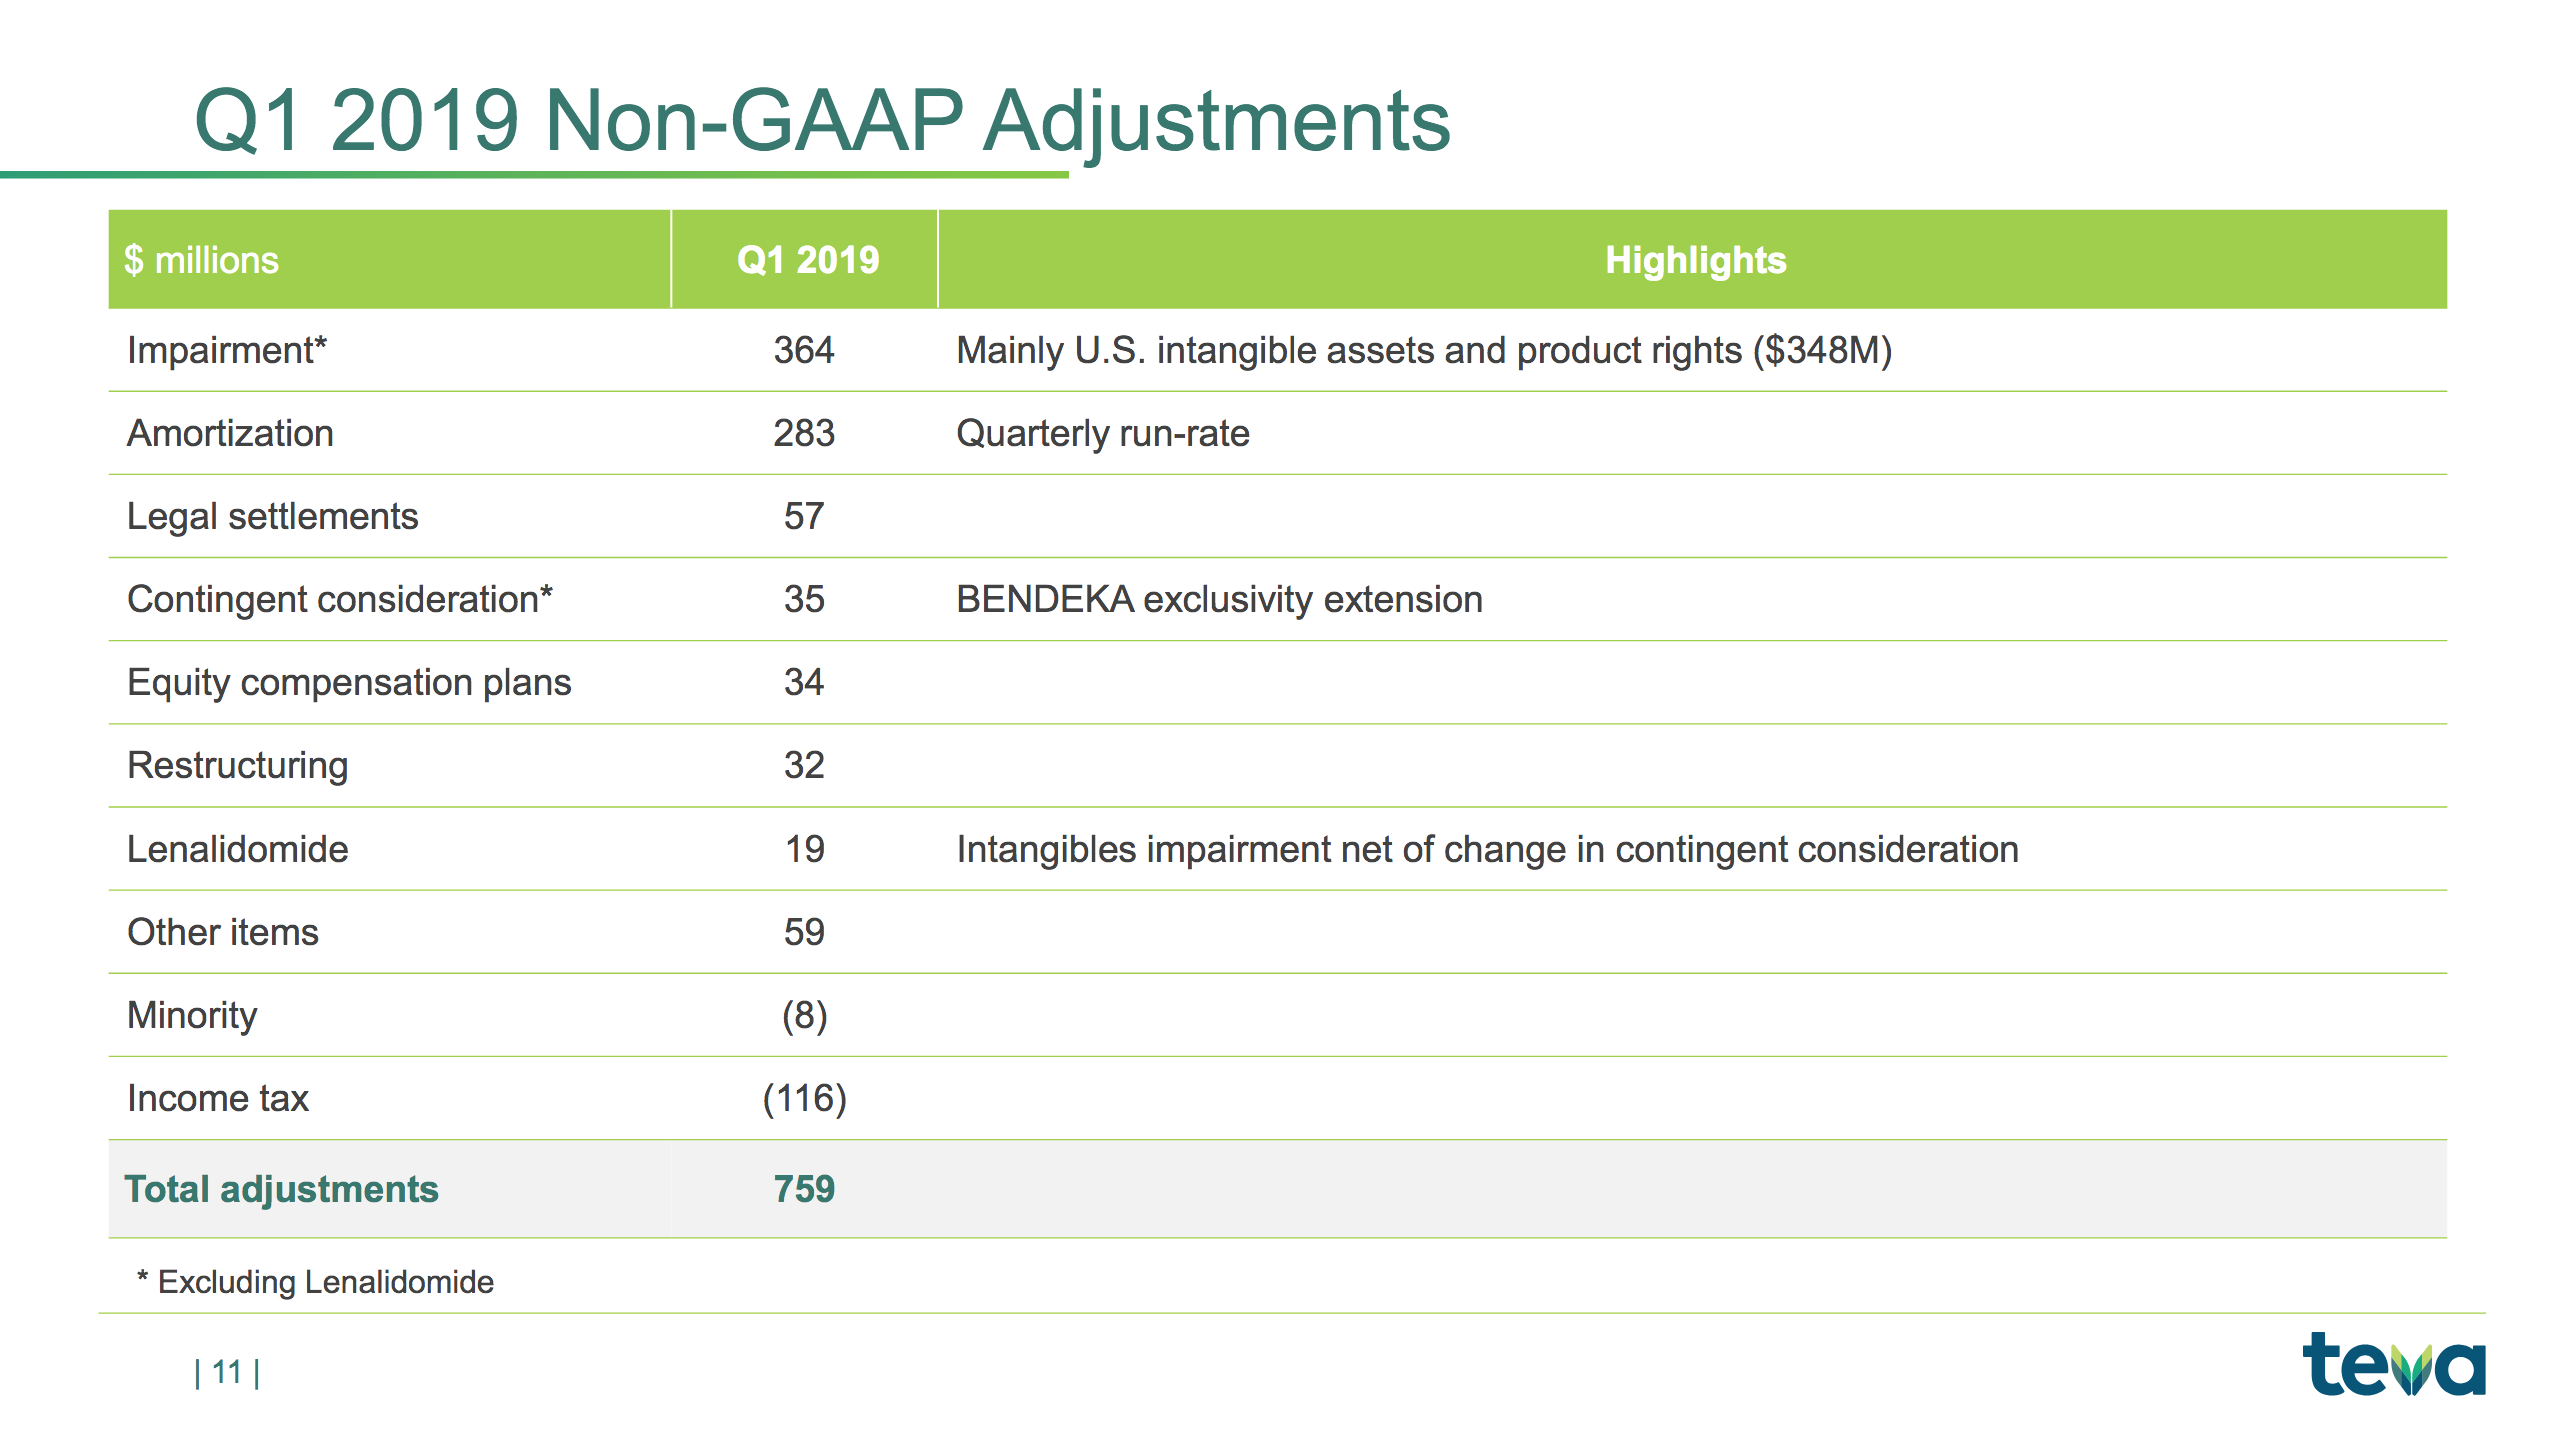
The slides below are summaries of GAAP and non-GAAP metrics and a summary of the items causing the difference; e.g. $348M of impairment charges to intangible assets and amortisation of $283M.
The slides below summarises the free cash flow and the long term debt.
The slide below summarises the non-GAAP outlook.
The final slide below shows the debt maturity. The CEO has said the company will not need to raise equity, but given the reduced revenue, profit and cash flow the company will definitely have to refinance. Currently the credit rating is BB with S&P and Ba2 with Moody’s.
I do think Teva could trade close to $30 within the next 2-5 years, but it’s not a business I would own long term, so I choose not to buy at $14-16 despite the lowest EPS forecast for 2020 currently being $2.28 and the remainder of the market (i.e. S&P500) being somewhat overpriced.
During the call the CEO didn’t reveal much about the long term targets and long term strategy:
Yeah, of course, we have the aim to become as effective as any of our competitors, which means that longer-term we need to improve our margins which is why we have a long-term financial target of an operating margin of 27%, which is higher than where we are right now. So, of course, in order to achieve that, we need to set plans in place so that this happens. Our plan right now is to communicate more broadly on this once we finish this year. So once we finish the restructuring of ’18 and ’19, we will communicate to you what is our strategy for manufacturing and for that part of the cost base.
You can see that, we have a long-term target of the operating profit of 27%, that’s higher than where we are now. Part of that improvement of course has to come from the COGS, because if we don’t improve the gross margin, then it’s going to be very difficult to get a significant improvement of the total margin. So yes, we will be targeting something like that. We will give you some more details on what we are planning to do once we finish the restructuring, that means once we report on the full year of 2019. Next February, we’ll give you an outline of how we see the ongoing optimization of our manufacturing system.
On the R&D side, we spent roughly $1 billion on R&D, and you could see the — a big chunk of that is for innovative specialty products. We have about 30 development projects ongoing, about two-thirds of those are biopharmaceuticals. And we don’t really want to share that with anybody right now. The reason is that, we are in the restructuring right now this year and last year, but our plan is to share more with you once we finish this year. So once we get to February of next year, we will share a bit more with you on what is our pipeline, what are the different projects we have.
Globes, May 2nd: Teva Q1 revenue down but profit beats analysts
Bloomberg, May 2nd: Teva Falls as Sales of Copaxone Decline Faster Than Expected
Reuters, May 2nd: Teva’s new migraine drug helps to contain profit fall
Apple issued a press release about their quarterly results with the headline “Services Revenue Reaches New All-Time High of $11.5 Billion”.
“Our March quarter results show the continued strength of our installed base of over 1.4 billion active devices, as we set an all-time record for Services, and the strong momentum of our Wearables, Home and Accessories category, which set a new March quarter record,” said Tim Cook, Apple’s CEO. “We delivered our strongest iPad growth in six years, and we are as excited as ever about our pipeline of innovative hardware, software and services. We’re looking forward to sharing more with developers and customers at Apple’s 30th annual Worldwide Developers Conference in June.”
“We generated operating cash flow of $11.2 billion in the March quarter and continued to make significant investments in all areas of our business,” said Luca Maestri, Apple’s CFO. “We also returned over $27 billion to shareholders through share repurchases and dividends. Given our confidence in Apple’s future and the value we see in our stock, our Board has authorized an additional $75 billion for share repurchases. We are also raising our quarterly dividend for the seventh time in less than seven years.”
iPhone revenue was down and revenue in China was down. Despite this the share price rallied.
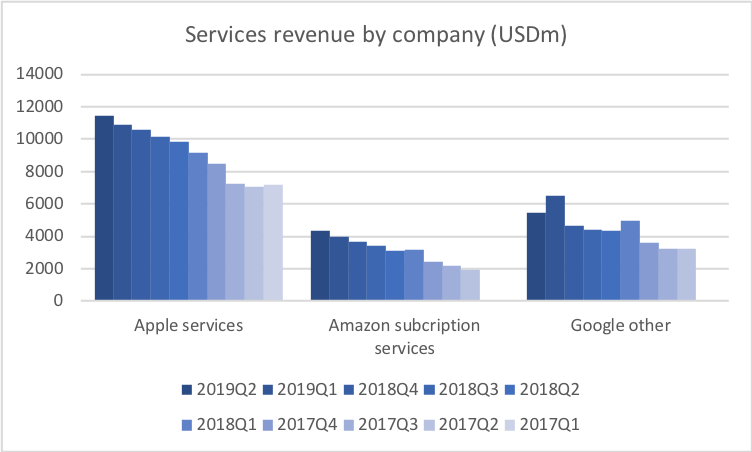
Apple is still the largest US manufacturer of several electronic home devices; i.e. phones, watches, smart speakers, tablets, laptops and desktops. And just to put things into context, Apple Services is larger in terms of revenue than Amazon subscription services and Google ditto (Google in-app purchases, Google Play store, Google Cloud, YouTube subscriptions) combined.
I would not buy Apple at current levels, but I would hold on to it. In my opinion it has a wide moat in several product segments and geographic segments.
Reuters: Apple optimistic as accessories, iPhone price cuts help China sales
Bloomberg: Apple Forecast Beats Wall Street Estimates; Shares Rally
CNBC: Apple stock spikes after reporting strong guidance and earnings beat
CNBC: Apple is finally moving beyond the iPhone as the smartphone industry stalls out
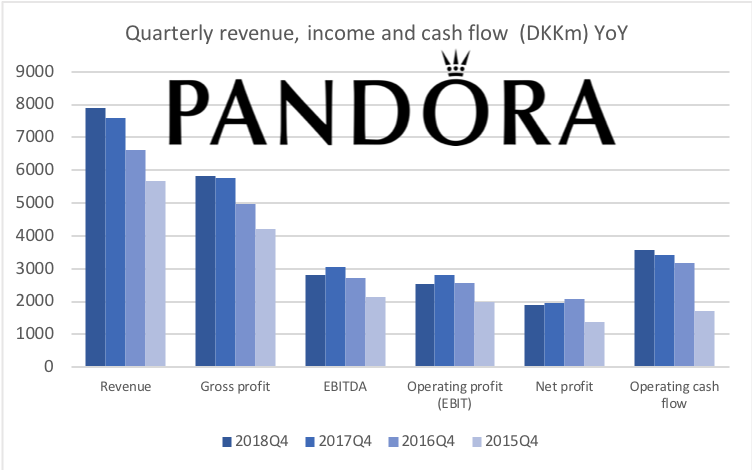
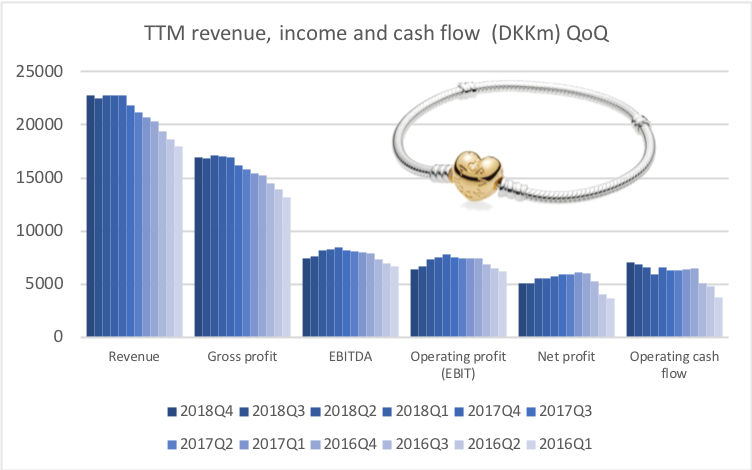
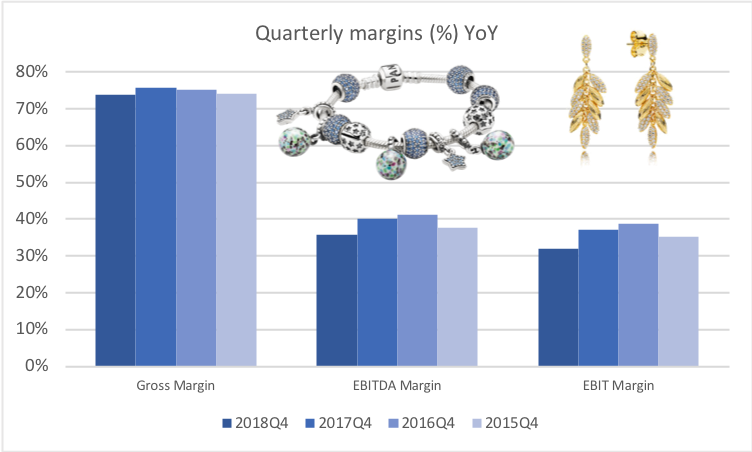
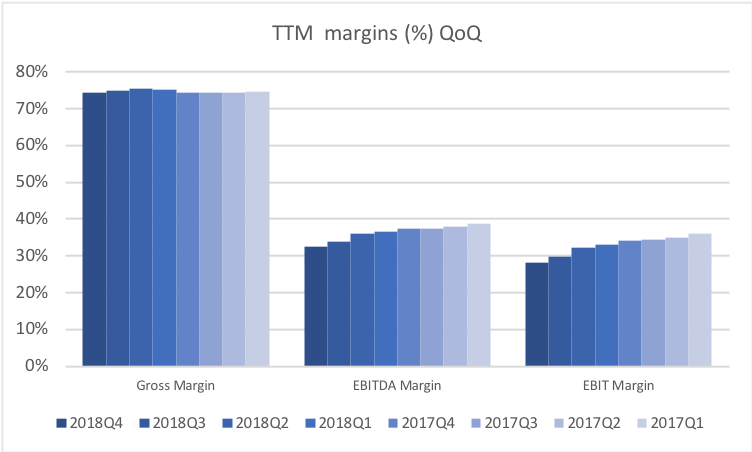
Today Pandora released their annual earnings. The self explanatory figures below summarise the earnings, the margins, the ROIC and the growth for the recent comparable quarters and for the previous TTM periods by product segment and by geographic segment.
Revenue and earnings
Margins
ROIC
By product segment
By geographic segment
Programme NOW
In November Programme NOW was launched to accelerate the strategic transformation of Pandora and drive sustainable growth.
As part of Programme NOW cost reductions of DKK1.2B are planned.
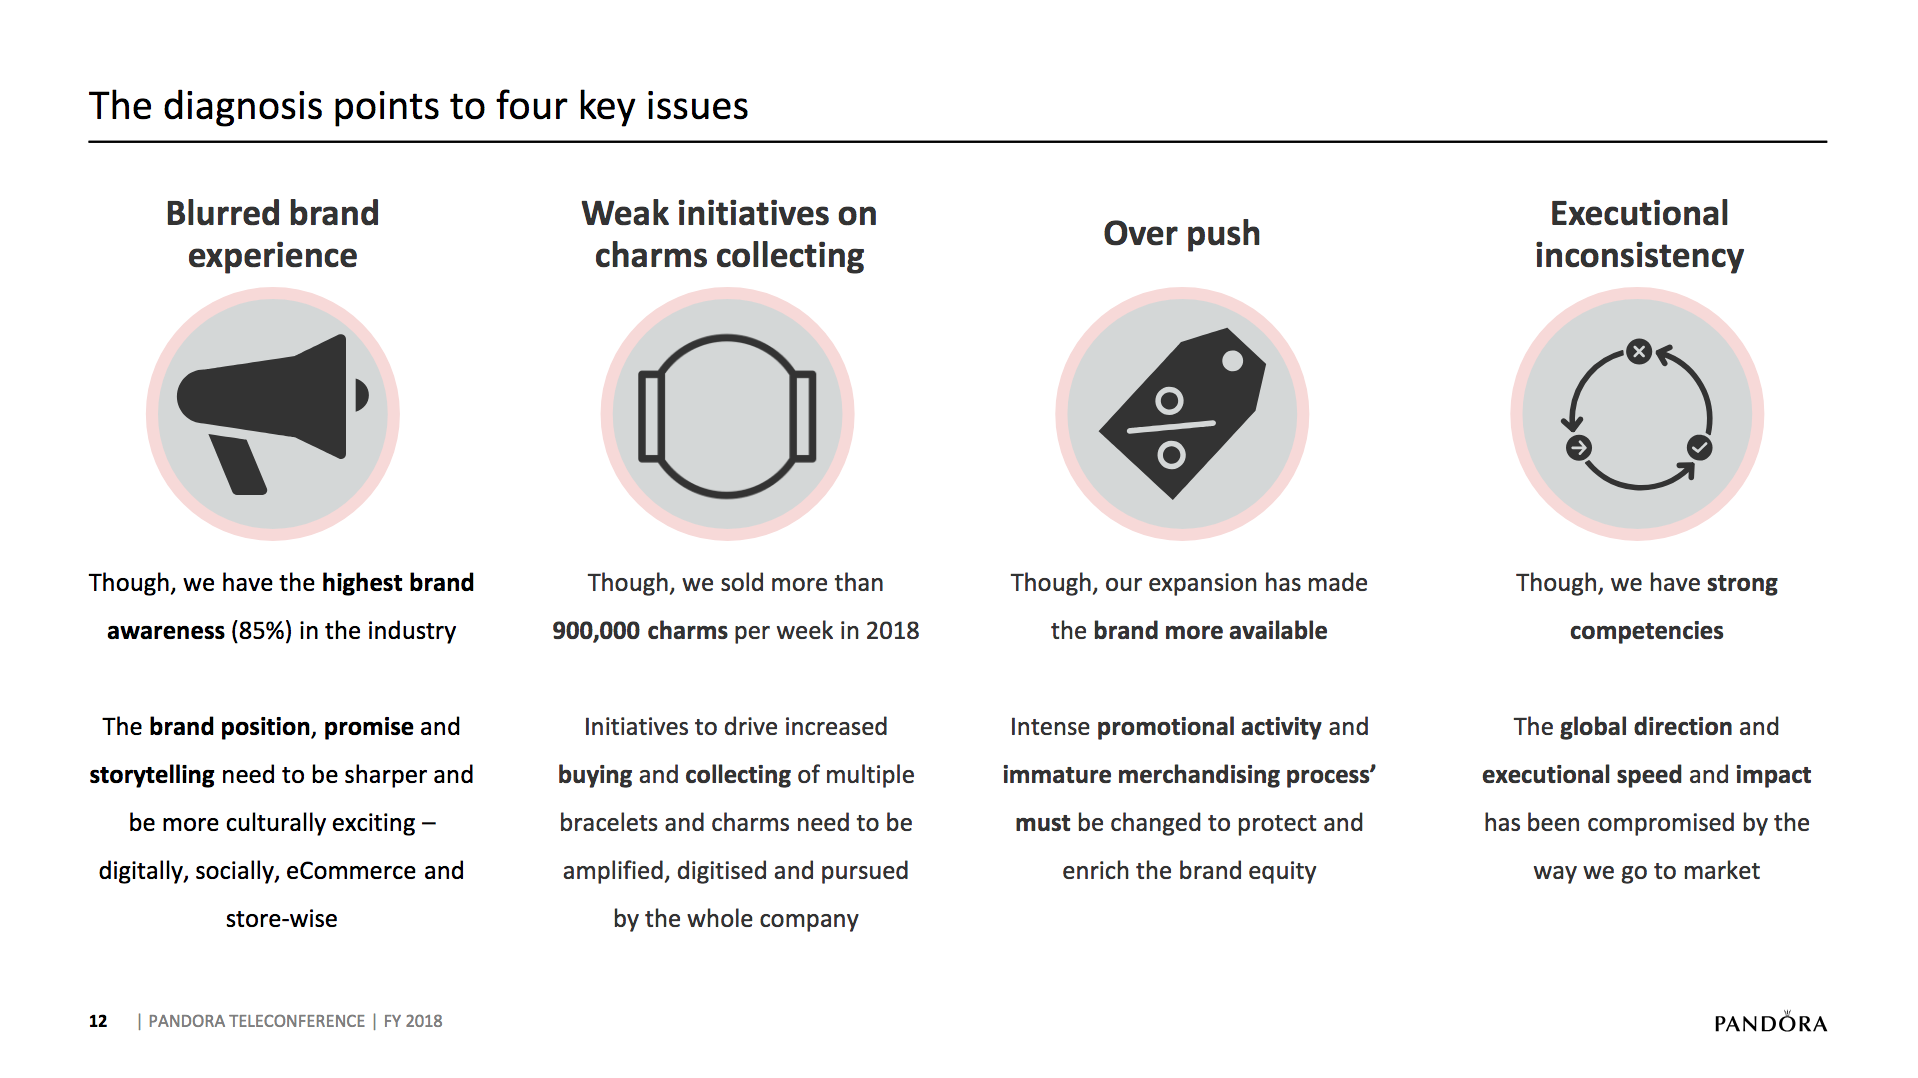
In this context I took notice of the following about “over push” in the press release and the steps taken to remedy it:
“Over push: increased promotional activity has diluted the brand equity and led consumers to wait for the next promotion instead of buying at full price. Additionally, the increase of new product introductions coupled with an immature merchandising process has led to a cluttered assortment presentation in the stores and a further build-up of inventory”
2019 Outlook
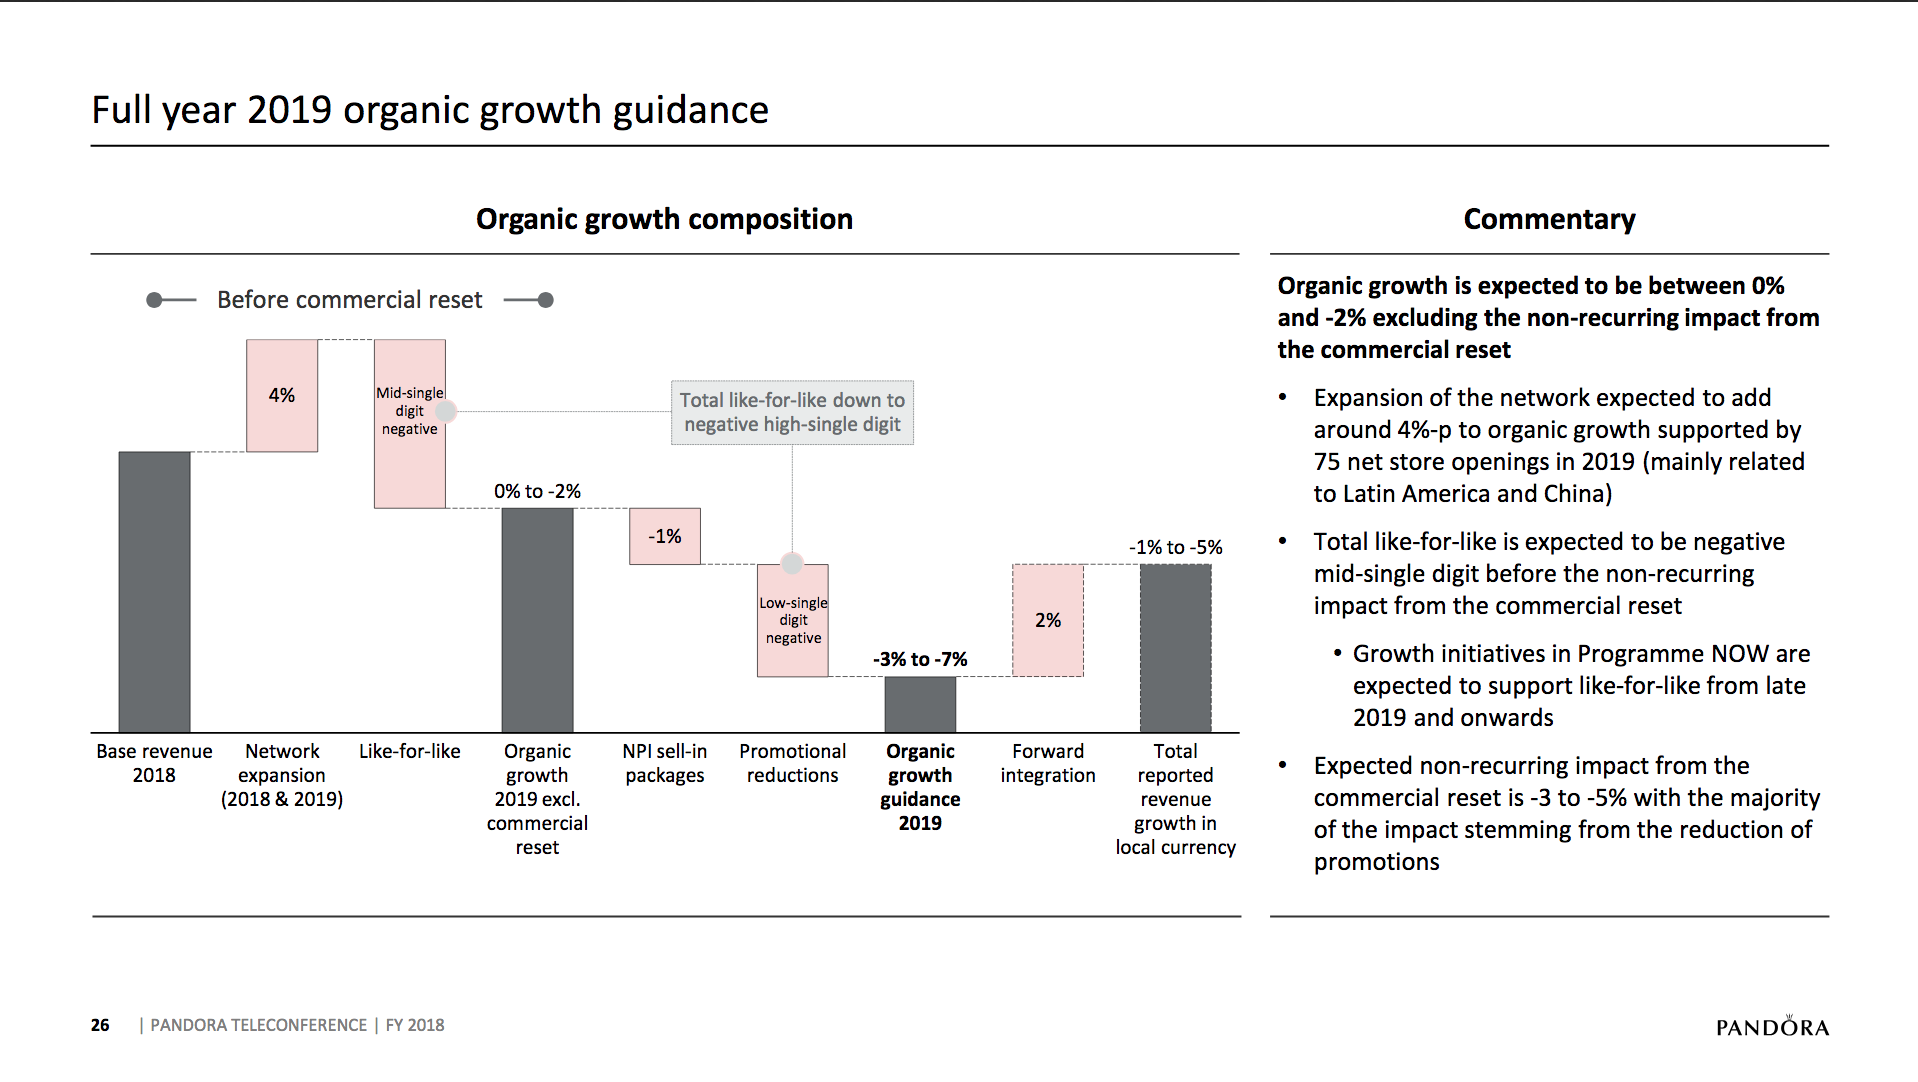
Pandora guides with organic growth between 0% and -2% in 2019 excluding their commercial reset as part of Programme NOW.
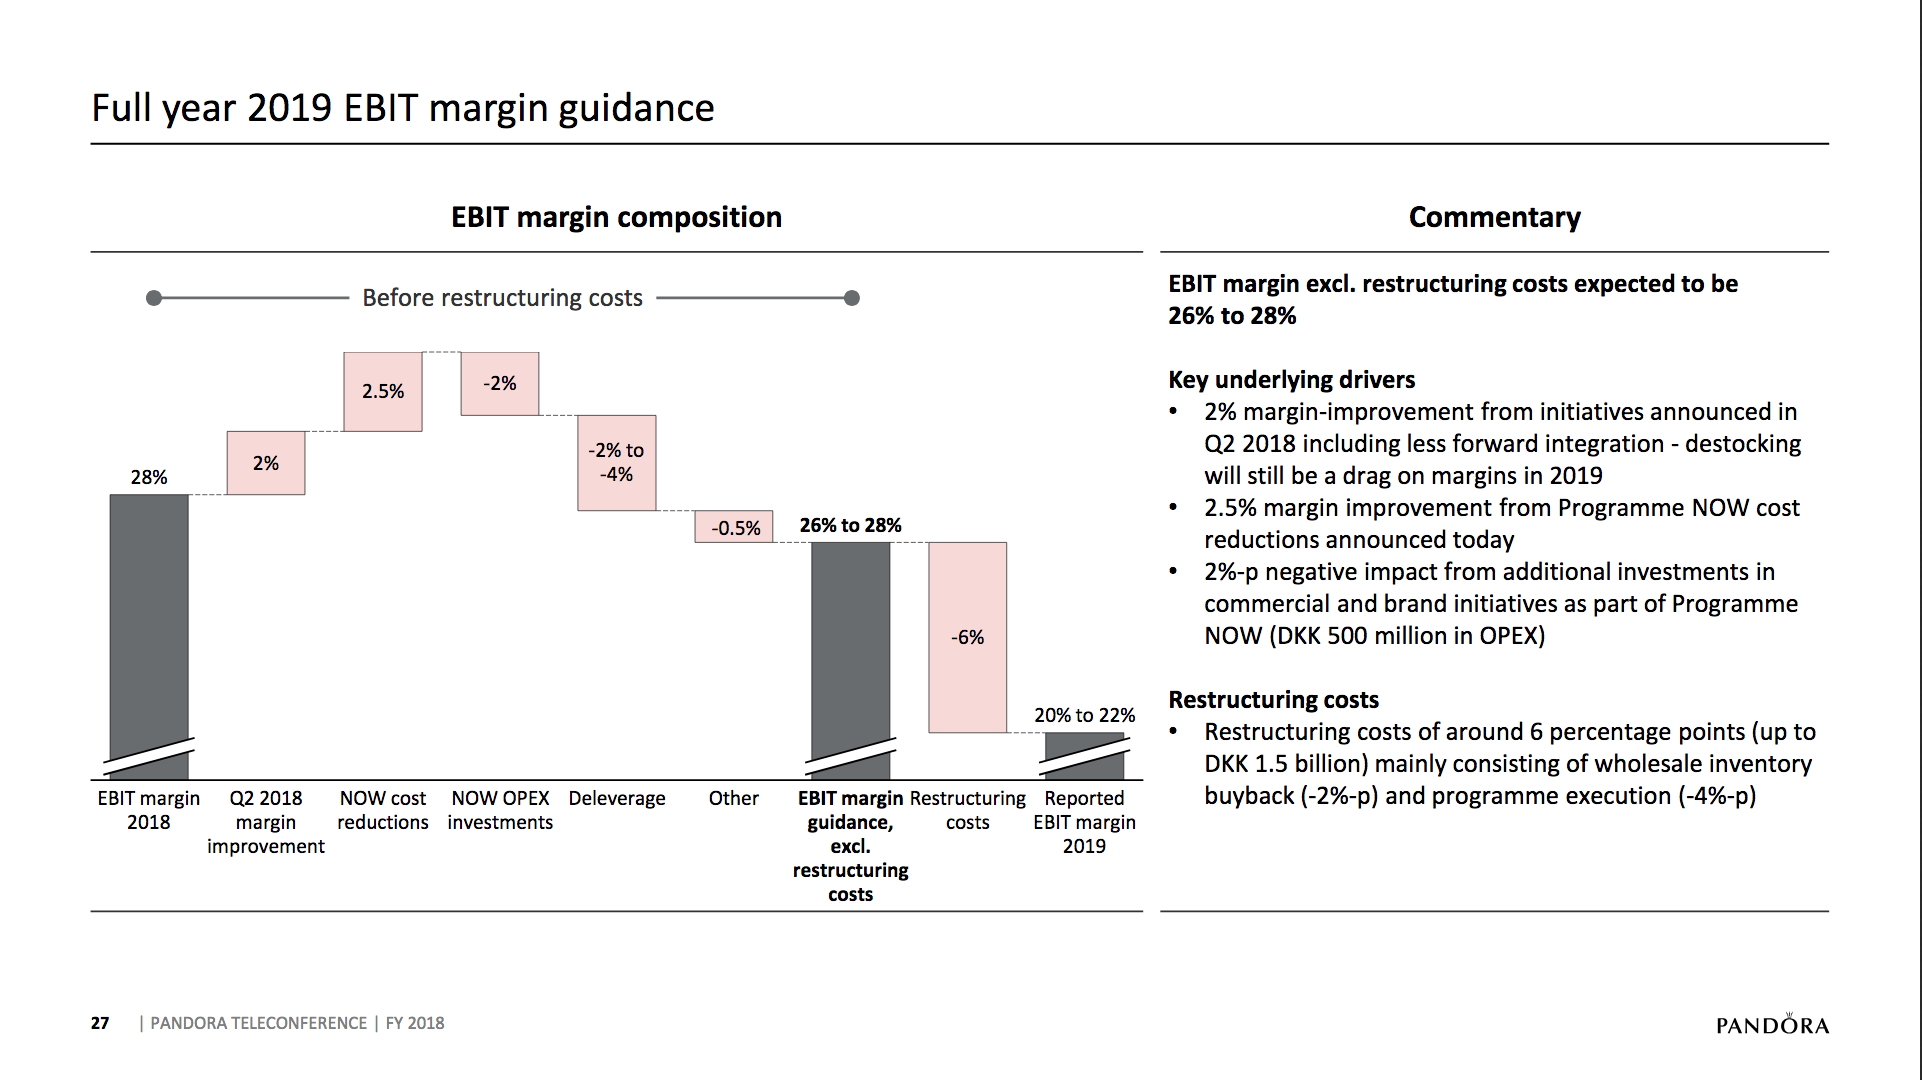
And they guide with an EBIT margin between 26% and 28% in 2019 excluding restructuring costs.
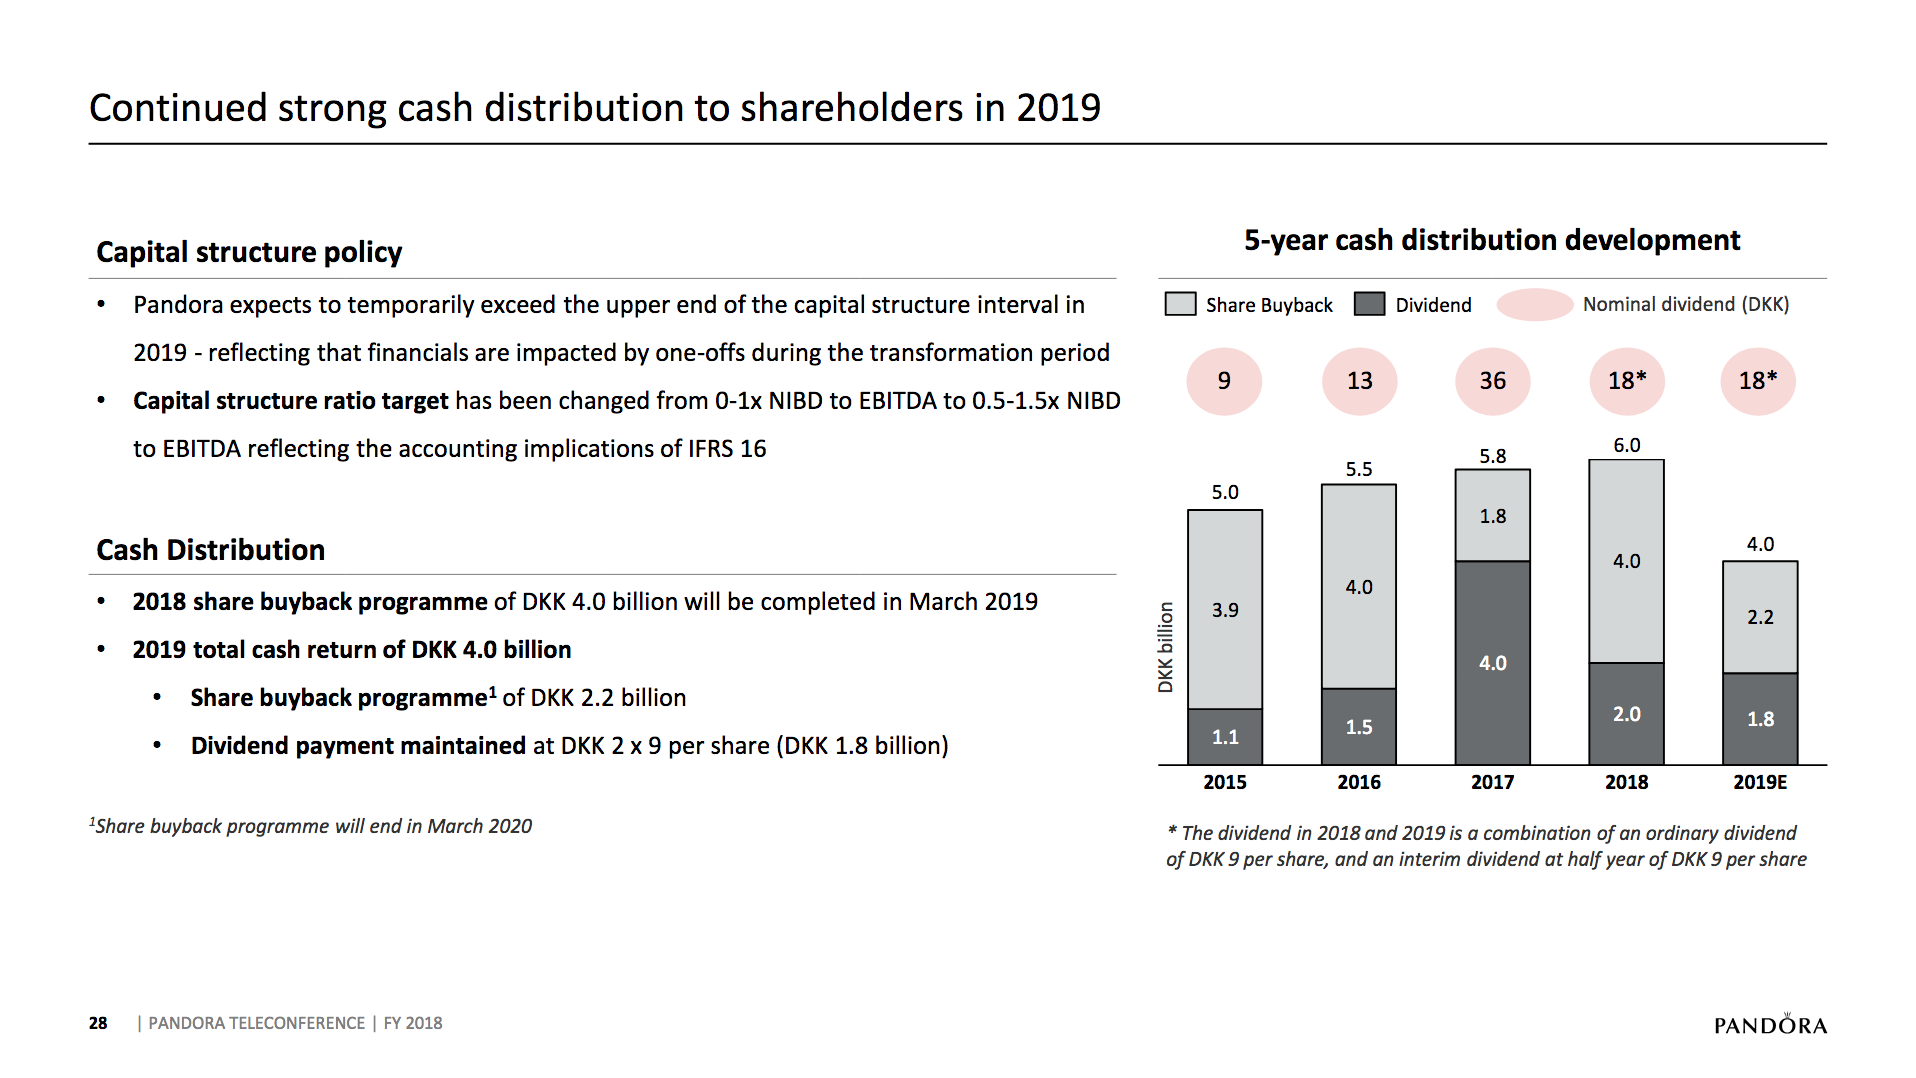
Pandora expects to return DKK4B to shareholders in 2019. The suggestion is for the dividend per share to be maintained and the repurchase of shares to be cut roughly in half to DKK2.2B. Less money has to be spent on the dividend in 2019, because of the share buyback in 2018.
Press coverage
Here headlines from other news outlets: Reuters: Jeweler Pandora plans cost cuts, sales seen falling Bloomberg: Pandora CFO on Guidance, Buyback, CEO Search, Store Closures Boersen: Pandoras aktie brager op med 15 pct efter regnskab og spareplan
Summary
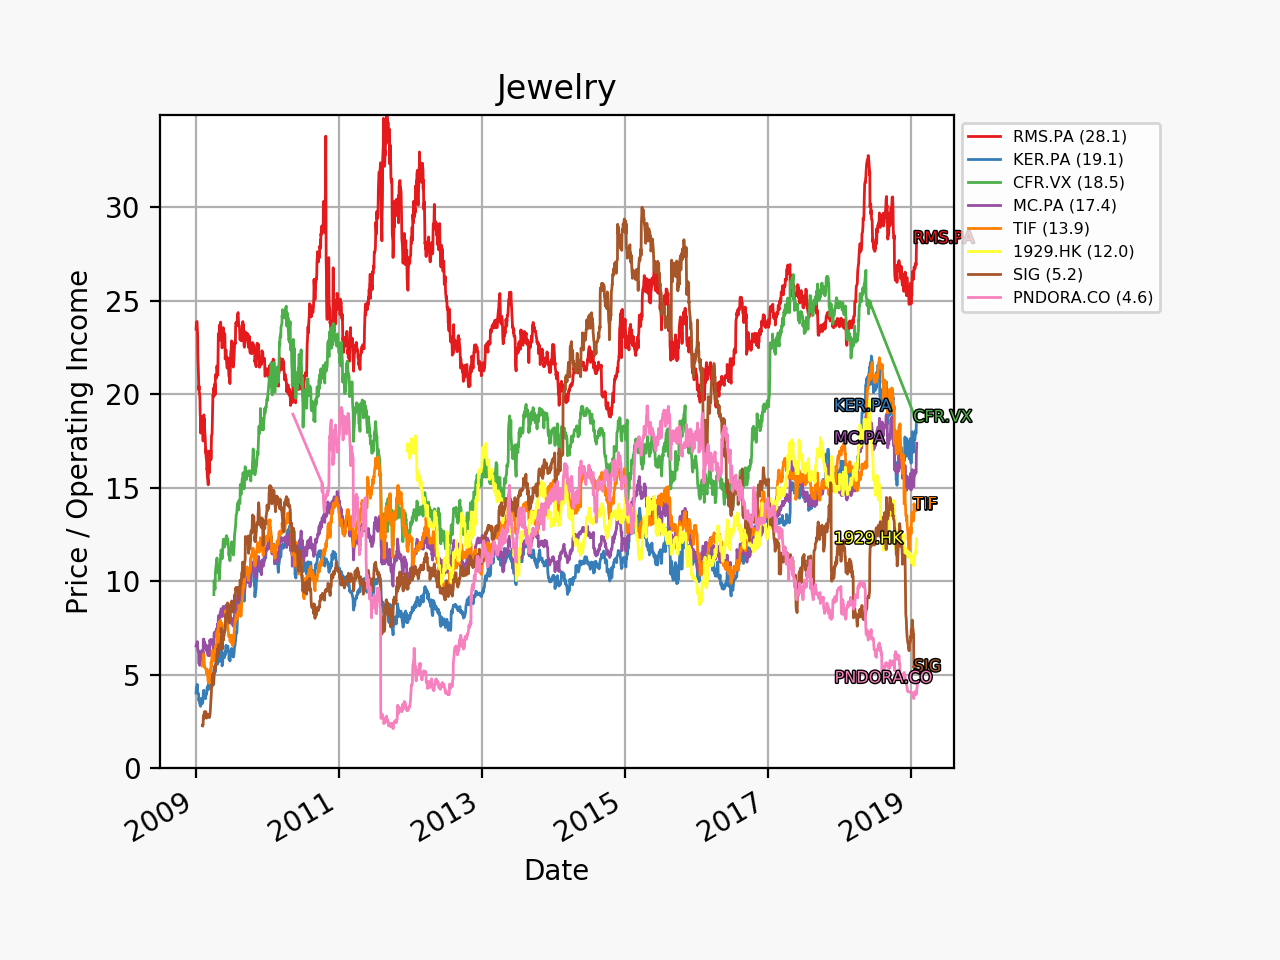
In summary it was anything but an impressive quarter, but it was expected and a data driven diagnosis has been carried out as part of Programme NOW and the multiples are quite low, so that might explain, why Q4 was well received. Pandora was up by more than 10% in early trading hours. Below price-to-operating income time series for publicly listed companies operating in the jewellery industry.
Appendix
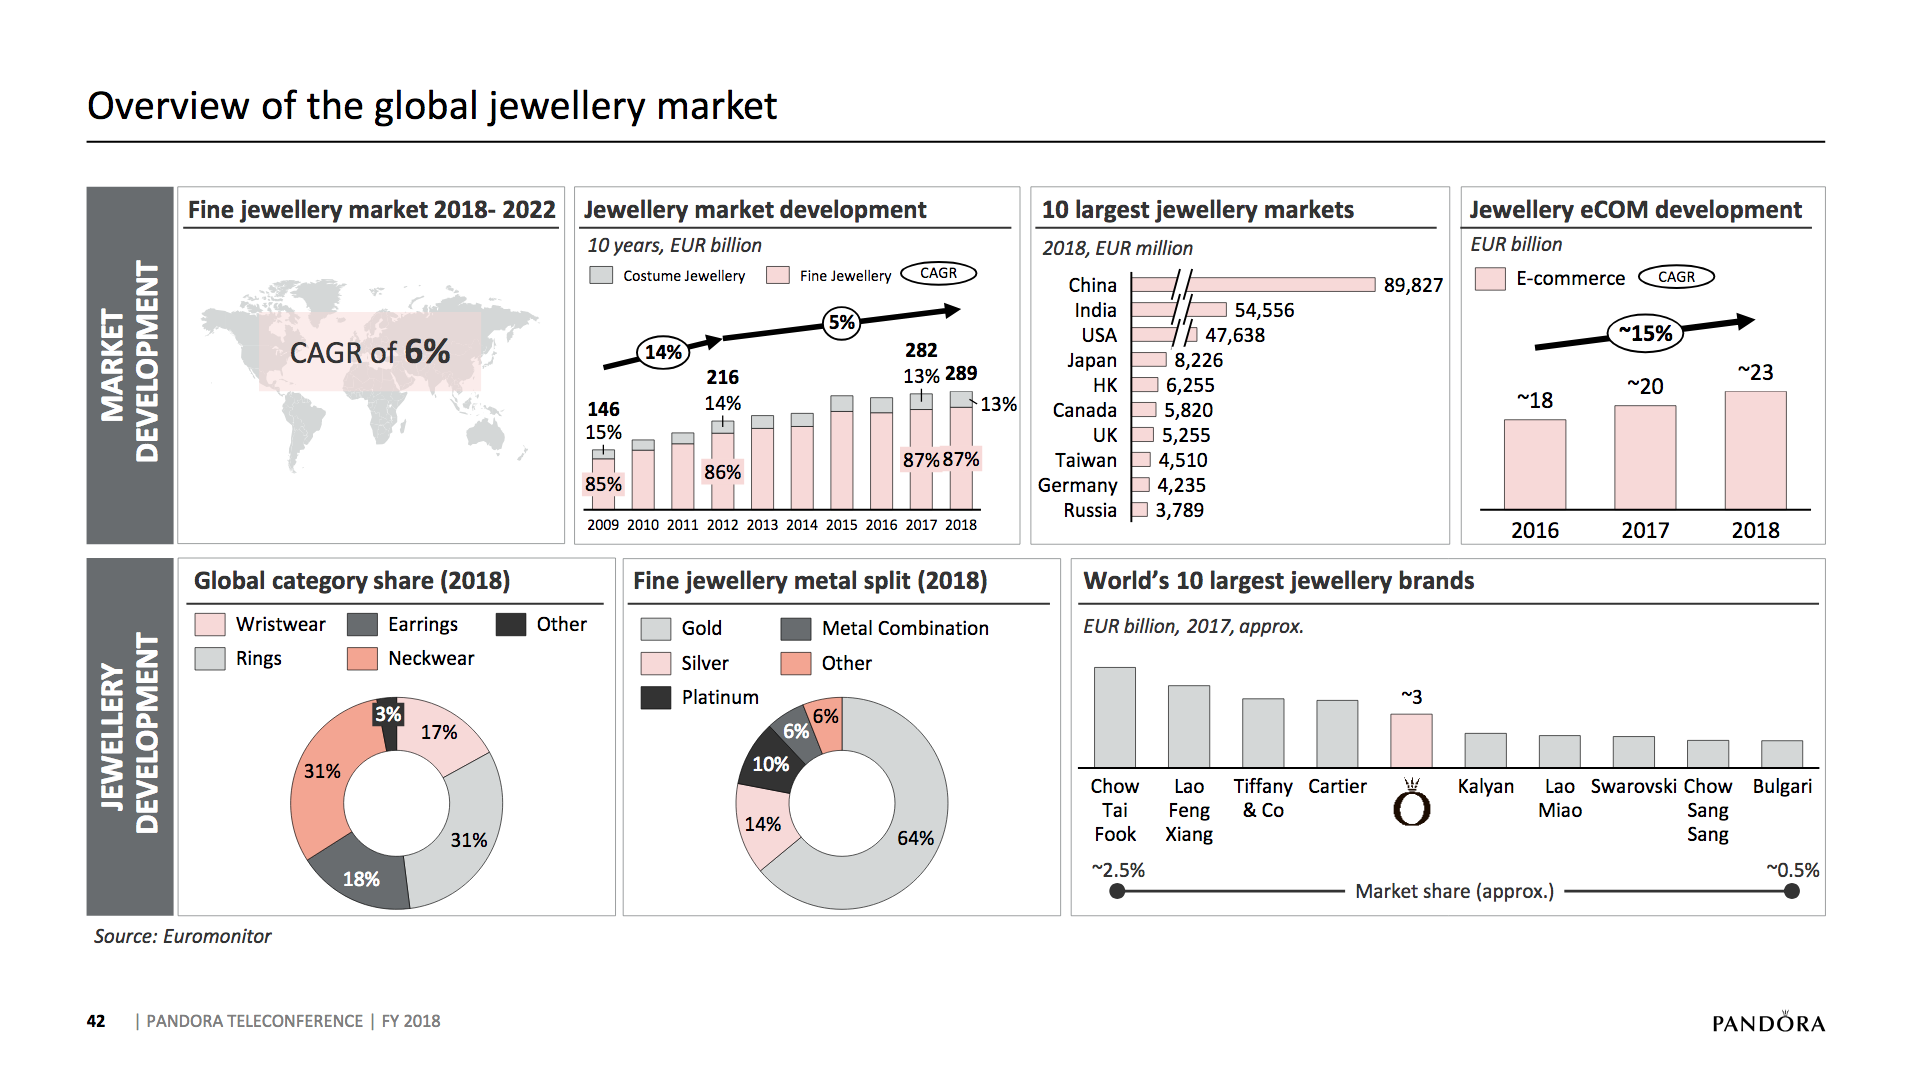
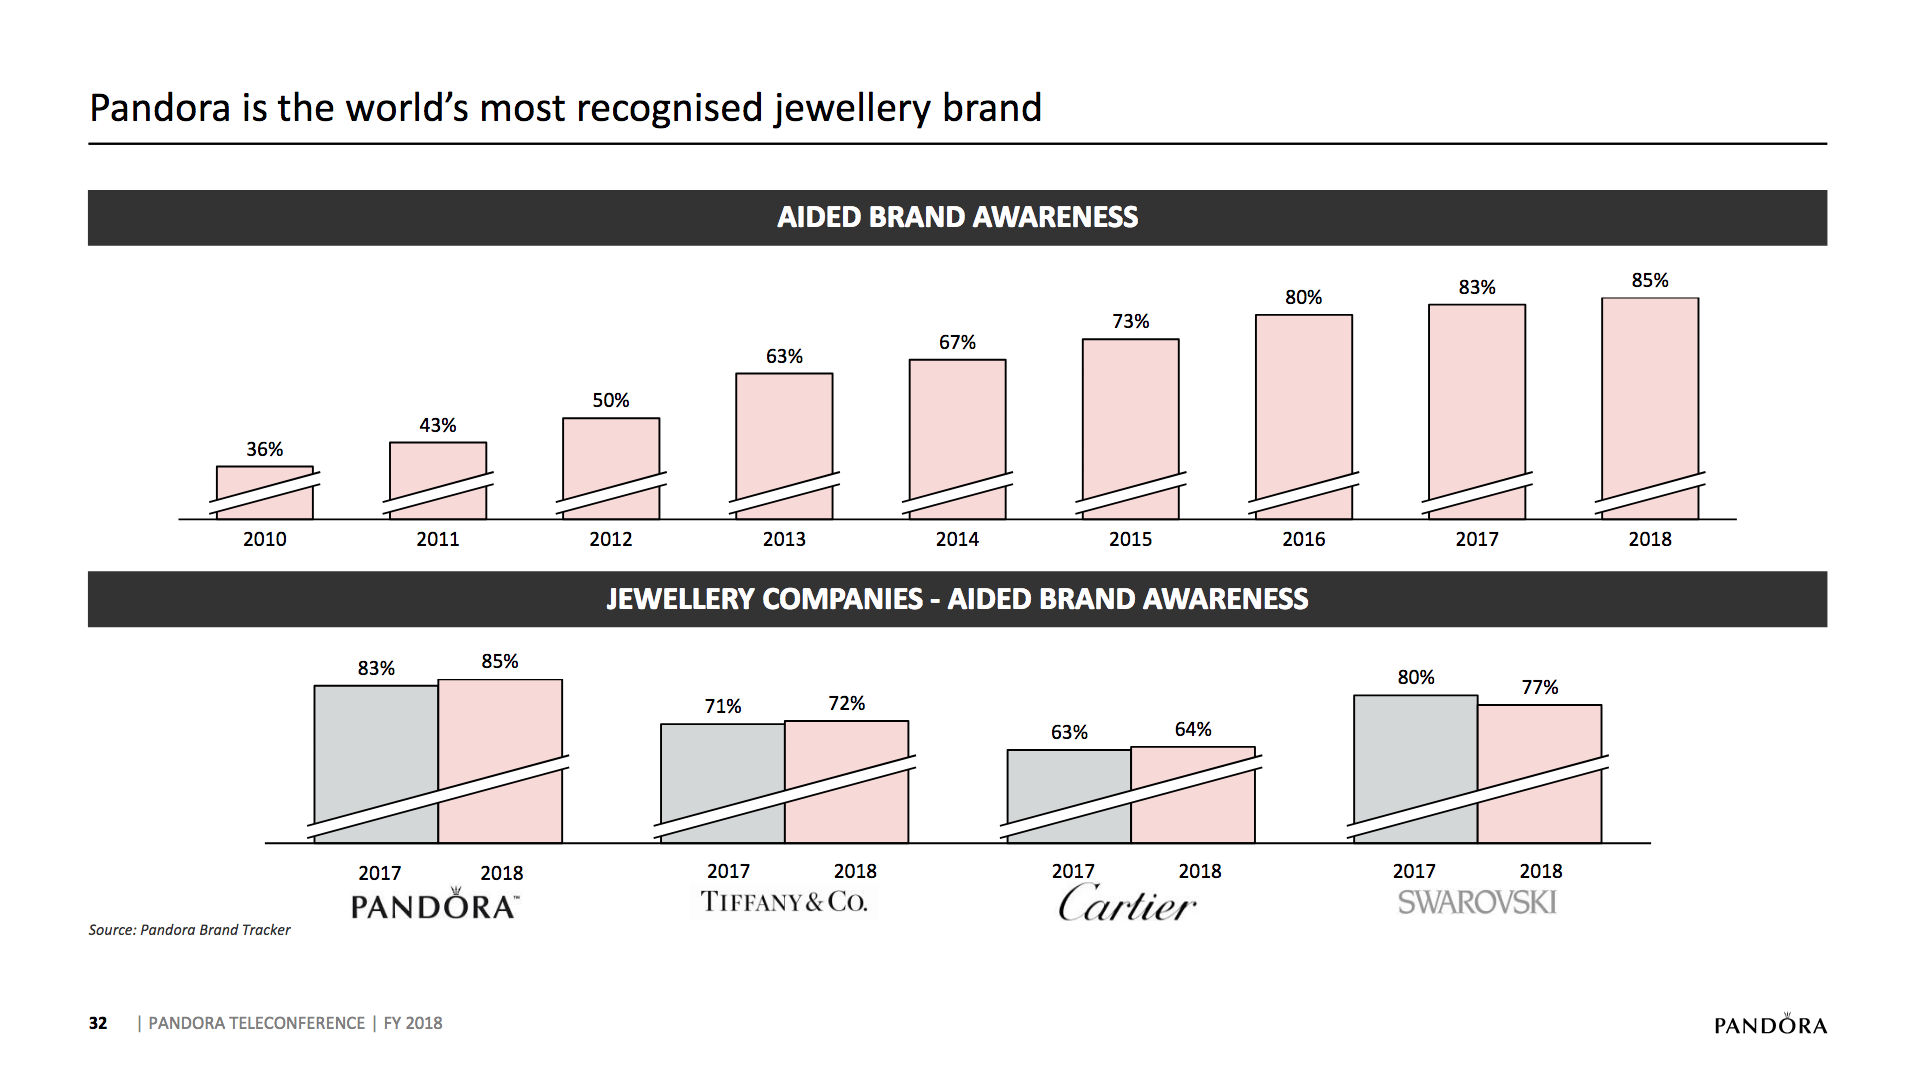
Pandora is one of the largest luxury brands in the world and could overtake Tiffany & Co. in terms of revenue before the end of the next decade.
Pandora has better margins than most other luxury brands.
Pandora is still the most well recognised jewellery brand in the world.