Kraft Heinz issued a press release on its Q2 earnings on August 8th and has with delay filed its 10Qs for Q1 and Q2 on August 14th. This article will cover a) the goodwill and asset impairment losses, b) the compression of profit margins, c) the debt and bond grade situation, d) the dividend and e) the current value of the company.
Goodwill and asset impairment losses
Additional goodwill write-down and asset impairment losses were observed in Q1 and Q2 in all geographic segments, although they were dwarfed by those in Q4.

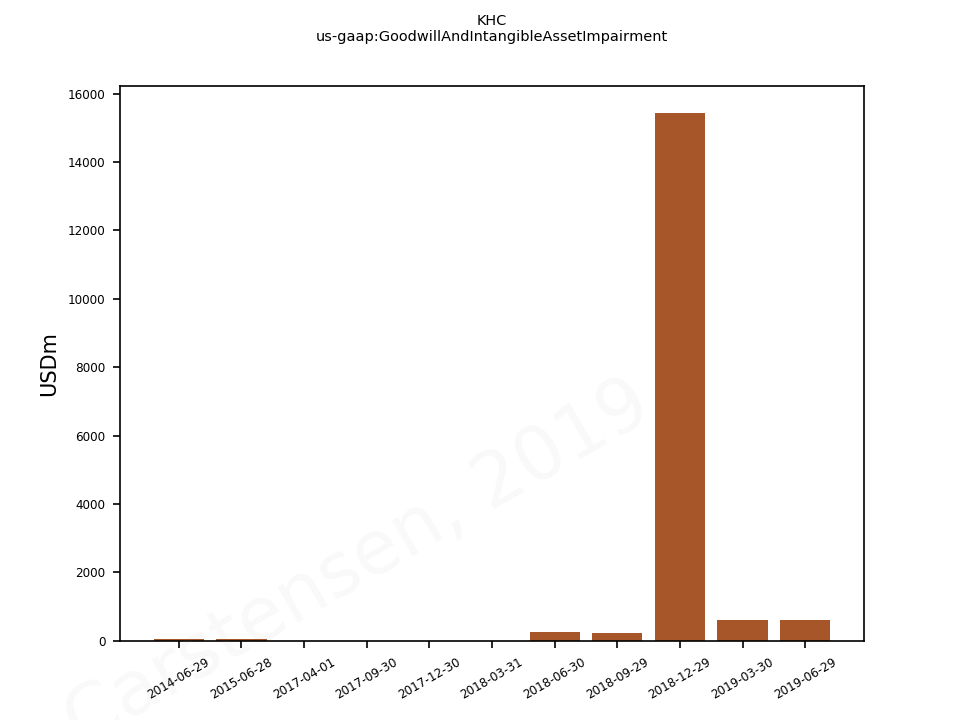


The outgoing CFO David Knopf had the following comments during the Q&A session of the earnings call regarding future impairments.
On the impairment side, first off our impairment testing as you know occurs in 2Q every year. And so we performed our testing procedure this year after we file the 10-K current concurrent with preparing our Q1 and Q2 financial statements. And then to reiterate these are preliminary numbers that we disclose in 8-K. So the preliminary impairment charge in the first half were driven by two main factors. So first off, as you said we did have revised expectations in response to current market factors in some of our international businesses that were evaluated during the first quarter of 2019 as we developed these five-year plans. And as a reminder these are EMEA East reporting unit, LTA Exports reporting unit and Brazil where we had an impairment. Secondly, we also had the application of a higher discount rate to reflect the sustained decline in our stock price since the start of the year. And also you should keep in mind that we did start the year at nearly $60 billion of goodwill and indefinite-lived intangibles with less than 20% attrition relative to carrying value. So what that means is there’s going to be risk of future impairments, given any change in forecasts or modeling assumption can particularly trigger that.
Profit margins
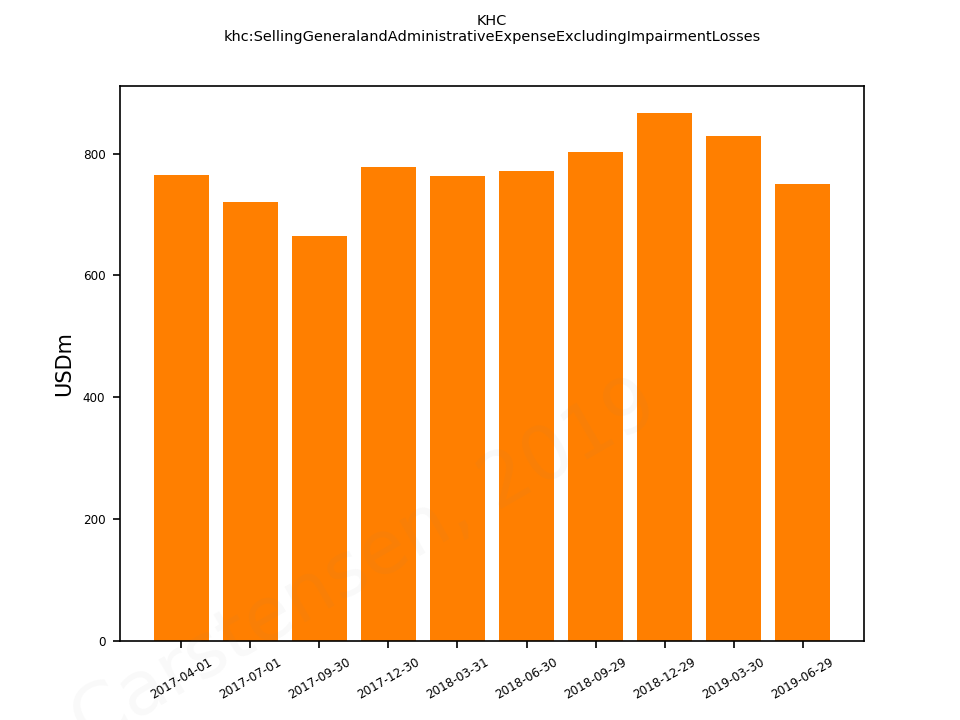
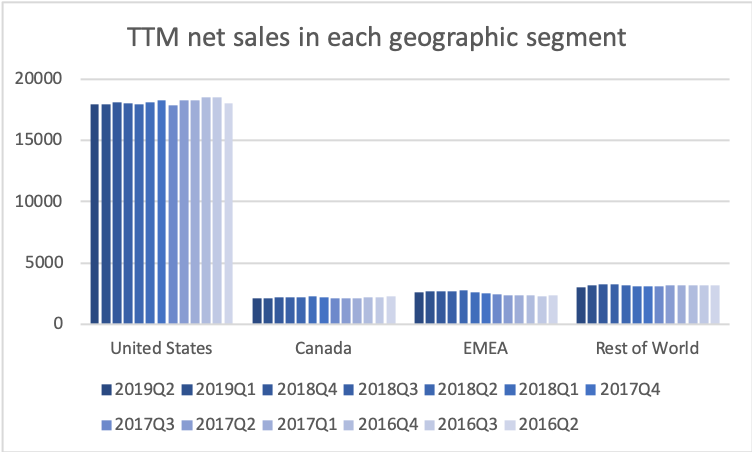
COGS and SG&A excluding impairment losses have been kept somewhat steady in absolute terms for the past quarters but not as a percentage of revenue, because revenue is down. The profit margins are thus down.


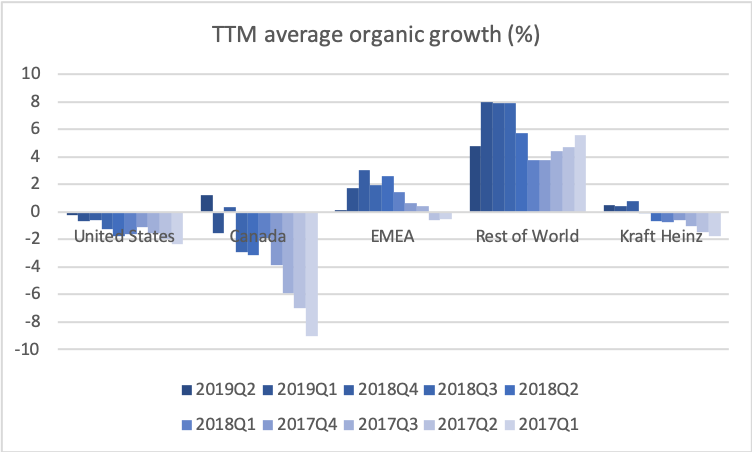
Organic revenue growth
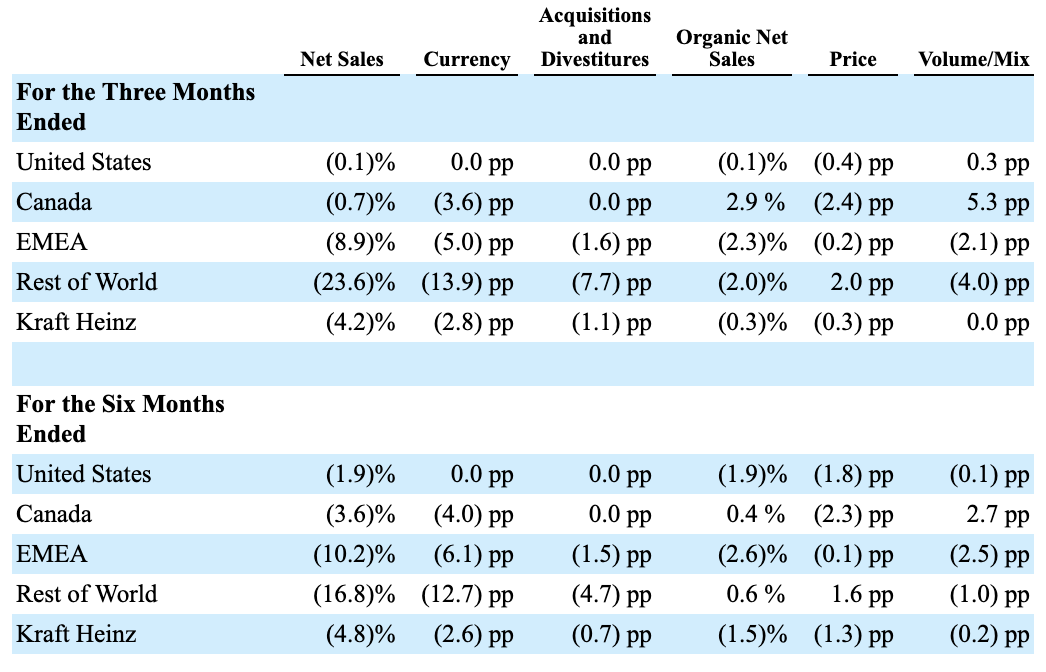
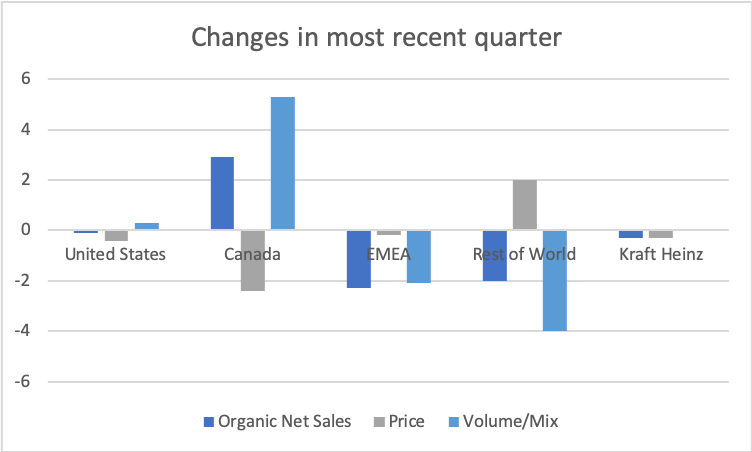
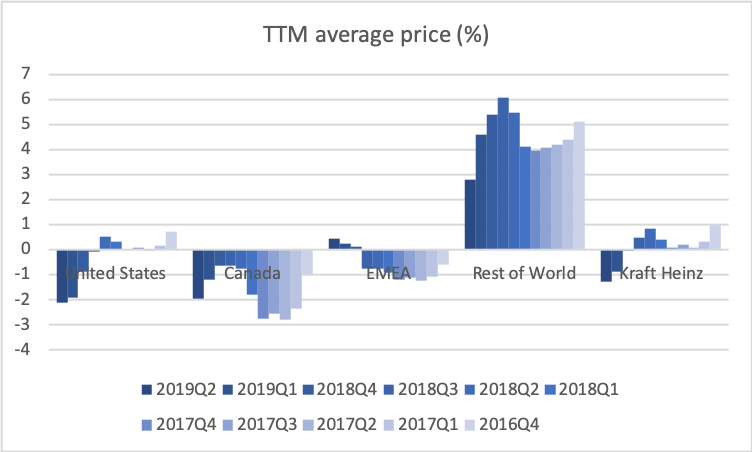
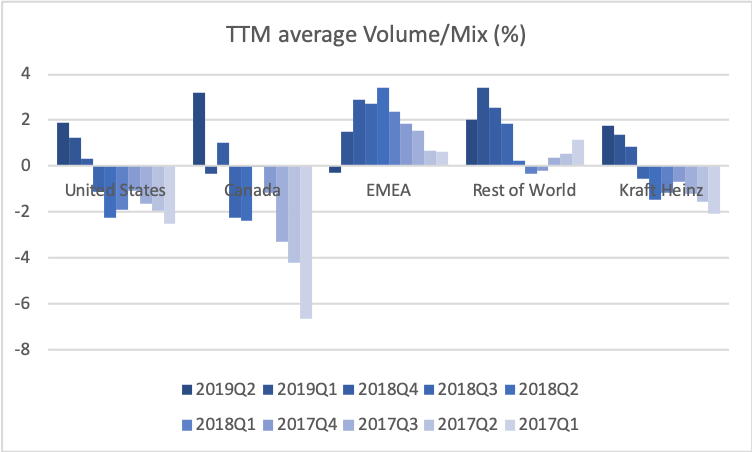
The drop in revenue is caused by a drop in primarily price but also volume/mix in certain geographic segments. The outgoing CFO David Knopf had the following comments on organic growth.
From a total company perspective, organic net sales were down 1.5% in the first half, including an adverse impact of approximately 1.2 percentage points from retail inventory reductions primarily in the U.S. and Canada.
Volume mix was relatively flat in the first half as the reduction in retail inventory levels more than offset consumption growth in the United States, Canada and Latin America. Pricing was negative, down 1.3 percentage points, driven by three factors. The first factor driving lower pricing was unfavorable timing of promotional expense, representing roughly 80 basis point decrease in price on a global basis, including approximately 90 basis points in the U.S.…
The second factor was key commodity driven pricing in North America, representing roughly 30 basis point drag on global pricing in the first half. And third, the remainder primarily reflects continued promotional support behind selects for select U.S. categories, mainly in our Launchables and frozen categories.
Product segments
The product segments taking the biggest hits are “Condiments and sauces” and “Infant and nutrition”.

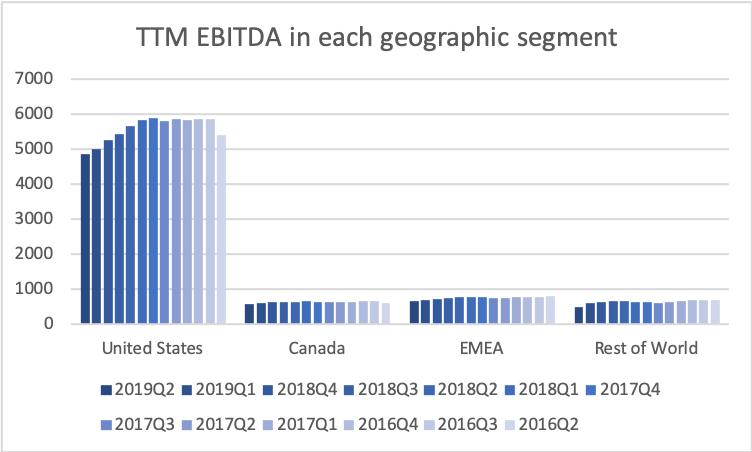
Geographic segments and EBITDA margins
Adjusted EBITDA decreased 19.3 percent versus the year-ago period to $3.0 billion. The CEO had the following comments regarding EBITDA and profitability.
With respect to profitability, we spoke about our first quarter and indeed our first half being up against our toughest EBITDA comparisons for the year. This reflected our expected net inflation curve, stepped up fixed cost investments and retail channel growth, marketing and our people, as well as pricing not beginning to take effect until the second quarter.
First and foremost the company had a significant decline in adjusted EBITDA margins from a peak of 29.4% in the fiscal 2017 to roughly 24.5% for the trailing 12 months through the end of June this year. This was driven by a combination of inflation in our supply chain, including packaging, freight, overtime, and maintenance costs, as well as significant step up in fixed costs to support sales growth with price increases lagging higher costs.
EBITDA is down in all geographic segments; US -10.7%, Canada -17.0%, EMEA -17.1%, rest of the world -52%. The latter partly because of the Venezuelan Bolivar and the divestiture of Heinz India and the brands Complan, GluconD, Sampriti, Nycil to Zydus Cadila.
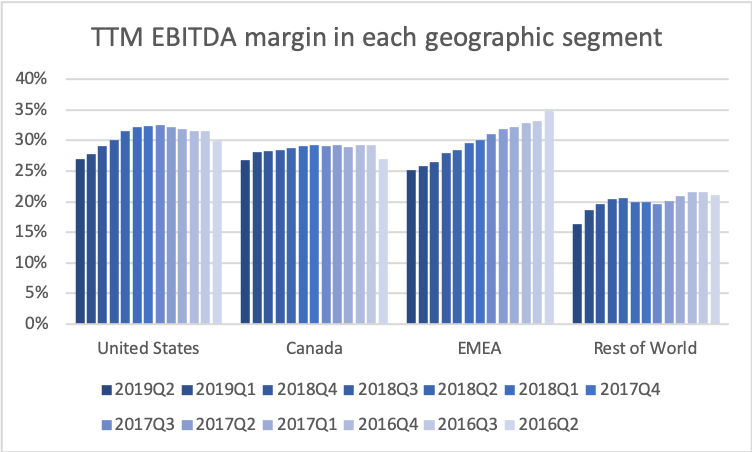
The comments to each of the geographic segments in the 10Qs are as follows.
US – Segment Adjusted EBITDA decreased 10.7% to $1.3 billion for the three months ended June 29, 2019 compared to $1.4 billion for the three months ended June 30, 2018. This decrease was primarily due to cost inflation in manufacturing and procurement, and the unfavorable volume/mix due to higher sales of lower margin products in the current period.
Canada – Segment Adjusted EBITDA decreased 17.0% to $143 million for the three months ended June 29, 2019 compared to $173 million for the three months ended June 30, 2018 partially due to the unfavorable impact of foreign currency (2.8 pp). Excluding the currency impact, Segment Adjusted EBITDA decreased primarily due to lower pricing and higher input costs, partially offset by favorable volume/mix.
EMEA – Segment Adjusted EBITDA decreased 17.1% to $171 million for the three months ended June 29, 2019 compared to $206 million for the three months ended June 30, 2018, including the unfavorable impact of foreign currency (4.6 pp). Excluding the currency impact, the decrease was primarily due to higher supply chain costs, lower Organic Net Sales, and investments in marketing and people.
Rest of the world – Segment Adjusted EBITDA decreased 52.1% to $102 million for the three months ended June 29, 2019 compared to $213 million for the three months ended June 30, 2018 including the unfavorable impact of foreign currency (30.2 pp, including 26.5pp from the devaluation of the Venezuelan bolivar). Excluding the currency impact, the decrease in Segment Adjusted EBITDA was primarily due to the sale of the Heinz India business, higher supply chain costs, and lower sales in Asia Pacific.
Debt situation and bond rating
The CFO had the following comment on the debt situation during his opening remarks.
From a forward-looking perspective, we have now completed the two divestitures we previously announced: India nutritional beverages and Canada natural cheese. These divestitures resulted in a combined after-tax proceeds of more than $1.5 billion. And we remain committed to using those proceeds to further deleverage and strengthen our balance sheet.
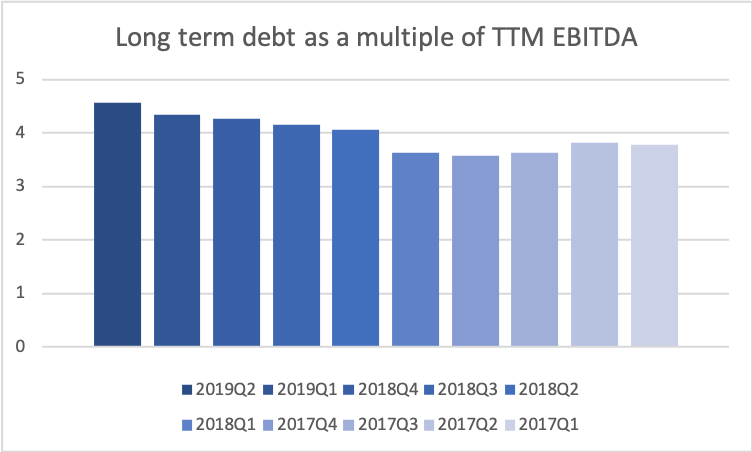
Long term debt has remained somewhat constant for several quarters and as a consequence so have the interest expenses.

Interest expenses are approximately $300M per quarter, which is approximately 5% of total net sales.

As a consequence of the EBITDA being down and the long term debt not decreasing noticeably the debt to EBITDA ratio is up.
S&P warned Kraft Heinz on August 23rd that their bond rating might be cut to junk, if they don’t cut their debt. The CEO Miguel Patricio had the following comment in his opening remarks during the earnings call.
We absolutely remain committed to our investment grade credit rating.
Debt was paid in the 3rd quarter of 2018 and 2019 and more debt is maturing in 2020; below according to the most recent 10Q.

We repaid approximately $350 million aggregate principal amount of senior notes on August 9, 2019.
We have aggregate principal amount of senior notes of approximately $900 million maturing in February 2020 and approximately 800 million Canadian dollars and $1.5 billion maturing in July 2020. We expect to fund these long-term debt repayments primarily with cash on hand, cash generated from our operating activities, proceeds from our divestiture in Canada, and potential new issuances of short-term or long-term debt.
Dividend and payout ratio
The CFO had the following comment on the dividend during the Q&A part of the earnings call.
As we said before we are committed to our investment grade rating and we firmly believe that our business today generates sufficient free cash flow to support both delevering organically over time as we’ve committed as well as to support the current dividend payout that we have. On top of that we have taken actions as you know earlier this year to accelerate the delevering producing our dividend and successfully divesting India beverages and Canada cheese businesses a couple of digits multiple. So again we feel that the business currently generates sufficient cash flow to cover the dividend and also to delever organically.
The payout ratio will probably be firmly above 80% for the time being.

Valuation
In terms of for example enterprise value to operating income Kraft Heinz is trading at absolute rock bottom prices in historical terms and relative to its peers.
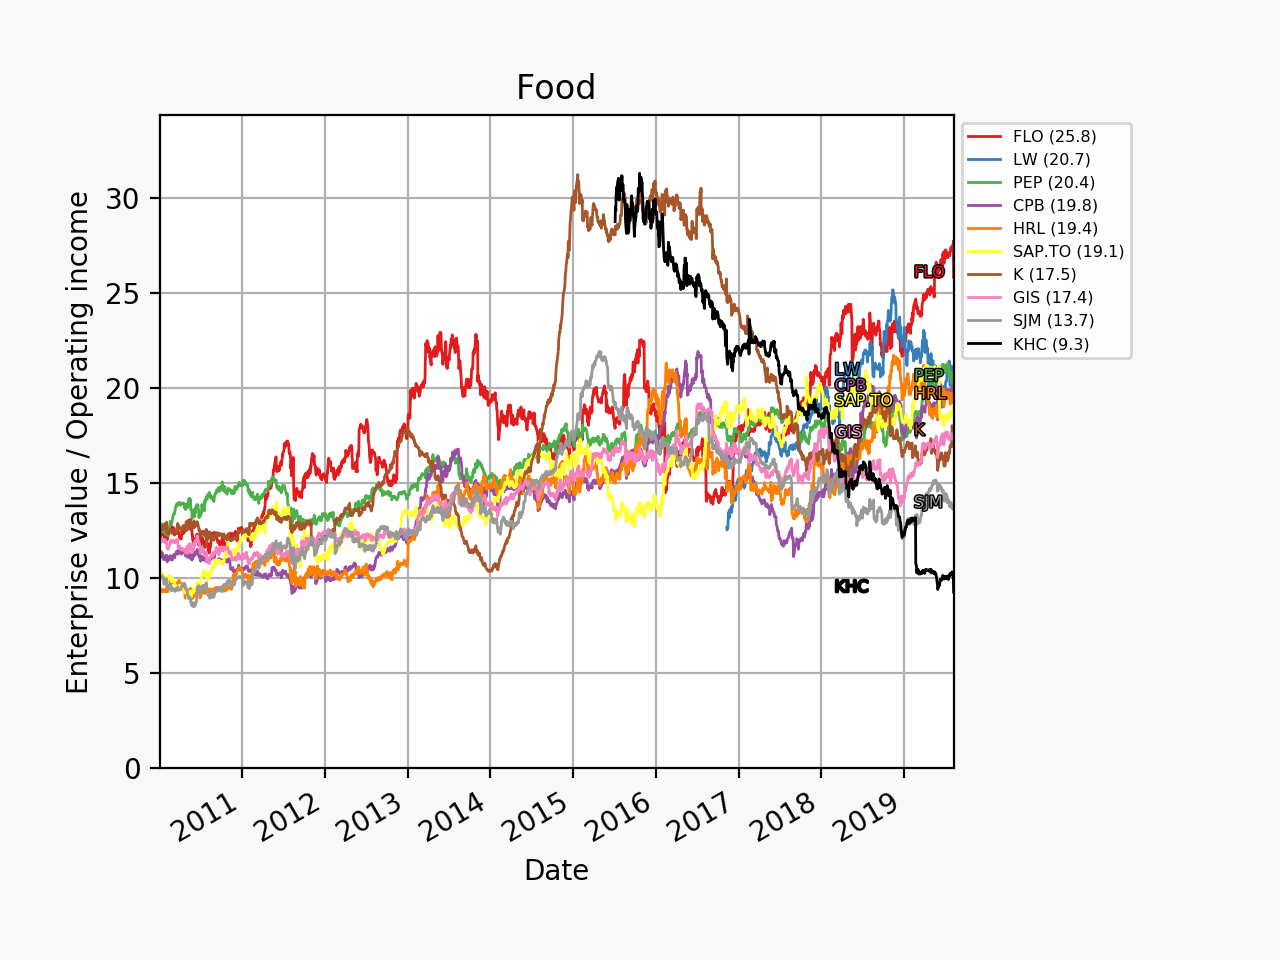

This low valuation should of course be seen in the context of the debt load, but also in the context of operating margins of 20% still being at the top of the industry.


Summary
If there were to be additional significant impairment losses to report it is probably not too far fetched to think that the CEO would have reported them by now. If there are no significant impairment losses in Q3 this could be a positive catalyst. And vice versa.
Media coverage
Bloomberg 08Aug – Kraft Heinz, Tired of ‘Fire Fighting,’ Feels Wall Street Heat
Bloomberg 08Aug – Kraft Heinz Hadn’t Hit Bottom After All
Reuters 08Aug – Kraft Heinz withdraws outlook after dismal results