The largest financial scandal ever has arrived at the shores of Denmark. It involves money laundering at the Estonian branch of Danske Bank; the largest bank in Denmark. The story was first brought to daylight by Danish newspaper Berlingske in collaboration with journalists from the Russian newspaper Novaya Gazeta in March 2017:
Laundered billions poured through Danish banks
Recently it has received widespread media attention, as the reported numbers have grown to a somewhat astronomical size. Wednesday Danske Bank announced the conclusion of their investigation in a press release. The CEO (Thomas Borgen) also announced he would be stepping down voluntarily. Here a few of the recent articles regarding the case from the WSJ and others:
Sep20 WSJ: Denmark Reopens Investigation into Russia-Linked Money Laundering Case
Sep19 Reuters: Danske Bank CEO quits over $234 billion money laundering scandal
Sep19 Guardian: Danske Bank chief resigns over €200bn money-laundering scandal
Sep19 NYT: Danske Bank Says Billions May Have Been Laundered at Single Branch
Sep19 CNBC: Danske Bank CEO quits in a $234 billion money laundering scandal
Sep14 WSJ: U.S. Probes Danske Bank Over Russian Money Laundering Allegations
The Danish and Estonian Financial Services Authorities released a joint statement in May and the former has commented on the case and commented on the investigation by Danske Bank.
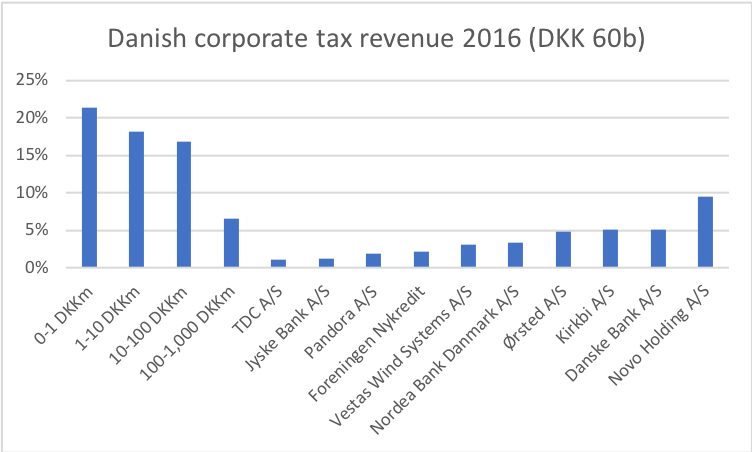
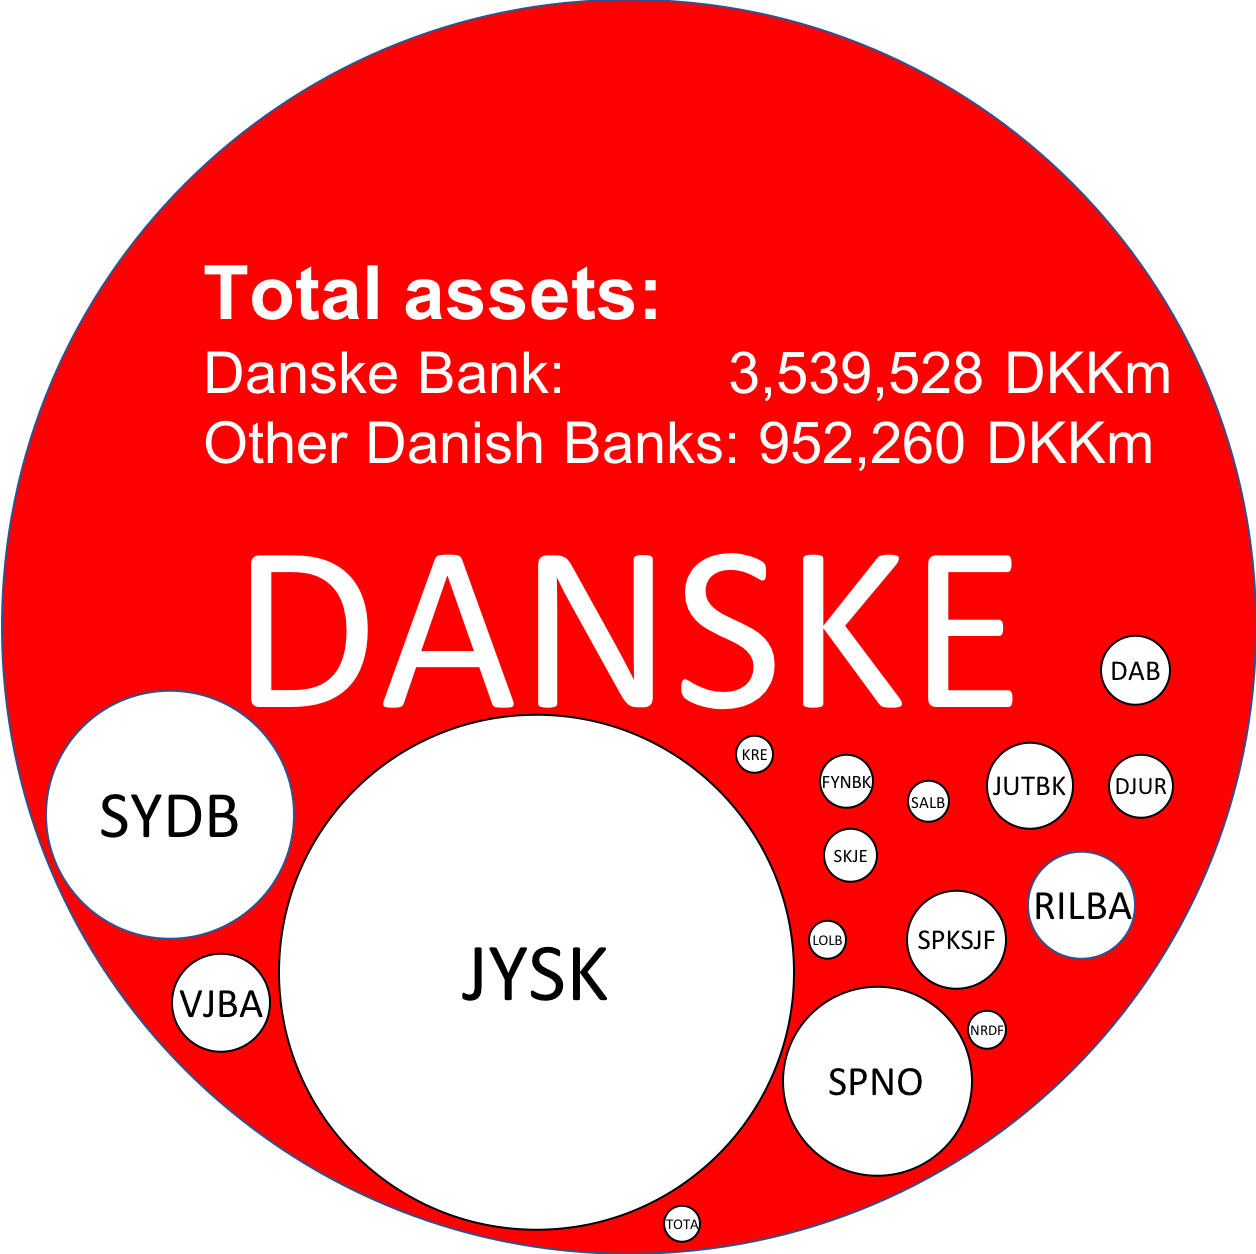
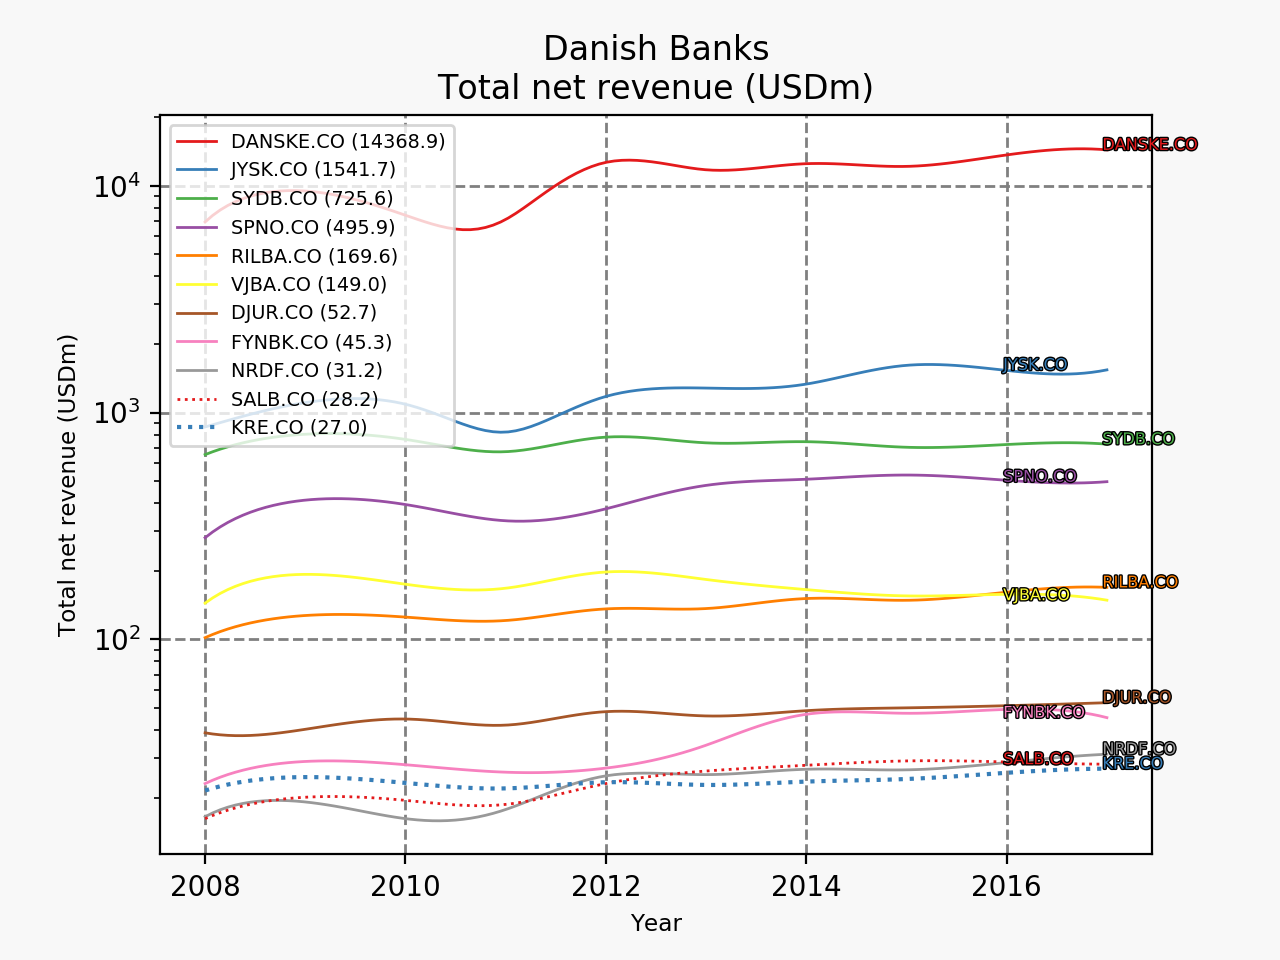
I thought it would be beneficial to myself and others to get a grasp of just how big Danske Bank is, so I created 1) a figure showing the size of Danske Bank compared to other Danish banks in terms of assets, 2) a chart showing the revenue over time of Danish banks, 3) a table showing the size of Danske Bank and other international money center banks relative to GDP and 4) a histogram showing Danske Bank contributing approximately DKK3b of DKK60b in corporate tax revenue in 2016. I think it’s fair to say that the conclusion is that Danske Bank is BIG relative to its peers and the Danish GDP.
| Country | Name | Assets (USDm) | Assets / GDP (%) |
|---|---|---|---|
 | JPMorgan | 2,533,600 | 13% |
| Bank of America | 2,281,234 | 12% |
| Wells Fargo | 1,951,757 | 10% |
| Citigroup | 1,842,465 | 10% |
 | Danske Bank | 559,167 | 172% |
 | Svenska Handelsbanken | 315,505 | 59% |
| Skandinaviska Enskilda Banken | 291,858 | 54% |
| Swedbank | 252,296 | 47% |